
 Greetings, friends! The excitement in the data protection community has been brewing, and for a very good reason. After being inundated with inquiries, it’s finally time to lift the veil on the next big thing in the Grafana blog series – a freshly minted Grafana Dashboard for Veeam Backup & Replication, now leveraging the power of the novel VBR API.
For those familiar with the data protection scene, you might recall that we’ve already got a Grafana Dashboard dedicated to the Veeam Enterprise Manager API since 2020. A vanguard of its time, the pioneering tool offered impressive capabilities and has seen its fair share of success with more than 1000 downloads.
However, this cutting-edge dashboard catapults us into a new era. Breaking away from the reliance on Enterprise Manager, this new dashboard gets down to brass tacks, focusing solely on the Veeam Backup & Replication REST API. Not only does this ensure seamless interplay with various Veeam Servers, but it also paves the way for a larger community engagement, propelling us into an innovative frontier of data protection visibility using OSE tools like Grafana.
With this new dashboard at your fingertips, I am eagerly looking forward to fostering a vibrant community around it. I am inviting all of you to start utilizing this state-of-the-art tool, bring forth your feedback, and spark discussions in the comments, or GitHub, for enhancements and improvements.
Grafana Dashboard for Veeam Backup & Replication API
When you finish the entry you will have something similar to this. It might be different according to your environment, number of days you select, protected workloads, jobs, etc.
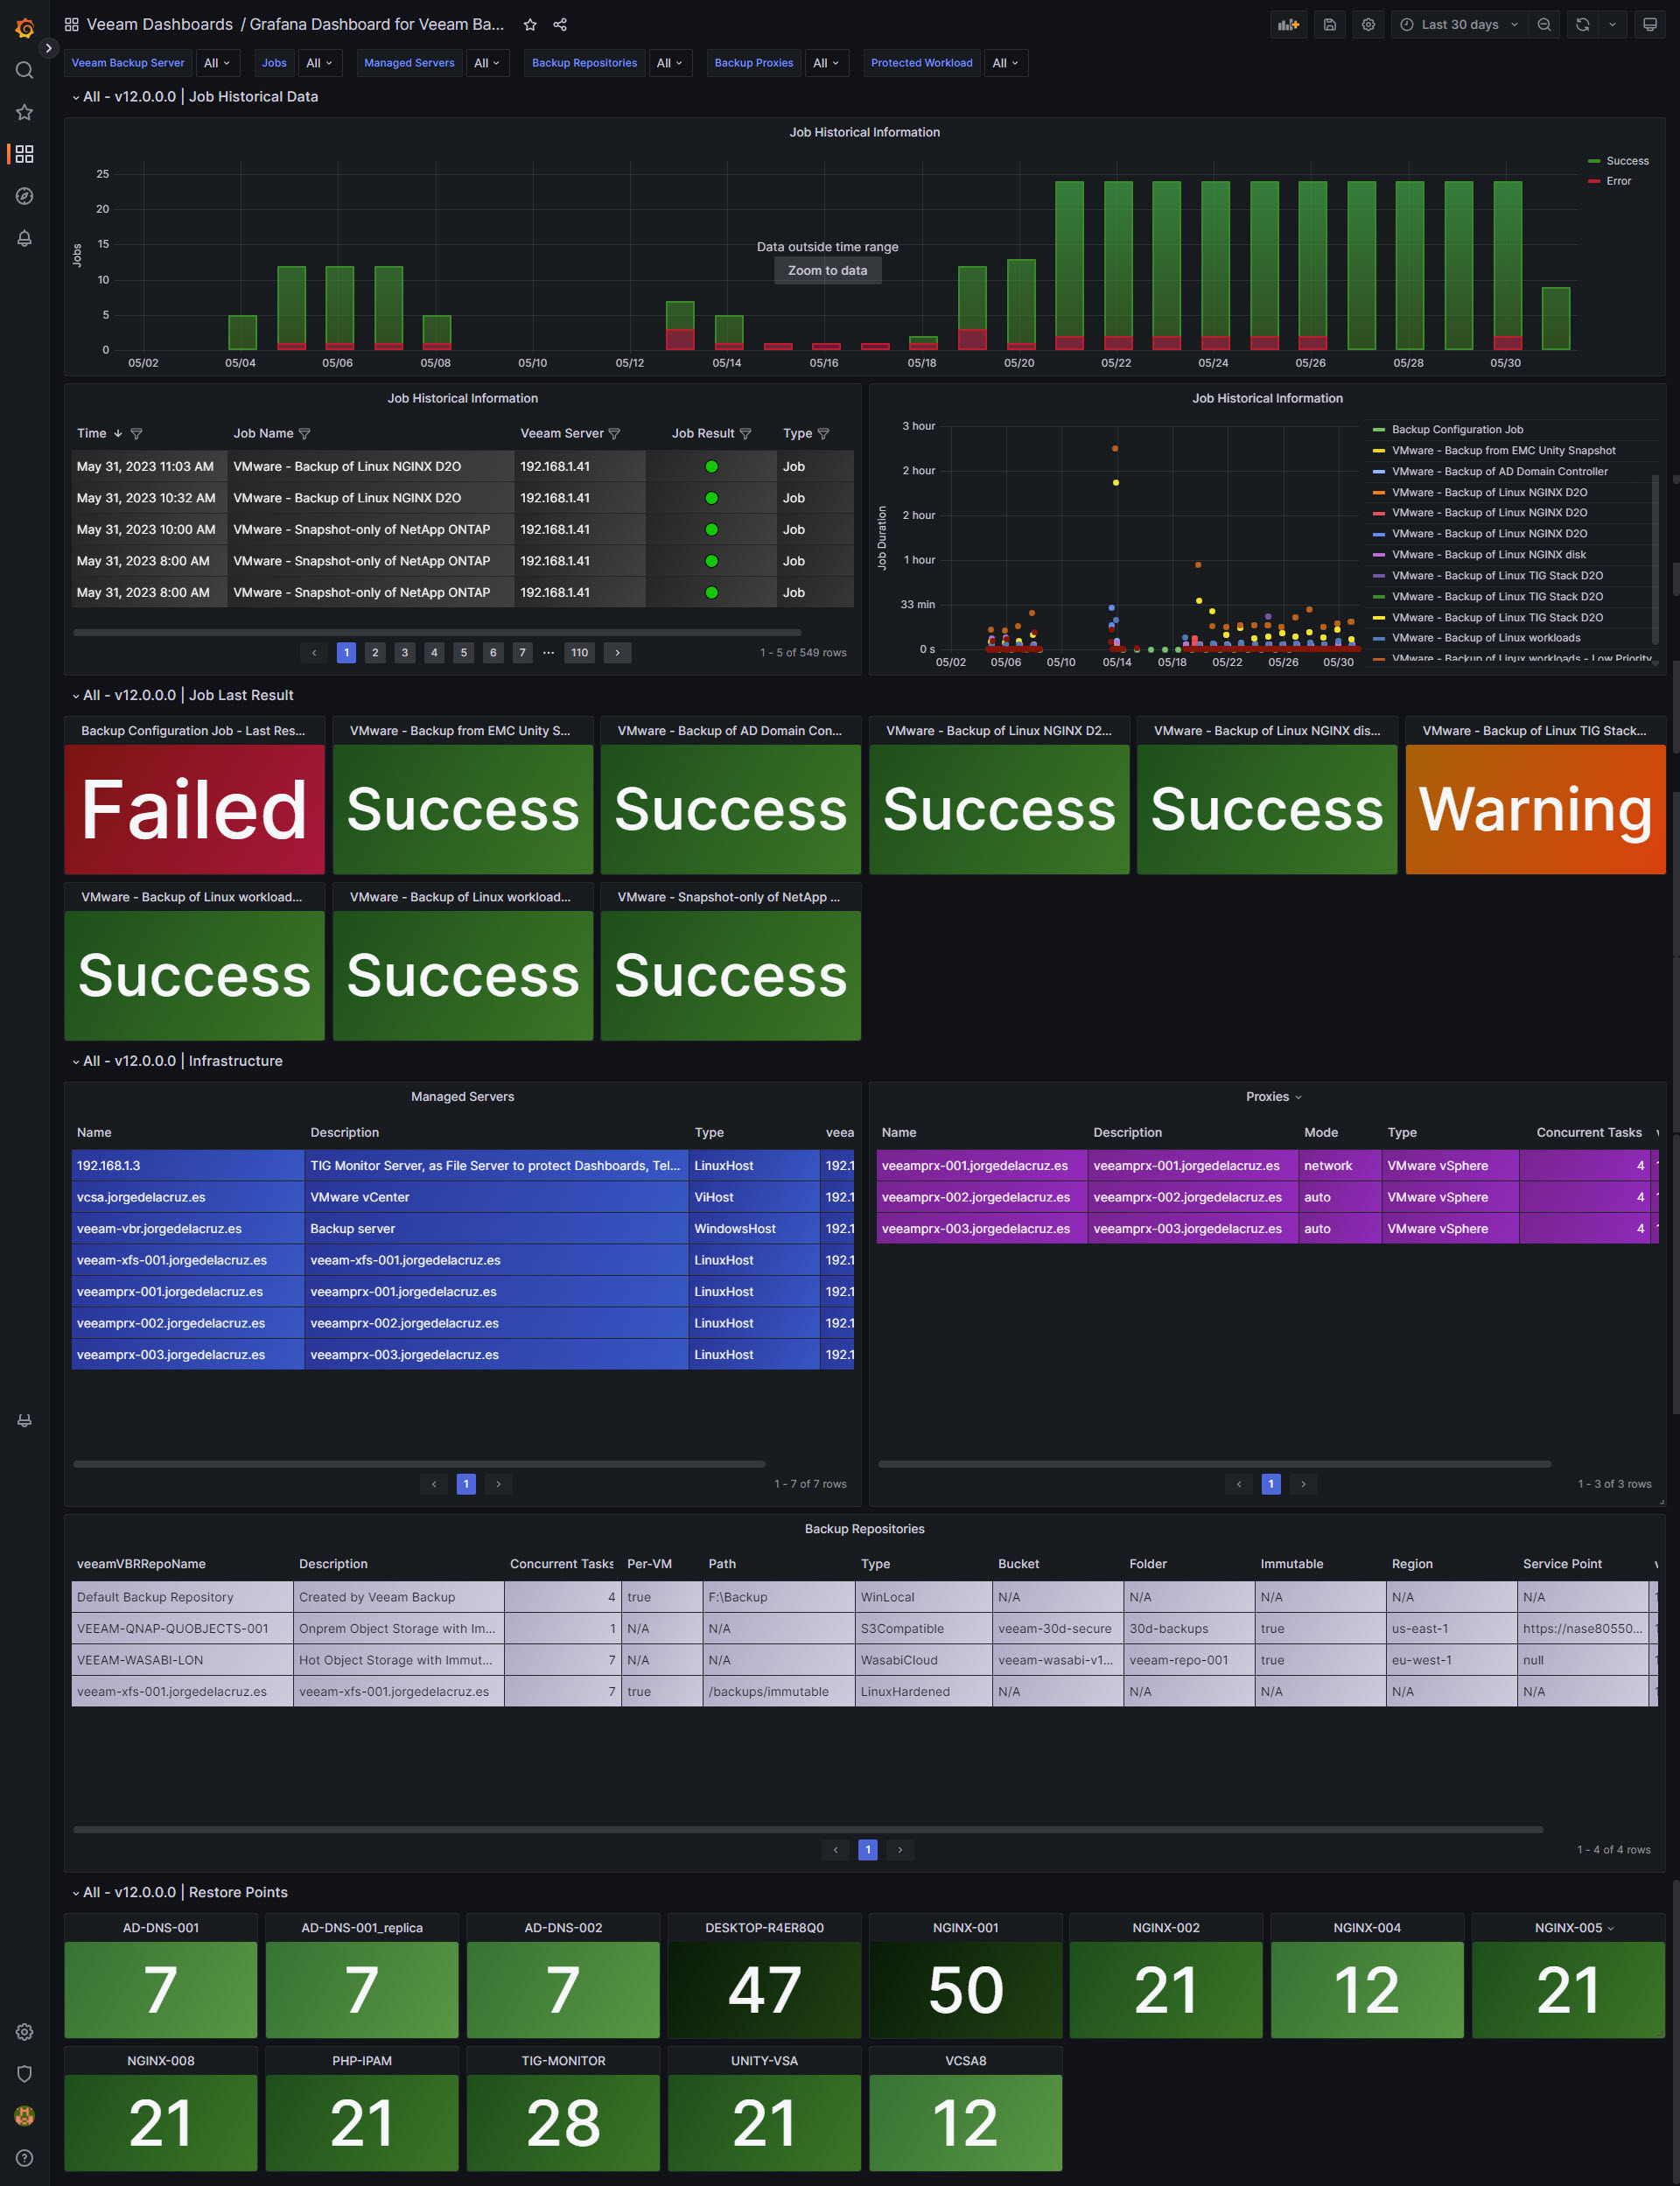
Dashboard – Summary
- Job Historical Information – The very first graph. The most important one in my opinion. Grouped by 24 hours, get to know the status of your policies per day, on a range in time.
- Job Historical Information Table – Very similar to the previous panel, but this time with more details about job name, status, date, etc.
- Job Historical Information Duration – Very similar to previous panels, but this time showing in a bubble way, how much every job has taken to execute. A very cool way to see what jobs are taking the longer, trends, etc.
- Job Last Result – BIG COLORED PANELS, what everyone I talk about is asking for. Get to know the last status across all jobs, and focus only on the ones are yellow/red.
- Infrastructure – A few tables that shows some Infrastructure data across the Veeam Backup & Replication. A lot to improve here, but so far the VBR API doesn’t give us much more details.
- Restore Points – More big panels in colors. The more points, the darker the green becomes. This is a list of all your workloads, or the selected workload on top, with the amount of restore points to date.
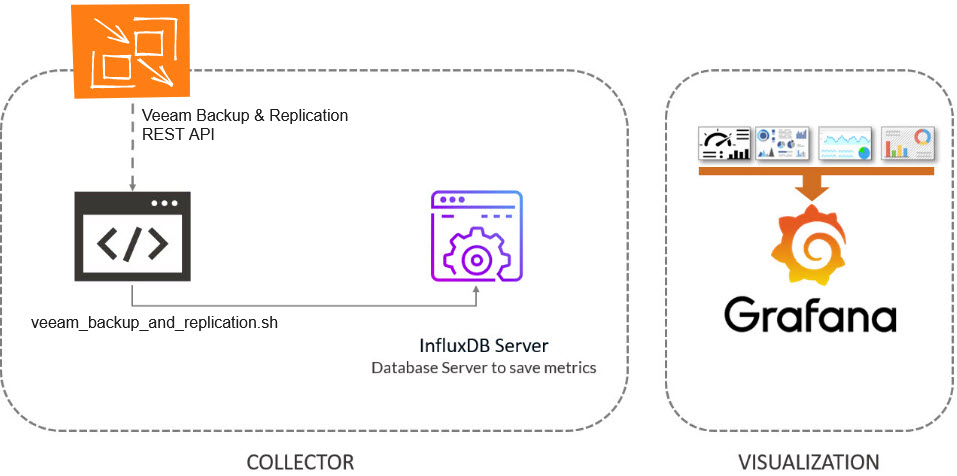
Topology with all logical components
This entry is very similar to the previous ones, we will use a bash shell script that connects to our Veeam Backup & Replication Servers, using the REST API, and then will send the metrics to InfluxDB, and visualize them with Grafana . The design would be something similar to this:
Download and configure the veeam_backup_and_replication.sh script
We have almost everything ready, we have one last step, the script that will make all this work, we will download the latest version from the Github repository:
You will need jq, so please go ahead and install it first (apt-get install jq, or yum install jq)
This shell script can be downloaded and run from the telegraf server, InfluxDB, or any other Linux. We will have to edit the configuration parameters:
##
# Configurations
##
# Endpoint URL for InfluxDB
veeamInfluxDBURL="http://YOURINFLUXSERVERIP" #Your InfluxDB Server, http://FQDN or https://FQDN if using SSL
veeamInfluxDBPort="8086" #Default Port
veeamInfluxDBBucket="veeam" # InfluxDB bucket name (not ID)
veeamInfluxDBToken="TOKEN" # InfluxDB access token with read/write privileges for the bucket
veeamInfluxDBOrg="ORG NAME" # InfluxDB organisation name (not ID)

# Endpoint URL for login action
veeamJobSessions="1000"
veeamUsername="YOURVBRUSER"
veeamPassword="YOURVBRPASSWORD"
veeamBackupServer="YOURVBRAPIPORT"
veeamBackupPort="9419" #Default Port
Once the changes are done, make the script executable with chmod:
chmod +x veeam_backup_and_replication.sh
The output of the command should be something like the next, without errors:
Writing veeam_vbr_info to InfluxDB
Writing veeam_vbr_sessions to InfluxDB
Writing veeam_vbr_sessions to InfluxDB
Writing veeam_vbr_sessions to InfluxDB
Writing veeam_vbr_sessions to InfluxDB
Writing veeam_vbr_sessions to InfluxDB
If so, please now add this script to your crontab, like for example every 30 minutes:
*/30 * * * * /home/oper/veeam_backup_and_replication.sh >> /var/log/veeam_backup_and_replication.log 2>&1
Grafana Dashboards
I created a Dashboard from scratch by selecting the best requests to the database, finishing off colors, thinking about graphics, and how to display them, and everything is automated so that it fits our environment without any problem and without having to edit anything manually. The Dashboard can be found here, once imported, you can use the top drop-down menus to select between Servers, Workloads, Jobs, etc.:
Import Grafana Dashboards easily
So that you don’t have to waste hours configuring a new Dashboard, and ingesting and debugging what you want, I have already a wonderful Dashboard with everything you need to monitor our environment in a very simple way, you will be like the image I showed you above. Select the name you want and enter the ID: 18854, which is the unique ID of the Dashboard, or the URL:
 With the menus above you can display and adjust the Dashboard to your different choices:
Please leave your feedback in the comments, or on GitHub.
I hope you like it, and I would like to leave you the complete series here, so you can start playing with the plugins that I have been telling you about all these years:
- Looking for the Perfect Dashboard: InfluxDB, Telegraf, and Grafana – Part I (Installing InfluxDB, Telegraf, and Grafana on Ubuntu 20.04 LTS)
- En busca del Dashboard perfecto: InfluxDB, Telegraf y Grafana – Parte II (Instalar agente Telegraf en Nodos remotos Linux)
- En busca del Dashboard perfecto: InfluxDB, Telegraf y Grafana – Parte III Integración con PRTG
- En busca del Dashboard perfecto: InfluxDB, Telegraf y Grafana – Parte IV (Instalar agente Telegraf en Nodos remotos Windows)
- En busca del Dashboard perfecto: InfluxDB, Telegraf y Grafana – Parte V (Activar inputs específicos, Red, MySQL/MariaDB, Nginx)
- En busca del Dashboard perfecto: InfluxDB, Telegraf y Grafana – Parte VI (Monitorizando Veeam)
- En busca del Dashboard perfecto: InfluxDB, Telegraf y Grafana – Parte VII (Monitorizar vSphere)
- En busca del Dashboard perfecto: InfluxDB, Telegraf y Grafana – Parte VIII (Monitorizando Veeam con Enterprise Manager)
- En busca del Dashboard perfecto: InfluxDB, Telegraf y Grafana – Parte IX (Monitorizando Zimbra Collaboration)
- En busca del Dashboard perfecto: InfluxDB, Telegraf y Grafana – Parte X (Grafana Plugins)
- En busca del Dashboard perfecto: InfluxDB, Telegraf y Grafana – Parte XI – (Monitorizando URL e IPS con Telegraf y Ping)
- Looking for the Perfect Dashboard: InfluxDB, Telegraf, and Grafana – Part XII (Native Telegraf Plugin for vSphere)
- Looking for the Perfect Dashboard: InfluxDB, Telegraf, and Grafana – Part XIII (Veeam Backup for Microsoft Office 365 v4)
- Looking for the Perfect Dashboard: InfluxDB, Telegraf, and Grafana – Part XIV – Veeam Availability Console
- Looking for the Perfect Dashboard: InfluxDB, Telegraf, and Grafana – Part XV (IPMI Monitoring of our ESXi Hosts)
- Looking for Perfect Dashboard: InfluxDB, Telegraf, and Grafana – Part XVI (Performance and Advanced Security of Veeam Backup for Microsoft Office 365)
- Looking for the Perfect Dashboard: InfluxDB, Telegraf, and Grafana – Part XVII (Showing Dashboards on Two Monitors Using Raspberry Pi 4)
- En busca del Dashboard perfecto: InfluxDB, Telegraf y Grafana – Parte XVIII – Monitorizar temperatura y estado de Raspberry Pi 4
- Looking for the Perfect Dashboard: InfluxDB, Telegraf, and Grafana – Part XIX (Monitoring Veeam with Enterprise Manager) Shell Script
- Looking for the Perfect Dashboard: InfluxDB, Telegraf, and Grafana – Part XXIV (Monitoring Veeam Backup for Microsoft Azure)
- Looking for the Perfect Dashboard: InfluxDB, Telegraf, and Grafana – Part XXV (Monitoring Power Consumption)
- Looking for the Perfect Dashboard: InfluxDB, Telegraf, and Grafana – Part XXVI (Monitoring Veeam Backup for Nutanix)
- Looking for the Perfect Dashboard: InfluxDB, Telegraf, and Grafana – Part XXVII (Monitoring ReFS and XFS (block-cloning and reflink)
- Looking for the Perfect Dashboard: InfluxDB, Telegraf, and Grafana – Part XXVIII (Monitoring HPE StoreOnce)
- Looking for the Perfect Dashboard: InfluxDB, Telegraf, and Grafana – Part XXIX (Monitoring Pi-hole)
- Looking for the Perfect Dashboard: InfluxDB, Telegraf, and Grafana – Part XXIX (Monitoring Veeam Backup for AWS)
- Looking for the Perfect Dashboard: InfluxDB, Telegraf, and Grafana – Part XXXI (Monitoring Unifi Protect)
- Looking for the Perfect Dashboard: InfluxDB, Telegraf, and Grafana – Part XXXII (Monitoring Veeam ONE – experimental)
- Looking for the Perfect Dashboard: InfluxDB, Telegraf, and Grafana – Part XXXIII (Monitoring NetApp ONTAP)
- Looking for the Perfect Dashboard: InfluxDB, Telegraf, and Grafana – Part XXXIV (Monitoring Runecast)
- Looking for the Perfect Dashboard: InfluxDB, Telegraf, and Grafana – Part XXXV (GPU Monitoring)
- Looking for the Perfect Dashboard: InfluxDB, Telegraf, and Grafana – Part XXXVI (Monitoring Goldshell Miners – JSONv2)
- Looking for the Perfect Dashboard: InfluxDB, Telegraf, and Grafana – Part XXXVII (Monitoring Veeam Backup for Google Cloud Platform)
- En Busca del Dashboard perfecto: InfluxDB, Telegraf y Grafana – Parte XXXVIII (Monitorizando Temperatura y Humedad con Xiaomi Mijia)
- Looking for the Perfect Dashboard: InfluxDB, Telegraf, and Grafana – Part XL (Veeam Backup for Microsoft 365 – Restore Audit)
- Looking for the Perfect Dashboard: InfluxDB, Telegraf, and Grafana – Part XLI (Veeam Backup for Salesforce)
- Looking for the Perfect Dashboard: InfluxDB, Telegraf, and Grafana – Part XLII (Veeam ONE v12 Audit Events)
- Looking for the Perfect Dashboard: InfluxDB, Telegraf, and Grafana – Part XLIII (Monitoring QNAP using SNMP v3)
- Looking for the Perfect Dashboard: InfluxDB, Telegraf, and Grafana – Part XLIV (Monitoring Veeam Backup & Replication API)
- Looking for the Perfect Dashboard: InfluxDB, Telegraf, and Grafana – Part XLV (Monitoring Synology using SNMP v3)
- Looking for the Perfect Dashboard: InfluxDB, Telegraf, and Grafana – Part XLVI (Monitoring NVIDIA Jetson Nano)
- Looking for the Perfect Dashboard: InfluxDB, Telegraf, and Grafana – Part XLVII (Monitoring Open WebUI)
- Looking for the Perfect Dashboard: InfluxDB, Telegraf, and Grafana – Part XLVIII (Monitoring Veeam Data Platform Advanced)
- Looking for the Perfect Dashboard: InfluxDB, Telegraf, and Grafana – Part XLIX (Monitoring Unofficial Veeam ONE Node Exporter)
Beautiful as always. I’m here for the REST and the Roman Numerals.
Thank you so much mate, if you give this a try, let me know.
Hello it will be tremendous addition to our monitoring system but I couldn’t get it to work. I have opened an issue on github about the issue. Basically, script can gather the info but it struggles to write on influxdb. Can you please check?:
https://github.com/jorgedlcruz/veeam-backup-and-replication-grafana/issues/1
Thanks in advance
Hola Jorge, muchas gracias por tus aportes.
Estoy teniendo el mismo error reportado por CNone, el entorno de Grafana, Influx, Telegraf, está en K8s. Apliqué la solución aplicada por el post pero sigue idem. Me recomendarías instalar el entorno en un Linux u alguna otra recomendación? Gracias de nuevo.
Saludos Leandro, tendria que funcionar sin problema, el script que error te da?
Saludos
Hola Jorge. Idem a https://github.com/jorgedlcruz/veeam-backup-and-replication-grafana/issues/1
I received this erros… Veeam 11 Enterprise Plus with Influx DB 2.x
jq: error (at :1): Cannot iterate over null (null)
jq: error (at :1): Cannot iterate over null (null)
jq: error (at :1): Cannot iterate over null (null)
jq: error (at :1): Cannot iterate over null (null)
jq: error (at :1): Cannot iterate over null (null)
Hello,
What licensing you have? Enterprise Plus, VUL?
Hola Jorge,
He descargado el script en una VM Linux. Decir que en esa VM no tengo InfluxDB instalado, tengo el cli de Influx.
Cuando trato de lanzar el script, veo que no me está cogiendo la URL.
Error: failed to write data: Post “http://localhost:8086/api/v2/write?bucket=veeam&org=test&precision=s”: dial tcp [::1]:8086: connect: connection refused
Por probar, he añadido el parámetro –host cada vez que haces un influx write pero también me da error.
Writing veeam_vbr_info to InfluxDB
Error: failed to write data: 400 Bad Request: failed to parse line protocol: errors encountered on line(s):
error parsing line 1 (1-based): Tag Set Malformed
¿Se te ocurre qué puede ser?
Gracias
Hello Jorge,
thank you very much, it’s great…
Hola, parece que el script intenta escribir en localhost, donde no tienes InfluxDB, que tiene tu config al principio, sin passwords?
Hello Jorge!
The entire backend part is working, but it does not display the data in grafana.
Hi Jorge,
First of all thank you very much.
I am trying to setup grafana dashboard for veeam.
I have veeam b&r version 12.
I install grafana v10.4.2.0 on windows server.
I install influxdb v2.7.6 on same windows server
I am running a Ubuntu desktop vm v24.04.
I am trying to run the sh script from this vm but I it’s not working. I m getting an error message,
./veeam.sh: line 43: curl: command not found
./veeam.sh: line 45: Responce.json: No Such file or directory
rm: cannot remove ‘respince.json’: No Such file or directory
An unexpected error occurred with HTTP status code:.
Thanks.
Hi!
I get this error:
root@veeamdashboard:~# ./veeam_backup_and_replication.sh
./veeam_backup_and_replication.sh: line 45: response.json: No such file or directory
rm: cannot remove ‘response.json’: No such file or directory
An unexpected error occurred with HTTP status code: 000.
Any idea on how to find the problem?
Are you running the script from some folder that requires special permissions? Try to save the script to the user folder, non root, some /home/user, etc.
Thank you
Hello
great work
every think is okay regarding api but can written in influx db and hsow to me this error
Hello, what is the error you see?
Hi!
I finally moved to the latest Veeam v12 but i cannot get any data into these:
– “Job last result” (can’t see the Veeam version before the “Last Job result” as your screenshot shows
– “Restore Points”
I get an error with small triangle with the tooltip that reads something like “….invalid token for primary expression…”
Any ideas?
Using Veeam version 12.2.0.334 I don’t get any Job Last result and any Restore Points.
I get no data on those two panels but i get a small triangle with a tooltip that read
“invalid: compilation failed: error @5:8-9:1 expected RPAREN, got EOF…..”
Any idea?
Hola Jorge,
Lo primero, gracias por el trabajo que haces.
Mira, no sé porqué pero no hay manera de que mi dashboard luzca como el tuyo.
En Job Last Result me aparece esto -> “invalid: compilation failed: error @5:6-9:25: expected RPAREN, got EOF error @6:3-6:5: invalid expression: invalid token for primary expression: PIPE_FORWARD”
En Backup Repository – Usage Capacity -> NO DATA
En Restore Points -> N/A
No he cambiado ninguna query, tal cual lo tienes tú, lo importé. ¿Qué puede ser?
Seems broken on 12.2.0.334
Not getting the version of Veeam (usually displayed near some labels), nothing on job last result and nothing on restore points
hello
thanks for dahsboard its good work!
i cant get restore points and job last results
it says invalid: compilation failed: error @5:6-9:25: expected RPAREN, got EOF error @6:3-6:5: invalid expression: invalid token for primary expression: PIPE_FORWARD
may you say me solution 🙂
regards
Hello Michele,
Are you using the latest script available, and dashboard?
Saludos Juanjo, que version de Veeam tienes, y que licencia, de telegraf e influxdb, etc.?
Saludos
Hello,
What version of Veeam are you using?
Hello Ahmet, what version of Veeam do you have?
Hello im using 12.02 and will update 12.03
Yes, latest, downloaded some days ago.
I’m investigating….but it’s very hard for me!
If you’ve some ideas or suggestions, please let me know
Michele
hello,
i have 12.02 and will update 12.03
thanks
Can’t see any repositories on dahsboard, it says no data. And if check veeam bucket there is no measurement:
veeam_vbr_repositories
and no entry for:
veeamVBRRepoName
What might do I need to list the repositories?
Thank you.
Grafana 11.4 Veeam 12.3
Hello, are you using the latest script, and the latest grafana dashboard version as well?
Thank you!
Your comment is awaiting moderation.
i have a veeam 12.2 and enterprise manager accordingly i have created local user and tried setting it for portal admin
but i still get this:
Unauthorized: Authentication failed
Any idea of where i failed?
Hello,
What license do you have? Does the user has MFA enabled? Can you login normally on VBR API Swagger?
I have tried to implement the new script and it says: Bearer token was not found in the response. But with the old script I don’t get any errors
Hello,
It is working perfectly fine on my side, see if where you saved the script, has permissions to create files as it creates the token momentarily. Also make sure you are using the right API version, according to your VBR version https://helpcenter.veeam.com/docs/backup/vbr_rest/changelog.html?ver=120
It was definitely a permission issue then. INow it is working. Just one repo giving error:
Error: failed to write data: 400 Bad Request: unable to parse ‘veeam_vbr_repositories,veeamVBR=XX.XX.XX.XX,veeamVBRRepoName=XXX-URL-NS001,veeamVBRRepotype=Smb,veeamVBRMSDescription=Urla\ Factory,veeamVBRRepopath=\XXX-URL-NS001\XXX-URL-NS001\,veeamVBRRepoPerVM=true veeamVBRRepoMaxtasks=4,veeamVBRRepoCapacity=18868328202240,
veeamVBRRepoFree=18842451024281,veeamVBRRepoUsed=0’: invalid tag format
And there is an error: date: invalid date ‘null’ when executing the script
I think that might be a running job
There is no running job but it doesn’t effect anything on dashboard.
Waht about this:
I can not see one of the repos of mine:
Error:
Error: failed to write data: 400 Bad Request: unable to parse ‘veeam_vbr_repositories,veeamVBR=XX.XX.XX.XX,veeamVBRRepoName=XXX-URL-NS001,veeamVBRRepotype=Smb,veeamVBRMSDescription=Urla\ Factory,veeamVBRRepopath=\XXX-URL-NS001\XXX-URL-NS001\,veeamVBRRepoPerVM=true veeamVBRRepoMaxtasks=4,veeamVBRRepoCapacity=18868328202240,
veeamVBRRepoFree=18842451024281,veeamVBRRepoUsed=0’: invalid tag format
Hello again,
I had hard time with the cron job and permissions. After working several hours to fix the permissions and cron jobs I gave up on that. After searching high and low for a solution I have decided to solve this with setting up your script as a service with a timer. Now everything is cool and steady except one of my repos doesn’t show up due to previously mentioned error:
Error: failed to write data: 400 Bad Request: unable to parse ‘veeam_vbr_repositories,veeamVBR=XX.XX.XX.XX,veeamVBRRepoName=XXX-URL-NS001,veeamVBRRepotype=Smb,veeamVBRMSDescription=Urla\ Factory,veeamVBRRepopath=\XXX-URL-NS001\XXX-URL-NS001\,veeamVBRRepoPerVM=true veeamVBRRepoMaxtasks=4,veeamVBRRepoCapacity=18868328202240,
veeamVBRRepoFree=18842451024281,veeamVBRRepoUsed=0’: invalid tag format
That is weird, as I have SMB as well on my environment and all works perfectly, are you removing some critical stuff from the name or path? Please send the entire output to [email protected] thank you!
Hello;
I have sent the full output to your email.
Hi,
I’ve uploaded the latest files, veeam have been update to 12.3, but sill have “Backup Repository – Usage Capacity” with “No data”, as well as “Backup Repositories” with the same Capacity, Used Space and Free Space”, although it’s not the case.
What can I do to solve this issue?
Regards,
Hello,
After updating grafana to 11.5, job historical data graph is changed to very thin lines, it was look like in the sceenshots before but it is now like this:
https://imgur.com/a/4lJdW4g
./veeam_backup_and_replication.sh: línea 45: curl: orden no encontrada
./veeam_backup_and_replication.sh: línea 47: response.json: No existe el archivo o el directorio
¿Alguien me ayuda?
Gracias
Hola, no tienes curl, apt get install curl, o yum install curl dependiendo si usas ubuntu o redhat, te hara falta jq tambien
Hi!
Has anyone tryed this dashboard/script solution with Veeam v13?
Hello,
Yes I tried it, I am even using the same veeamAPIVersion=”1.2-rev0″ that it comes with the default script, although there are two new API versions on top of that.
It works well 🙂 Let me know
Many thanks jorgeuk! Tryed now and it’s working fine!
Just a little “big” suggestion can you modify the script to skip these jobs? These jobs “screw” the timeline (my english is not good…but i think you understand what i mean…for example malware detection is a job of 24h hrs? dunno :P, config database resync is executed very often…)
“Configuration Database Resynchronize”
“Backup Configuration Job”
“Malware Detection”
“Security & Compliance Analyzer”
The idea is to have “only” backup and replica jobs seen in Grafana
If you need a betatester 🙂 I’m here
Many thanks
Michele
Hello mate,
I think the script doesn’t gathers “windows agent jobs” at all.. I have one critical “windows agent job” which details’ doesn’t show up on dashboard. Is it possible to fix this?
Thanks in advance.
Let me ask if it will work with appliance?If it does i will move to appliance mode.. because your dashboard is crucial part of my corporate dashboard😊
Hello, it works flawlessly yes. I have not updated it to the latest API version, but as Veeam always have retro-compatibility, it works without issues mate
I need to check if this is not in the API perhaps, which specific jobs Agent Policies or jobs?
Getting errors on 3 out of 4 of my repositories, another user mentioned similar issues earlier on in the thread but I didn’t see that it was addressed? I did try changing API to 1.3-rev1 and that just messed up getting data for jobs with ‘invalid field value’. VBR v13.0.1.1071
Error: failed to write data: 400 Bad Request: unable to parse ‘veeam_vbr_repositories,veeamVBR=IPRemoved,veeamVBRRepoName=HPE\ MSA\ 2060,veeamVBRRepotype=WinLocal,veeamVBRMSDescription=HPE\ MSA\ 2060,veeamVBRRepopath=D:\,veeamVBRRepoPerVM=true veeamVBRRepoMaxtasks=6,veeamVBRRepoCapacity=19999944710554,veeamVBRRepoFree=5508832428032,veeamVBRRepoUsed=15798392953242’: invalid tag format
Hello mate.
Do you have an alert rule for failed jobs? I tried but unfortunately couldn’t seem to succeed.
Thanks in advance
Is it normal that i don’t get “backup copy jobs” in the list? only backups!
Unfortunately yes, as Veeam does not publish the backup copies on the API as of yet.