
 Greetings friends, I have been talking about Open WebUI in previous articles, this is one of the best open-source software I have ever user used, so intuitive, works extremely well, and it comes with everything we need to run our private LLM models.
- Jetson: NVIDIA Jetson Orin Nano – How-to run DeepSeek-R1 on Ollama – Local and secure reasoning
- Jetson: NVIDIA Jetson Orin Nano – How-to install Ollama and Open WebUI
It also has super interesting feature where you can see the consumption, and stats per every single answer, giving the user full control, and of course allowing administrators of the infrastructure evaluate different models, performance, etc.
I found that there is a native pipeline for langfuse, in case you are using that already. But as we are using Grafana, InfluxDB, etc. I thought that it would be cool to take the stats as per usual into InfluxDB and do our magic.
Grafana Dashboard for Open WebUI
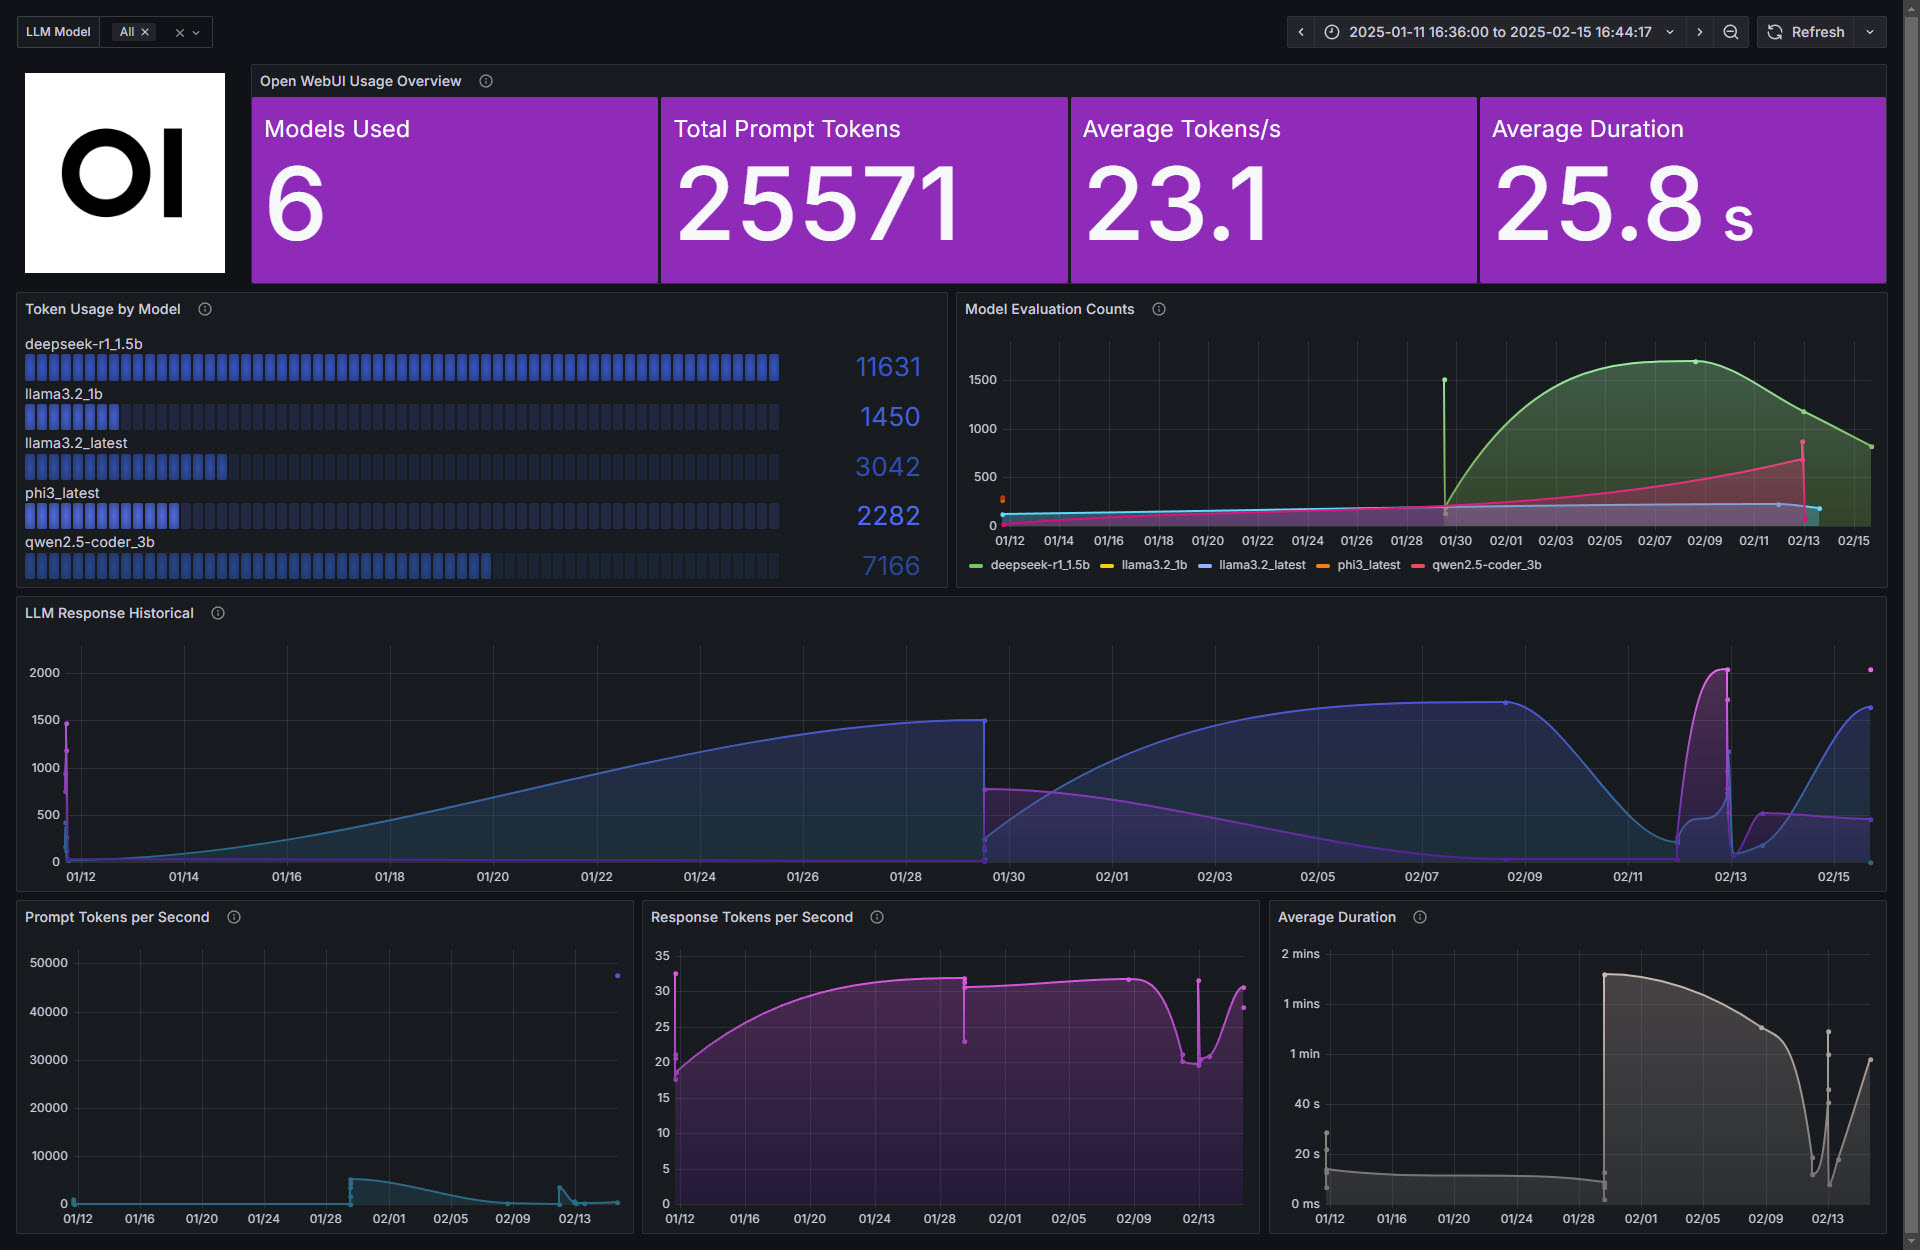
When you finish the entry you will have something similar to this. It might look a bit different depending of how many models you have, and frequency which you use Open WebUI, but should work out of the box:
 Dashboard – Summary
- Quick overview (Models used, Total prompt tokens, Average Token/s, Average duration)
- Total usage by model
- Model usage historical per model
- Total usage historical
- Prompt Tokens per second historical
- Response Tokens per second historical
- Average response duration historical
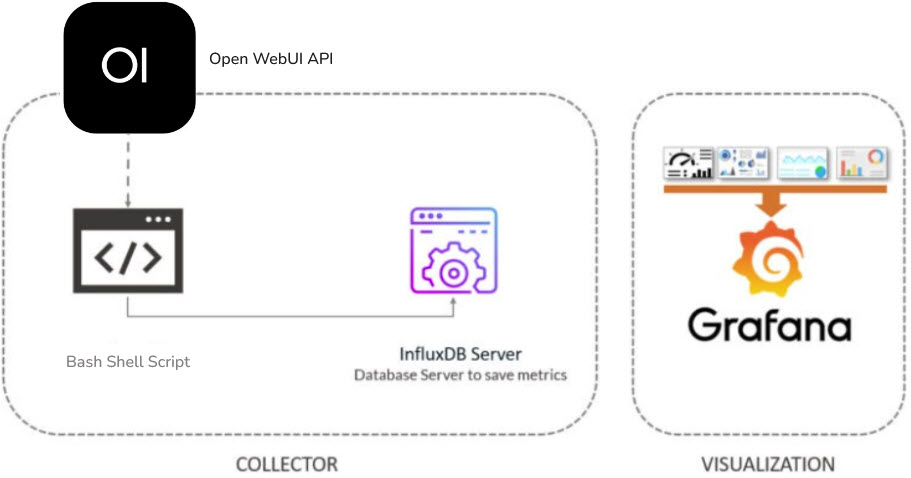
Topology with all logical components
This entry is very similar to the previous ones, we will use a custom bash shell script to collect the API information from our Open WebUI, from there we will send them to InfluxDB, and visualize them with Grafana . The design would be something similar to this:
How-to download and configure openwebui_grafana.sh script
I have created a custom bash shell script so you do not need to spend your time dealing with Open WebUI API, which is very comprehensive, but no swagger at the moment.
- https://raw.githubusercontent.com/jorgedlcruz/openwebui-grafana/refs/heads/main/openwebui_grafana.sh
You will need jq, so please go ahead and install it first (apt-get install jq, or yum install jq)
This shell script can be downloaded and run from the telegraf server, InfluxDB, or any other Linux. We will have to edit the configuration parameters:
# Open WebUI Configuration
webuiAPIBaseURL="http://YOUROPENWEBUIIPORFQDN:8080"
webuiEmail="YOURADMINUSER"
webuiPassword="YOURPASS"

# InfluxDB Configuration
veeamInfluxDBURL="http://YOURINFLUXSERVERIP" #Your InfluxDB Server, http://FQDN or https://FQDN if using SSL
veeamInfluxDBPort="8086" #Default Port
veeamInfluxDBBucket="veeam" # InfluxDB bucket name (not ID)
veeamInfluxDBToken="TOKEN" # InfluxDB access token with read/write privileges for the bucket
veeamInfluxDBOrg="ORG NAME" # InfluxDB organisation name (not ID)
Once the changes are done, make the script executable with chmod:
chmod +x openwebui_grafana.sh
Run it, if everything is good you should see something similar to this:
./openwebui_grafana.sh
Last execution timestamp: 0
Successfully authenticated.
Processing updated chat: 1da5e275-aba8-4c02-8e23-e48b95d9f9f7 (updated at 1739637673)
Processing message: 88d58b12-1aa5-4825-8df5-33704f29b9d5
Extracted Stats - Chat: 1da5e275-aba8-4c02-8e23-e48b95d9f9f7 | Message: 88d58b12-1aa5-4825-8df5-33704f29b9d5 | Model: unknown | responseTokens: 0 | promptTokens: 0 | duration: 0 ms | loadDuration: 0 ms | promptEvalCount: 0 | promptEvalDuration: 0 ms | evalCount: 0 | evalDuration: 0 ms | approximateTotalMS: 0 ms | messageTimestamp: 1739637595
Data sent to InfluxDB.
Processing message: ccd3f4bd-02ac-4de9-b4f7-334507e87b45
Extracted Stats - Chat: 1da5e275-aba8-4c02-8e23-e48b95d9f9f7 | Message: ccd3f4bd-02ac-4de9-b4f7-334507e87b45 | Model: deepseek-r1_1.5b | responseTokens: 30.57 | promptTokens: 407.84 | duration: 58350341149 ms | loadDuration: 3413770001 ms | promptEvalCount: 458 | promptEvalDuration: 1123000000 ms | evalCount: 1645 | evalDuration: 53810000000 ms | approximateTotalMS: 58000 ms | messageTimestamp: 1739637512
Data sent to InfluxDB.
Processing message: f072bdf2-961f-4113-8aa7-4773ebefface
Extracted Stats - Chat: 1da5e275-aba8-4c02-8e23-e48b95d9f9f7 | Message: f072bdf2-961f-4113-8aa7-4773ebefface | Model: unknown | responseTokens: 0 | promptTokens: 0 | duration: 0 ms | loadDuration: 0 ms | promptEvalCount: 0 | promptEvalDuration: 0 ms | evalCount: 0 | evalDuration: 0 ms | approximateTotalMS: 0 ms | messageTimestamp: 1739637512
Data sent to InfluxDB.
Processing message: f4c6d2cd-84dc-4512-8f65-57912225102b
Extracted Stats - Chat: 1da5e275-aba8-4c02-8e23-e48b95d9f9f7 | Message: f4c6d2cd-84dc-4512-8f65-57912225102b | Model: deepseek-r1_1.5b | responseTokens: 27.78 | promptTokens: 47627.91 | duration: 188466162 ms | loadDuration: 59497130 ms | promptEvalCount: 2048 | promptEvalDuration: 43000000 ms | evalCount: 1 | evalDuration: 36000000 ms | approximateTotalMS: 0 ms | messageTimestamp: 1739637595
Data sent to InfluxDB.
Updating timestamp.
If so, please now add this script to your crontab, like for example every 30 minutes:
*/30 * * * * /home/oper/openwebui_grafana.sh >> /var/log/openwebui_grafana.log 2>&1
A few notes about the script. I couldn’t find a better way, so every time you ask an additional question into a chat. Imagine you had a very old chat opened, then you come back 10 days after and ask an additional question, that whole chat and the messages will be parsed again. It doesn’t matter much because InfluxDB do not save duplicated entries with the same timestamps, so we should be fine and only see the additional message 🙂
Grafana Dashboards
I created a Dashboard from scratch by selecting the best requests to the database, finishing off colors, thinking about graphics, and how to display them, and everything is automated so that it fits our environment without any problem and without having to edit anything manually. The Dashboard can be found here, once imported, you can filter by model and time:
Import Grafana Dashboards easily
I have already a wonderful Dashboard, ready just for you with everything you need to monitor our environment in a very simple way. Select the name you want and enter the ID: 22867, which is the unique ID of the Dashboard, or the URL:
 With the menus above you can display and adjust the Dashboard to your different choices:
I hope you like it, and I would like to leave you the complete series here, so you can start playing with the plugins that I have been telling you about all these years:
- Looking for the Perfect Dashboard: InfluxDB, Telegraf, and Grafana – Part I (Installing InfluxDB, Telegraf, and Grafana on Ubuntu 20.04 LTS)
- En busca del Dashboard perfecto: InfluxDB, Telegraf y Grafana – Parte II (Instalar agente Telegraf en Nodos remotos Linux)
- En busca del Dashboard perfecto: InfluxDB, Telegraf y Grafana – Parte III Integración con PRTG
- En busca del Dashboard perfecto: InfluxDB, Telegraf y Grafana – Parte IV (Instalar agente Telegraf en Nodos remotos Windows)
- En busca del Dashboard perfecto: InfluxDB, Telegraf y Grafana – Parte V (Activar inputs específicos, Red, MySQL/MariaDB, Nginx)
- En busca del Dashboard perfecto: InfluxDB, Telegraf y Grafana – Parte VI (Monitorizando Veeam)
- En busca del Dashboard perfecto: InfluxDB, Telegraf y Grafana – Parte VII (Monitorizar vSphere)
- En busca del Dashboard perfecto: InfluxDB, Telegraf y Grafana – Parte VIII (Monitorizando Veeam con Enterprise Manager)
- En busca del Dashboard perfecto: InfluxDB, Telegraf y Grafana – Parte IX (Monitorizando Zimbra Collaboration)
- En busca del Dashboard perfecto: InfluxDB, Telegraf y Grafana – Parte X (Grafana Plugins)
- En busca del Dashboard perfecto: InfluxDB, Telegraf y Grafana – Parte XI – (Monitorizando URL e IPS con Telegraf y Ping)
- Looking for the Perfect Dashboard: InfluxDB, Telegraf, and Grafana – Part XII (Native Telegraf Plugin for vSphere)
- Looking for the Perfect Dashboard: InfluxDB, Telegraf, and Grafana – Part XIII (Veeam Backup for Microsoft Office 365 v4)
- Looking for the Perfect Dashboard: InfluxDB, Telegraf, and Grafana – Part XIV – Veeam Availability Console
- Looking for the Perfect Dashboard: InfluxDB, Telegraf, and Grafana – Part XV (IPMI Monitoring of our ESXi Hosts)
- Looking for Perfect Dashboard: InfluxDB, Telegraf, and Grafana – Part XVI (Performance and Advanced Security of Veeam Backup for Microsoft Office 365)
- Looking for the Perfect Dashboard: InfluxDB, Telegraf, and Grafana – Part XVII (Showing Dashboards on Two Monitors Using Raspberry Pi 4)
- En busca del Dashboard perfecto: InfluxDB, Telegraf y Grafana – Parte XVIII – Monitorizar temperatura y estado de Raspberry Pi 4
- Looking for the Perfect Dashboard: InfluxDB, Telegraf, and Grafana – Part XIX (Monitoring Veeam with Enterprise Manager) Shell Script
- Looking for the Perfect Dashboard: InfluxDB, Telegraf, and Grafana – Part XXIV (Monitoring Veeam Backup for Microsoft Azure)
- Looking for the Perfect Dashboard: InfluxDB, Telegraf, and Grafana – Part XXV (Monitoring Power Consumption)
- Looking for the Perfect Dashboard: InfluxDB, Telegraf, and Grafana – Part XXVI (Monitoring Veeam Backup for Nutanix)
- Looking for the Perfect Dashboard: InfluxDB, Telegraf, and Grafana – Part XXVII (Monitoring ReFS and XFS (block-cloning and reflink)
- Looking for the Perfect Dashboard: InfluxDB, Telegraf, and Grafana – Part XXVIII (Monitoring HPE StoreOnce)
- Looking for the Perfect Dashboard: InfluxDB, Telegraf, and Grafana – Part XXIX (Monitoring Pi-hole)
- Looking for the Perfect Dashboard: InfluxDB, Telegraf, and Grafana – Part XXIX (Monitoring Veeam Backup for AWS)
- Looking for the Perfect Dashboard: InfluxDB, Telegraf, and Grafana – Part XXXI (Monitoring Unifi Protect)
- Looking for the Perfect Dashboard: InfluxDB, Telegraf, and Grafana – Part XXXII (Monitoring Veeam ONE – experimental)
- Looking for the Perfect Dashboard: InfluxDB, Telegraf, and Grafana – Part XXXIII (Monitoring NetApp ONTAP)
- Looking for the Perfect Dashboard: InfluxDB, Telegraf, and Grafana – Part XXXIV (Monitoring Runecast)
- Looking for the Perfect Dashboard: InfluxDB, Telegraf, and Grafana – Part XXXV (GPU Monitoring)
- Looking for the Perfect Dashboard: InfluxDB, Telegraf, and Grafana – Part XXXVI (Monitoring Goldshell Miners – JSONv2)
- Looking for the Perfect Dashboard: InfluxDB, Telegraf, and Grafana – Part XXXVII (Monitoring Veeam Backup for Google Cloud Platform)
- En Busca del Dashboard perfecto: InfluxDB, Telegraf y Grafana – Parte XXXVIII (Monitorizando Temperatura y Humedad con Xiaomi Mijia)
- Looking for the Perfect Dashboard: InfluxDB, Telegraf, and Grafana – Part XL (Veeam Backup for Microsoft 365 – Restore Audit)
- Looking for the Perfect Dashboard: InfluxDB, Telegraf, and Grafana – Part XLI (Veeam Backup for Salesforce)
- Looking for the Perfect Dashboard: InfluxDB, Telegraf, and Grafana – Part XLII (Veeam ONE v12 Audit Events)
- Looking for the Perfect Dashboard: InfluxDB, Telegraf, and Grafana – Part XLIII (Monitoring QNAP using SNMP v3)
- Looking for the Perfect Dashboard: InfluxDB, Telegraf, and Grafana – Part XLIV (Monitoring Veeam Backup & Replication API)
- Looking for the Perfect Dashboard: InfluxDB, Telegraf, and Grafana – Part XLV (Monitoring Synology using SNMP v3)
- Looking for the Perfect Dashboard: InfluxDB, Telegraf, and Grafana – Part XLVI (Monitoring NVIDIA Jetson Nano)
- Looking for the Perfect Dashboard: InfluxDB, Telegraf, and Grafana – Part XLVII (Monitoring Open WebUI)
- Looking for the Perfect Dashboard: InfluxDB, Telegraf, and Grafana – Part XLVIII (Monitoring Veeam Data Platform Advanced)
- Looking for the Perfect Dashboard: InfluxDB, Telegraf, and Grafana – Part XLIX (Monitoring Unofficial Veeam ONE Node Exporter)
I have tried to use your Grafana dashboard – and it is failling. it is trying to use a “bucket” called “telegraf”. I do not know where this “bucket” telegraf is coming grom?
Hello,
I have fixed it to use the default bucket you have on your Grafana configuration when added InfluxDB, give a try to the new version:
https://grafana.com/grafana/dashboards/22867-grafana-dashboard-for-open-webui/
Thank you!
Hi
Many thanks for your help and support. The new version fixed the problem, and now I can see performance data from my WebUI,
I get the following error when I import the dashboard into Grafana : “invalid: error @1:14-1:15: undefined identifier v”
I am using “rev1” of the dashboard and I replaced telegraf with the name of the bucket (openwebui) I created in InfluxDB.
Thanks
I am running Telegraf, InfluxDB, and Grafana in Docker and executing the script natively in Ubuntu 24.04.2.
after openwebui update i recieve this error:
./openwebui_grafana.sh
Last execution timestamp: 1743823963
Successfully authenticated.
jq: parse error: Invalid numeric literal at line 1, column 8
No new or updated chats found.
Updating timestamp.
any suggestions
That is odd, it is working nicely without docker, did you manage to make it work?
I deployed Open WebUI for my company teammates, so it is multi-user environment, even I use the initial user (admin role) to run the script, it seems unable to get statistics for other users, is it possible to get statistics for all users?
Hello Fai,
I need to check, I though the API showed all the conversations no matter the user, give me some time please.
Could i able to view cost?
There is no cost on local models, nor on the Open WebUI JSON
Unfortunately, it was not possible to launch, research has shown problems with api requests in this version.
Could you please update the script to the current version and describe the instructions in more detail, because I really like your dashboard, the lgtm stack also does not provide information, I am completely lost. It will be great if you find the time and adapt it to the latest version. Thank you for your contribution!
I just wanted to say thank you for creating this, this is great. There are so many variables for folks who are also installing this but a little bit of research and it is working great. For others out there, my configuration may be unique though as I am not using docker at all.
One suggestion for others is to mix in the current InfluxDB2 directions on their site with the directions for installing this. Its impossible for you to take into account everyone’s setup but I found that helpful.
Also, I found opening up the AI sidebar in firefox and using whichever model or system you prefer extremely helpful. Then clipping screenshots and pasting in the chat also helped.
You can also run OpenWebUI in the sidebar, which is one of the features I really like but just found out about. However, you are tied to the last training cutoff for your model.
My setup is spread across two Ubuntu 24 PC’s:
1. Main AI Server – Ollama, Openwebui (uv venv), Cuda 13 with a 3090, 5070 ti and then another 5070 ti via m.2 to Occulink. Everything is over 10Gbps internally and outside of having the full RAG pipeline enabled, it runs quick.
2. Backend Server – Ollama (for embedding, re-ranking, and Docling), Docling for OCR in the OpenWebUI RAG setup, postgresql (pgvector), Grafana, InfluxDB, Loki, etc. Then Cuda 13 again with a 5080 (for ComfyUI) and a 5060 ti for Docling, embedding, etc. This server also holds Caddy for TLS Internal certs for everything from Openwebui to Grafana.
We work with what we can afford and obtain, so if you think its frankensteined, you would be right but it works.
I am on 0.6.34 of OpenWebUI and InfluxDB2, latest version of Grafana. I made a couple changes to the script for my specific setup and also the dashboards and datasource names because of how I had Influx setup. But it works great. If find anything related to the others comments above, I will see if they had similar issues I had to work through.
From one Director of Product Management (former) to another, I truly appreciate you putting the work in like this on these opensource projects.