 Greetings friends, this post is special, as it is the updated article as of today with the necessary steps on how to install InfluxDB, Telegraf, and Grafana, on Ubuntu 20.04LTS, which we can find for x86 or ARM.
You already know that with these steps, you can then jump to any of the other entries in the series, to monitor your VMware, Veeam, Nutanix AHV, HPE StoreOnce, your blogs from wordpress, whatever you really want.
Logical scheme of the Infrastructure
I leave you with a graphic I created for us to understand the three components we are going to install and configure in this Lab:
- Telegraf: It is responsible for collecting all the data that we pass through the configuration file, Telegraf collects the result of the outputs that we have configured, such as CPU/RAM/LOAD or services like Nginx, MariaDB, etc.
- InfluxDB: It is where Telegraf sends all this information, InfluxDB is specially designed to efficiently store a significant amount of information, you can also define retention periods of information in case we have a performance problem
- Grafana: It is the Dashboard that is responsible for displaying all the information that InfluxDB has stored in the Databases
 Both Grafana and InfluxDB are prepared to ingest information from different origins, which makes us able to add other components if we would like to, such as Prometheus, Chronograf, etc.
Installation and configuration of InfluxDB
I am using already InfluxDB v2.0, as of v1.8 it is already EOL.
I personally always like to use repositories, as upgrades are easier, so let’s add the InfluxData repository to our system:
# influxdata-archive_compat.key GPG fingerprint:
#     9D53 9D90 D332 8DC7 D6C8 D3B9 D8FF 8E1F 7DF8 B07E
wget -q https://repos.influxdata.com/influxdata-archive_compat.key
echo '393e8779c89ac8d958f81f942f9ad7fb82a25e133faddaf92e15b16e6ac9ce4c influxdata-archive_compat.key' | sha256sum -c && cat influxdata-archive_compat.key | gpg --dearmor | sudo tee /etc/apt/trusted.gpg.d/influxdata-archive_compat.gpg > /dev/null
echo 'deb [signed-by=/etc/apt/trusted.gpg.d/influxdata-archive_compat.gpg] https://repos.influxdata.com/debian stable main' | sudo tee /etc/apt/sources.list.d/influxdata.list
With these simple steps, let’s now update our package and install InfluxDB:
sudo apt-get update
sudo apt-get install influxdb2
sudo service influxdb start
Let’s check that everything is working properly with the following command:
sudo systemctl status influxdb
The result has to look something like this:
â— influxdb.service - InfluxDB is an open-source, distributed, time series database
Loaded: loaded (/lib/systemd/system/influxdb.service; enabled; vendor preset: enabled)
Active: active (running) since Wed 2022-02-16 12:20:01 UTC; 5s ago
Docs: https://docs.influxdata.com/influxdb/
Process: 2667 ExecStart=/usr/lib/influxdb/scripts/influxd-systemd-start.sh (code=exite>
Main PID: 2669 (influxd)
Tasks: 8 (limit: 4575)
Memory: 41.8M
CGroup: /system.slice/influxdb.service
└─2669 /usr/bin/influxd
If all is working nice, let’s enable the service so auto-starts at the boot time:
systemctl enable influxdb
Setup InfluxDB 2
Once installed, we have two ways of configuring InfluxDB 2, we can do it either web console or via CLI, let’s take a look at both.
Setting up InfluxDB 2 using the Web Console
To me, the easiest way. You do not need to install Chronograf anymore as it is part of InfluxDB v2. Just navigate to the http://IP:8086, you will see something like this:

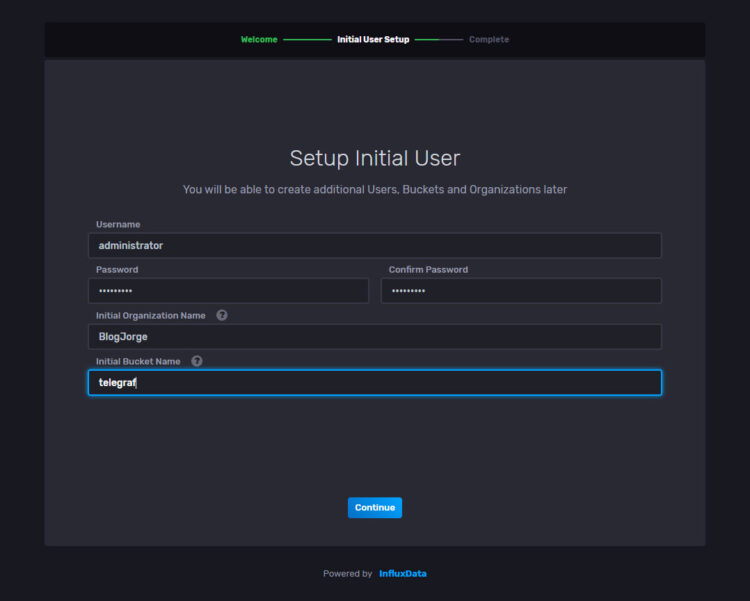
The wizard could not be simpler, just introduce a user, password, organization, and bucket name. You can of course create more users and buckets later:
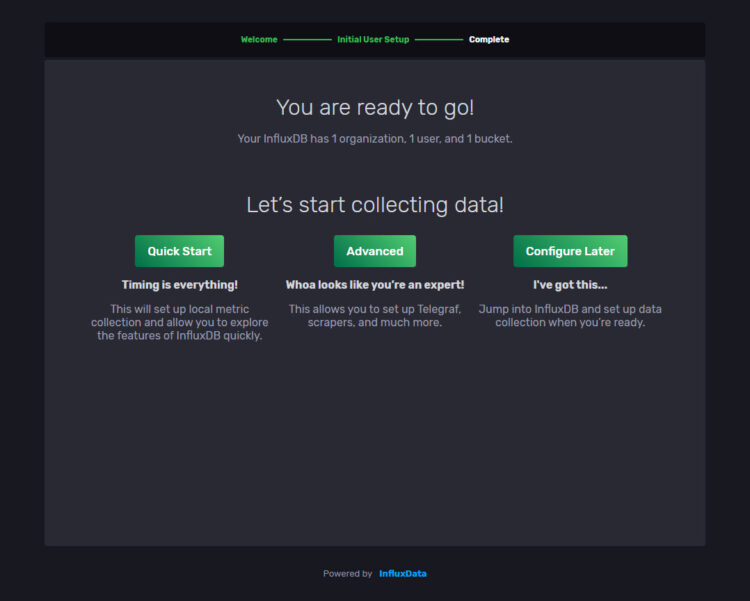
Annnnddd, we are ready to start ingesting data. You can always take a look at the Quick Start if you are new:
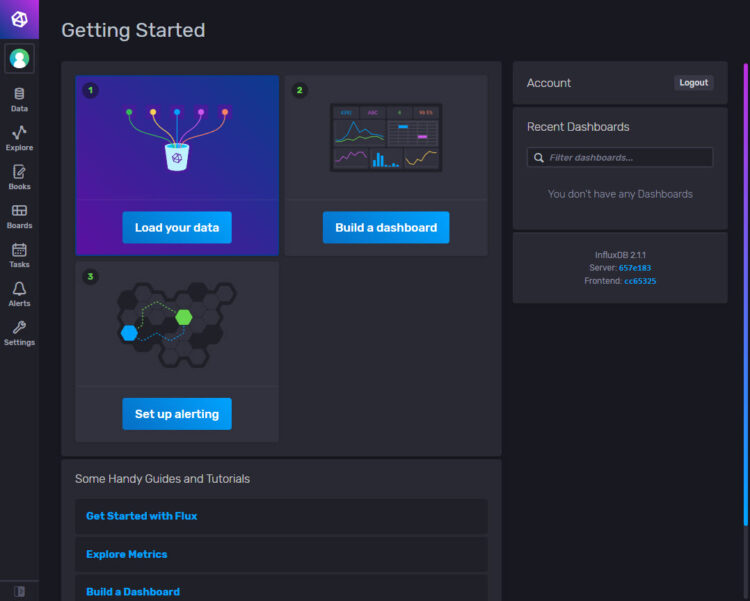
The interface is pretty attractive in my opinion, not many options, but the required ones to start monitoring like a pro:
Let’s jump to the Telegraf part, you do not need to follow the CLI instructions.
Setting up InfluxDB 2 using the CLI
From the CLI, we can run the next command, which will ask us about credentials, etc:
influx setup
> Welcome to InfluxDB 2.0!
? Please type your primary username administrator
? Please type your password *********
? Please type your password again *********
? Please type your primary organization name BlogJorge
? Please type your primary bucket name telegraf
? Please type your retention period in hours, or 0 for infinite 0
? Setup with these parameters?
Username: administrator
Organization: BlogJorge
Bucket: telegraf
Retention Period: infinite
Yes
User Organization Bucket
administrator BlogJorge telegraf
Now, we will need to retrieve the Token, we can quickly do it using the next command:
influx auth list
ID Description Token User Name User ID Permissions
06be12373d8c3000 administrator's Token 0Xblablablabla
Installation and configuration of Telegraf
Let’s go with the next component, Telegraf, telegraf is an agent that can be installed wherever we want to collect data, in this case, I install it on the same server, and from this agent, I collect information from different sources, in some cases, as it is, for example, Windows, we will have to install telegraf for windows to send the metrics of the systems to InfluxDB. Here we go.
Luckily we don’t have to do anything else at the package level, as we have already added the Influxdata packages to our repository list. So a simple:
sudo apt-get install telegraf
sudo service telegraf start
Let’s check that everything is working properly with the following command:
sudo systemctl status telegraf
◠telegraf.service - The plugin-driven server agent for reporting metrics into InfluxDB Loaded: loaded (/lib/systemd/system/telegraf.service; enabled; vendor preset: enabled) Active: active (running) since Wed 2022-02-16 12:25:32 UTC; 1min 54s ago Docs: https://github.com/influxdata/telegraf Main PID: 3118 (telegraf) Tasks: 8 (limit: 4575) Memory: 32.8M CGroup: /system.slice/telegraf.service └─3118 /usr/bin/telegraf -config /etc/telegraf/telegraf.conf -config-director>
The telegraf service takes all the configurations from the file located in /etc/telegraf/telegraf.conf and in it we will find the following:
- Input Plugins collects system metrics or services
- Processor Plugins transform, process, decorate and filter metrics
- Aggregator Plugins create sets of metrics, e.g. allows averaging, minimum, maximum, etc.
- Output Plugins writes the metrics to different destinations, in my case to InfluxDB.
I recommend you not to modify the telegraf.conf for anything really, and even make copy:
cp /etc/telegraf/telegraf.conf{,.old}
Everything you want to modify or add, better save it in /etc/telegraf/telegraf.d/tuconfiguration.conf.
For example, I recommend you to edit the /etc/telegraf/telegraf.conf and comment the outputs.influxdb line that comes by default enabled:
###############################################################################
#                            OUTPUT PLUGINS                                   #
###############################################################################


# Configuration for sending metrics to InfluxDB
#[[outputs.influxdb]]
  ## The full HTTP or UDP URL for your InfluxDB instance.
  ##
  ## Multiple URLs can be specified for a single cluster, only ONE of the
  ## urls will be written to each interval.
  # urls = ["unix:///var/run/influxdb.sock"]
  # urls = ["udp://127.0.0.1:8089"]
  #  urls = ["http://127.0.0.1:8086"]
You could create a new file /etc/telegraf/telegraf.d/influx.conf and add the next content, or append this config inside the outputs plugin on telegraf.conf
[outputs.influxdb_v2]
   urls = ["http://YOURINFLUXDBSERVER:8086"]
   ## Token for authentication.
   token = "dABLABLABLAYOURTOKEN=="
   ## Organization is the name of the organization you wish to write to; must exist.
   organization = "BlogJorge"
   ## Destination bucket to write into.
   bucket = "telegraf"
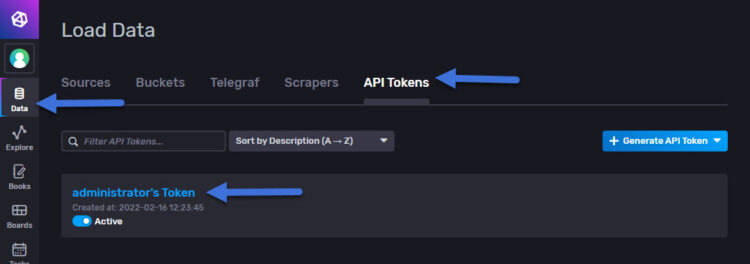
You can obtain the Token from the InfluxDB GUI:
Once we have everything, we restart the telegraf service:
systemctl restart telegraf
For example, I have added the ping plugin configuration in /etc/telegraf/telegraf.d/ping.conf and I can test that everything is OK as follows:
telegraf --config /etc/telegraf/telegraf/telegraf.d/ping.conf --test
2020-11-21T13:13:20Z I! Starting Telegraf 1.16.2
> ping,host=tig-monitor,url=www.jorgedelacruz.es average_response_ms=14.928,maximum_response_ms=18.153,minimum_response_ms=11.477,packets_received=4i,packets_transmitted=4i,percent_packet_loss=0,result_code=0i,standard_deviation_ms=2.364,ttl=58i 1605964404000000000
> ping,host=tig-monitor,url=www.jorgedelacruz.uk average_response_ms=28.202,maximum_response_ms=32.185,minimum_response_ms=24.641,packets_received=4i,packets_transmitted=4i,percent_packet_loss=0,result_code=0i,standard_deviation_ms=2.952,ttl=54i 1605964404000000000
> ping,host=tig-monitor,url=ad-01.jorgedelacruz.es average_response_ms=0.212,maximum_response_ms=0.28,minimum_response_ms=0.117,packets_received=4i,packets_transmitted=4i,percent_packet_loss=0,result_code=0i,standard_deviation_ms=0.066,ttl=128i 1605964404000000000
> ping,host=tig-monitor,url=esxi-zlon-001.jorgedelacruz.es average_response_ms=0.225,maximum_response_ms=0.272,minimum_response_ms=0.206,packets_received=4i,packets_transmitted=4i,percent_packet_loss=0,result_code=0i,standard_deviation_ms=0.027,ttl=64i 1605964404000000000
> ping,host=tig-monitor,url=esxi-zlon-002.jorgedelacruz.es average_response_ms=0.255,maximum_response_ms=0.364,minimum_response_ms=0.203,packets_received=4i,packets_transmitted=4i,percent_packet_loss=0,result_code=0i,standard_deviation_ms=0.064,ttl=64i 1605964404000000000
> ping,host=tig-monitor,url=vcsa.jorgedelacruz.es average_response_ms=0.206,maximum_response_ms=0.245,minimum_response_ms=0.172,packets_received=4i,packets_transmitted=4i,percent_packet_loss=0,result_code=0i,standard_deviation_ms=0.029,ttl=64i 1605964404000000000
> ping,host=tig-monitor,url=192.168.1.1 average_response_ms=0.366,maximum_response_ms=0.436,minimum_response_ms=0.25,packets_received=4i,packets_transmitted=4i,percent_packet_loss=0,result_code=0i,standard_deviation_ms=0.069,ttl=64i 1605964404000000000
> ping,host=tig-monitor,url=esxi-zlon-000.jorgedelacruz.es packets_received=0i,packets_transmitted=3i,percent_packet_loss=100,result_code=1i 1605964404000000000
^C> ping,host=tig-monitor,url=192.168.0.1 packets_received=0i,packets_transmitted=4i,percent_packet_loss=100,result_code=1i 1605964404000000000
We have everything, remember to add your VMware, Veeam, Nutanix AHV, HPE StoreOnce, your wordpress blogs, whatever you really want.
Grafana installation and configuration
Let’s go with the last step, how to install and configure Grafana, very simple steps but you have to do it step by step. Let’s start.
I think we will already have these two dependencies, but in any case, we launch the following command:
sudo apt-get install -y apt-transport-https
sudo apt-get install -y software-properties-common wget
Let’s now get the Grafana packages safely, for this we add the Grafana GPG key to our system, with the following command:
sudo wget -q -O /usr/share/keyrings/grafana.key https://apt.grafana.com/gpg.key
Now that we have everything ready, we will add the Grafana repositories to our system, as simple as launching the following command:
echo "deb [signed-by=/usr/share/keyrings/grafana.key] https://apt.grafana.com stable main" | sudo tee -a /etc/apt/sources.list.d/grafana.list
We finally install Grafana with the following, simple command:
sudo apt-get update && sudo apt-get install grafana
Let’s enable the service and check that it is up:
sudo systemctl start grafana-server
sudo systemctl status grafana-server
All good in my environment:
â- grafana-server.service - Grafana instance
     Loaded: loaded (/lib/systemd/system/grafana-server.service; disabled; vendor preset: enabled)
     Active: active (running) since Sat 2020-11-14 13:50:34 UTC; 6 days ago
       Docs: http://docs.grafana.org
   Main PID: 2022 (grafana-server)
      Tasks: 13 (limit: 14274)
     Memory: 111.1M
     CGroup: /system.slice/grafana-server.service
             â""â"€2022 /usr/sbin/grafana-server --config=/etc/grafana/grafana.ini --pidfile=/var/run/grafana/grafana-server.pid --packaging=deb cfg:default.paths.logs=/var>

Nov 20 22:01:37 tig-monitor grafana-server[2022]: t=2020-11-20T22:01:37+0000 lvl=info msg="Request Completed" logger=context userId=0 orgId=0 uname= method=GET path=/d//>
Nov 20 22:01:37 tig-monitor grafana-server[2022]: t=2020-11-20T22:01:37+0000 lvl=info msg="Request Completed" logger=context userId=0 orgId=0 uname= method=GET path=/ap>
Nov 20 22:01:37 tig-monitor grafana-server[2022]: t=2020-11-20T22:01:37+0000 lvl=info msg="Request Completed" logger=context userId=0 orgId=0 uname= method=GET path=/d/>
Nov 20 22:01:37 tig-monitor grafana-server[2022]: t=2020-11-20T22:01:37+0000 lvl=info msg="Request Completed" logger=context userId=0 orgId=0 uname= method=GET path=/ap>
Nov 20 22:01:37 tig-monitor grafana-server[2022]: t=2020-11-20T22:01:37+0000 lvl=info msg="Request Completed" logger=context userId=0 orgId=0 uname= method=GET path=/ap>
Nov 20 22:01:37 tig-monitor grafana-server[2022]: t=2020-11-20T22:01:37+0000 lvl=info msg="Request Completed" logger=context userId=0 orgId=0 uname= method=GET path=/ap>
Nov 20 22:01:37 tig-monitor grafana-server[2022]: t=2020-11-20T22:01:37+0000 lvl=info msg="Request Completed" logger=context userId=0 orgId=0 uname= method=GET path=/ap>
Nov 20 22:01:37 tig-monitor grafana-server[2022]: t=2020-11-20T22:01:37+0000 lvl=info msg="Request Completed" logger=context userId=0 orgId=0 uname= method=GET path=/ap>
Nov 21 09:03:32 tig-monitor grafana-server[2022]: t=2020-11-21T09:03:32+0000 lvl=info msg="Successful Login" logger=http.server User=admin@localhost
Nov 21 09:03:47 tig-monitor grafana-server[2022]: t=2020-11-21T09:03:47+0000 lvl=info msg="Successful Login" logger=http.server User=admin@localhost
Now we can go to our browser and open http://GRAFANAIP:3000 and we will see the login screen, with default user admin and password admin, once we log in we will see this: I think as a precaution we can disable automatic user registration, we will edit the file /etc/grafana/grafana.ini and make sure these lines are like this:
### Content of grafana configuration file.

[users]
# disable user signup / registration
allow_sign_up = false

# Allow non admin users to create organizations
allow_org_create = false

# Set to true to automatically assign new users to the default organization (id 1)
auto_assign_org = true
Change the allow_sign_up setting to false, and restart your Grafana server.

;allow_sign_up = false
Simple, we will do a restart of Grafana:
sudo systemctl restart grafana-server
Adding InfluxDB Data Source
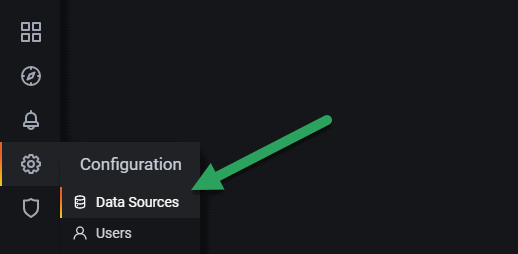
You remember the diagram above, right? It’s time to add our InfluxDB database, with all our cool metrics, and be able to display it in Grafana, for this we go to the Settings – Data Sources.
We will have to check all the options we see in the illustration:
- Name: The name you want
- Check the default check
- The Type is important that is Flux (the new query language for InfluxDB v2)
- In URL we can use localhost:8086, or the IP or hostname of the server
- In the Organization, we will need to put the same we introduced at the time of creation
- Then we will need to introduce the Token
- And finally the bucket
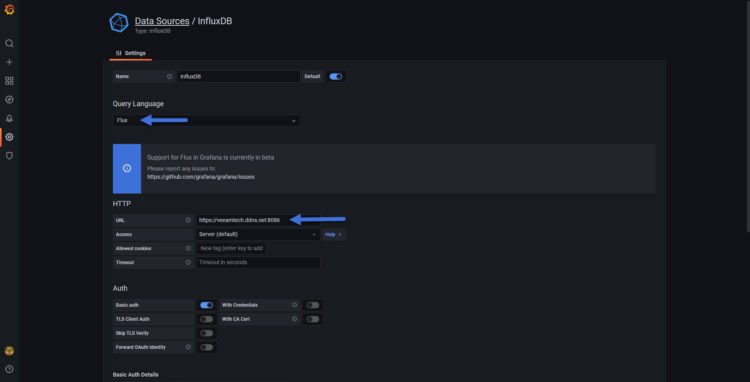
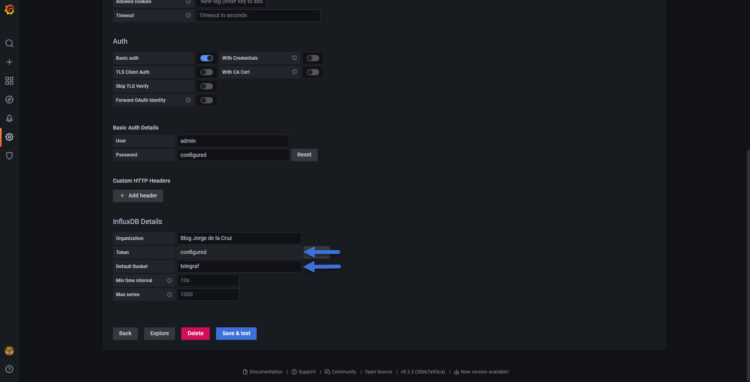
When we do Save & Test, if everything is ok, we will see a green bar saying that it works, if not, write me an email or a comment and we will see what happens:  The easiest thing to do now is to go to Grafana Explorer and see if we have data, in my case I have selected the CPU metric per ESXi, from telegraf’s own server, which I know is sending data, you should see something like this:

That’s all folks! Good job, long, precise and concise, I hope you have everything working well.
I hope you like it, and I would like to leave you the complete series here, so you can start playing with the plugins that I have been telling you about all these years:
- Looking for the Perfect Dashboard: InfluxDB, Telegraf, and Grafana – Part I (Installing InfluxDB, Telegraf, and Grafana on Ubuntu 20.04 LTS)
- En busca del Dashboard perfecto: InfluxDB, Telegraf y Grafana – Parte II (Instalar agente Telegraf en Nodos remotos Linux)
- En busca del Dashboard perfecto: InfluxDB, Telegraf y Grafana – Parte III Integración con PRTG
- En busca del Dashboard perfecto: InfluxDB, Telegraf y Grafana – Parte IV (Instalar agente Telegraf en Nodos remotos Windows)
- En busca del Dashboard perfecto: InfluxDB, Telegraf y Grafana – Parte V (Activar inputs específicos, Red, MySQL/MariaDB, Nginx)
- En busca del Dashboard perfecto: InfluxDB, Telegraf y Grafana – Parte VI (Monitorizando Veeam)
- En busca del Dashboard perfecto: InfluxDB, Telegraf y Grafana – Parte VII (Monitorizar vSphere)
- En busca del Dashboard perfecto: InfluxDB, Telegraf y Grafana – Parte VIII (Monitorizando Veeam con Enterprise Manager)
- En busca del Dashboard perfecto: InfluxDB, Telegraf y Grafana – Parte IX (Monitorizando Zimbra Collaboration)
- En busca del Dashboard perfecto: InfluxDB, Telegraf y Grafana – Parte X (Grafana Plugins)
- En busca del Dashboard perfecto: InfluxDB, Telegraf y Grafana – Parte XI – (Monitorizando URL e IPS con Telegraf y Ping)
- Looking for the Perfect Dashboard: InfluxDB, Telegraf, and Grafana – Part XII (Native Telegraf Plugin for vSphere)
- Looking for the Perfect Dashboard: InfluxDB, Telegraf, and Grafana – Part XIII (Veeam Backup for Microsoft Office 365 v4)
- Looking for the Perfect Dashboard: InfluxDB, Telegraf, and Grafana – Part XIV – Veeam Availability Console
- Looking for the Perfect Dashboard: InfluxDB, Telegraf, and Grafana – Part XV (IPMI Monitoring of our ESXi Hosts)
- Looking for Perfect Dashboard: InfluxDB, Telegraf, and Grafana – Part XVI (Performance and Advanced Security of Veeam Backup for Microsoft Office 365)
- Looking for the Perfect Dashboard: InfluxDB, Telegraf, and Grafana – Part XVII (Showing Dashboards on Two Monitors Using Raspberry Pi 4)
- En busca del Dashboard perfecto: InfluxDB, Telegraf y Grafana – Parte XVIII – Monitorizar temperatura y estado de Raspberry Pi 4
- Looking for the Perfect Dashboard: InfluxDB, Telegraf, and Grafana – Part XIX (Monitoring Veeam with Enterprise Manager) Shell Script
- Looking for the Perfect Dashboard: InfluxDB, Telegraf, and Grafana – Part XXIV (Monitoring Veeam Backup for Microsoft Azure)
- Looking for the Perfect Dashboard: InfluxDB, Telegraf, and Grafana – Part XXV (Monitoring Power Consumption)
- Looking for the Perfect Dashboard: InfluxDB, Telegraf, and Grafana – Part XXVI (Monitoring Veeam Backup for Nutanix)
- Looking for the Perfect Dashboard: InfluxDB, Telegraf, and Grafana – Part XXVII (Monitoring ReFS and XFS (block-cloning and reflink)
- Looking for the Perfect Dashboard: InfluxDB, Telegraf, and Grafana – Part XXVIII (Monitoring HPE StoreOnce)
- Looking for the Perfect Dashboard: InfluxDB, Telegraf, and Grafana – Part XXIX (Monitoring Pi-hole)
- Looking for the Perfect Dashboard: InfluxDB, Telegraf, and Grafana – Part XXIX (Monitoring Veeam Backup for AWS)
- Looking for the Perfect Dashboard: InfluxDB, Telegraf, and Grafana – Part XXXI (Monitoring Unifi Protect)
- Looking for the Perfect Dashboard: InfluxDB, Telegraf, and Grafana – Part XXXII (Monitoring Veeam ONE – experimental)
- Looking for the Perfect Dashboard: InfluxDB, Telegraf, and Grafana – Part XXXIII (Monitoring NetApp ONTAP)
- Looking for the Perfect Dashboard: InfluxDB, Telegraf, and Grafana – Part XXXIV (Monitoring Runecast)
- Looking for the Perfect Dashboard: InfluxDB, Telegraf, and Grafana – Part XXXV (GPU Monitoring)
- Looking for the Perfect Dashboard: InfluxDB, Telegraf, and Grafana – Part XXXVI (Monitoring Goldshell Miners – JSONv2)
- Looking for the Perfect Dashboard: InfluxDB, Telegraf, and Grafana – Part XXXVII (Monitoring Veeam Backup for Google Cloud Platform)
- En Busca del Dashboard perfecto: InfluxDB, Telegraf y Grafana – Parte XXXVIII (Monitorizando Temperatura y Humedad con Xiaomi Mijia)
- Looking for the Perfect Dashboard: InfluxDB, Telegraf, and Grafana – Part XL (Veeam Backup for Microsoft 365 – Restore Audit)
- Looking for the Perfect Dashboard: InfluxDB, Telegraf, and Grafana – Part XLI (Veeam Backup for Salesforce)
- Looking for the Perfect Dashboard: InfluxDB, Telegraf, and Grafana – Part XLII (Veeam ONE v12 Audit Events)
- Looking for the Perfect Dashboard: InfluxDB, Telegraf, and Grafana – Part XLIII (Monitoring QNAP using SNMP v3)
- Looking for the Perfect Dashboard: InfluxDB, Telegraf, and Grafana – Part XLIV (Monitoring Veeam Backup & Replication API)
- Looking for the Perfect Dashboard: InfluxDB, Telegraf, and Grafana – Part XLV (Monitoring Synology using SNMP v3)
- Looking for the Perfect Dashboard: InfluxDB, Telegraf, and Grafana – Part XLVI (Monitoring NVIDIA Jetson Nano)
- Looking for the Perfect Dashboard: InfluxDB, Telegraf, and Grafana – Part XLVII (Monitoring Open WebUI)
- Looking for the Perfect Dashboard: InfluxDB, Telegraf, and Grafana – Part XLVIII (Monitoring Veeam Data Platform Advanced)
- Looking for the Perfect Dashboard: InfluxDB, Telegraf, and Grafana – Part XLIX (Monitoring Unofficial Veeam ONE Node Exporter)


Morning Jorge, love your blog. the graphs you can produce are very smart and I am trying to recreate with your guides.
Stumbling tho on this one, after installing the Telegraf service, you said not to change the main config at /etc/telegraf/telegraf.conf and better to use mv /etc/telegraf/telegraf.conf{,.old} to create a copy.
Using that command it seems to move the file to .old and not make a copy. After doing this command I manually made a copy of this file back to /etc/telegraf/telegraf.conf and then commented out the,
# [[outputs.influxdb]]
As suggested, after this I then created my /etc/telegraf/telegraf.d/influx.conf. with the sample script.
After doing this, it doesnt seem to load metrics into the telegraf db, I can see data, but think this was before changing the files around. I think I am getting mixed up somewhere and wondering if you can assist
Hello, oh yes, changed the command, needs to be:
cp /etc/telegraf/telegraf.conf{,.old}
🙂
Umh, run the telegraf in debug mode, or enable logging to see what is wrong, you have a video with the process here:
https://www.youtube.com/watch?v=_gCBq_n7ZJE
LEt me know
can you export the KVM guest patameters from libvirt in Host to the influxDB?
I think yes, it was on development but now it is closed, waiting for somebody to take it over – https://github.com/influxdata/telegraf/pull/2560
I’m working on trying to convert one of the dashboards to use Flux since I started with InfluxDB 2.1. Have you had a chance to poke at using Flux yet? It is a VERY different beast. If you’ve come across any good resources for adapting InfluxQL to Flux, I’d love to hear about em.
Cheers!
Thank you for the dashboard you made. I can say it worked pretty well for me. However, I ran into a problem after installation. You can see the problem in the below link.
There is no data in the fields I put in the red box. what could be the problem.
https://ibb.co/FWR5fpd
Hello Ahmet,
Would you mind sharing the telegraf.conf part where this vsphere part is, of course without your user-pass 🙂
Hello Jorge
The vsphere part of my telegraf.conf file is as follows
# # Read metrics from VMware vCenter
[[inputs.vsphere]]
# ## List of vCenter URLs to be monitored. These three lines must be uncommented
# ## and edited for the plugin to work.
vcenters = [ “https://192.168.2.33/sdk” ]
username = “[email protected]”
password = “xxxxxxx”
#
# ## VMs
# ## Typical VM metrics (if omitted or empty, all metrics are collected)
# # vm_include = [ “/*/vm/**”] # Inventory path to VMs to collect (by default all are collected)
# # vm_exclude = [] # Inventory paths to exclude
vm_metric_include = [
“cpu.demand.average”,
“cpu.idle.summation”,
“cpu.latency.average”,
“cpu.readiness.average”,
“cpu.ready.summation”,
“cpu.run.summation”,
“cpu.usagemhz.average”,
“cpu.used.summation”,
“cpu.wait.summation”,
“mem.active.average”,
“mem.granted.average”,
“mem.latency.average”,
“mem.swapin.average”,
“mem.swapinRate.average”,
“mem.swapout.average”,
“mem.swapoutRate.average”,
“mem.usage.average”,
“mem.vmmemctl.average”,
“net.bytesRx.average”,
“net.bytesTx.average”,
“net.droppedRx.summation”,
“net.droppedTx.summation”,
“net.usage.average”,
“power.power.average”,
“virtualDisk.numberReadAveraged.average”,
“virtualDisk.numberWriteAveraged.average”,
“virtualDisk.read.average”,
“virtualDisk.readOIO.latest”,
“virtualDisk.throughput.usage.average”,
“virtualDisk.totalReadLatency.average”,
“virtualDisk.totalWriteLatency.average”,
“virtualDisk.write.average”,
“virtualDisk.writeOIO.latest”,
“sys.uptime.latest”,
]
# # vm_metric_exclude = [] ## Nothing is excluded by default
# # vm_instances = true ## true by default
#
# ## Hosts
# ## Typical host metrics (if omitted or empty, all metrics are collected)
# # host_include = [ “/*/host/**”] # Inventory path to hosts to collect (by default all are collected)
# # host_exclude [] # Inventory paths to exclude
host_metric_include = [
“cpu.coreUtilization.average”,
“cpu.costop.summation”,
“cpu.demand.average”,
“cpu.idle.summation”,
“cpu.latency.average”,
“cpu.readiness.average”,
“cpu.ready.summation”,
“cpu.swapwait.summation”,
“cpu.usage.average”,
“cpu.usagemhz.average”,
“cpu.used.summation”,
“cpu.utilization.average”,
“cpu.wait.summation”,
“disk.deviceReadLatency.average”,
“disk.deviceWriteLatency.average”,
“disk.kernelReadLatency.average”,
“disk.kernelWriteLatency.average”,
“disk.numberReadAveraged.average”,
“disk.numberWriteAveraged.average”,
“disk.read.average”,
“disk.totalReadLatency.average”,
“disk.totalWriteLatency.average”,
“disk.write.average”,
“mem.active.average”,
“mem.latency.average”,
“mem.state.latest”,
“mem.swapin.average”,
“mem.swapinRate.average”,
“mem.swapout.average”,
“mem.swapoutRate.average”,
“mem.totalCapacity.average”,
“mem.usage.average”,
“mem.vmmemctl.average”,
“net.bytesRx.average”,
“net.bytesTx.average”,
“net.droppedRx.summation”,
“net.droppedTx.summation”,
“net.errorsRx.summation”,
“net.errorsTx.summation”,
“net.usage.average”,
“power.power.average”,
“storageAdapter.numberReadAveraged.average”,
“storageAdapter.numberWriteAveraged.average”,
“storageAdapter.read.average”,
“storageAdapter.write.average”,
“sys.uptime.latest”,
]
# ## Collect IP addresses? Valid values are “ipv4” and “ipv6”
# # ip_addresses = [“ipv6”, “ipv4” ]
#
# # host_metric_exclude = [] ## Nothing excluded by default
# # host_instances = true ## true by default
#
#
# ## Clusters
# # cluster_include = [ “/*/host/**”] # Inventory path to clusters to collect (by default all are collected)
# # cluster_exclude = [] # Inventory paths to exclude
cluster_metric_include = [] ## if omitted or empty, all metrics are collected
# # cluster_metric_exclude = [] ## Nothing excluded by default
# # cluster_instances = false ## false by default
#
# ## Datastores
# # datastore_include = [ “/*/datastore/**”] # Inventory path to datastores to collect (by default all are collected)
# # datastore_exclude = [] # Inventory paths to exclude
datastore_metric_include = [] ## if omitted or empty, all metrics are collected
# # datastore_metric_exclude = [] ## Nothing excluded by default
# # datastore_instances = false ## false by default
#
# ## Datacenters
# # datacenter_include = [ “/*/host/**”] # Inventory path to clusters to collect (by default all are collected)
# # datacenter_exclude = [] # Inventory paths to exclude
datacenter_metric_include = [] ## if omitted or empty, all metrics are collected
# datacenter_metric_exclude = [ “*” ] ## Datacenters are not collected by default.
# # datacenter_instances = false ## false by default
#
# ## Plugin Settings
# ## separator character to use for measurement and field names (default: “_”)
# # separator = “_”
#
# ## number of objects to retrieve per query for realtime resources (vms and hosts)
# ## set to 64 for vCenter 5.5 and 6.0 (default: 256)
# # max_query_objects = 256
#
# ## number of metrics to retrieve per query for non-realtime resources (clusters and datastores)
# ## set to 64 for vCenter 5.5 and 6.0 (default: 256)
# # max_query_metrics = 256
#
# ## number of go routines to use for collection and discovery of objects and metrics
# # collect_concurrency = 1
# # discover_concurrency = 1
#
# ## the interval before (re)discovering objects subject to metrics collection (default: 300s)
# # object_discovery_interval = “300s”
#
# ## timeout applies to any of the api request made to vcenter
# # timeout = “60s”
#
# ## When set to true, all samples are sent as integers. This makes the output
# ## data types backwards compatible with Telegraf 1.9 or lower. Normally all
# ## samples from vCenter, with the exception of percentages, are integer
# ## values, but under some conditions, some averaging takes place internally in
# ## the plugin. Setting this flag to “false” will send values as floats to
# ## preserve the full precision when averaging takes place.
# # use_int_samples = true
#
# ## Custom attributes from vCenter can be very useful for queries in order to slice the
# ## metrics along different dimension and for forming ad-hoc relationships. They are disabled
# ## by default, since they can add a considerable amount of tags to the resulting metrics. To
# ## enable, simply set custom_attribute_exclude to [] (empty set) and use custom_attribute_include
# ## to select the attributes you want to include.
# ## By default, since they can add a considerable amount of tags to the resulting metrics. To
# ## enable, simply set custom_attribute_exclude to [] (empty set) and use custom_attribute_include
# ## to select the attributes you want to include.
# # custom_attribute_include = []
# # custom_attribute_exclude = [“*”]
#
# ## The number of vSphere 5 minute metric collection cycles to look back for non-realtime metrics. In
# ## some versions (6.7, 7.0 and possible more), certain metrics, such as cluster metrics, may be reported
# ## with a significant delay (>30min). If this happens, try increasing this number. Please note that increasing
# ## it too much may cause performance issues.
# # metric_lookback = 3
#
# ## Optional SSL Config
# # ssl_ca = “/path/to/cafile”
# # ssl_cert = “/path/to/certfile”
# # ssl_key = “/path/to/keyfile”
# ## Use SSL but skip chain & host verification
insecure_skip_verify = true
#
# ## The Historical Interval value must match EXACTLY the interval in the daily
# # “Interval Duration” found on the VCenter server under Configure > General > Statistics > Statistic intervals
# # historical_interval = “5m”
Hello,
From where did you pick up those values? They do not match with my blog post here:
https://jorgedelacruz.uk/2018/10/01/looking-for-the-perfect-dashboard-influxdb-telegraf-and-grafana-part-xii-native-telegraf-plugin-for-vsphere/
Or even from the grafana website where you download the dashboard, the config is there:
https://grafana.com/grafana/dashboards/8159
Use the recommended config and let me know.
Best regards
Hi Jorge;
thank you for your interesting.
The values I sent earlier are in the content of the telegraf.conf file. I looked at your blog post again. I forgot to add the telegraf.d/vsphere-stats.conf file. I have now attached that file as well. Currently, only the Vcenter CPU/ram part data is not visible. Others worked.
I am using the dashboard with ID 8159.
https://ibb.co/yPT9TjQ
I disabled all the vsphere-related parts of the telegraf.conf file I sent. Right now I’m just using the telegraf.d/vsphere-stats.conf file. its content is as below
## Realtime instance
[[inputs.vsphere]]
## List of vCenter URLs to be monitored. These three lines must be uncommented
## and edited for the plugin to work.
interval = “60s”
vcenters = [ “https://192.168.2.33/sdk” ]
username = “[email protected]”
password = “xxx”
vm_metric_include = []
host_metric_include = []
cluster_metric_include = []
datastore_metric_exclude = [“*”]
max_query_metrics = 256
timeout = “60s”
insecure_skip_verify = true
## Historical instance
[[inputs.vsphere]]
interval = “300s”
vcenters = [ “https://192.168.2.33/sdk” ]
username = “[email protected]”
password = “xxx”
datastore_metric_include = [ “disk.capacity.latest”, “disk.used.latest”, “disk.provisioned.latest” ]
insecure_skip_verify = true
force_discover_on_init = true
host_metric_exclude = [“*”] # Exclude realtime metrics
vm_metric_exclude = [“*”] # Exclude realtime metrics
max_query_metrics = 256
collect_concurrency = 3
Hello,
Thanks a lot, if you restart telegraf after removing the telegraf.conf part, and the 192.168.2.33 it is a vCenter Server, this should work just fine, let me know.
Hello Jorge
I restarted all services (telegraf+influx+grafana).
unfortunately the Vcenter CPU/ram part is not visible. You can see it in the picture. I added the link.
https://ibb.co/8rR5bTs
Vcenter CPU/RAM query as below. Could there be an error in this part?
from(bucket: v.defaultBucket)
|> range(start: v.timeRangeStart, stop: v.timeRangeStop)
|> filter(fn: (r) => r[“_measurement”] == “vsphere_vm_cpu”)
|> filter(fn: (r) => r[“_field”] == “usage_average”)
|> filter(fn: (r) => r[“guesthostname”] =~ /${vcenter:regex}/)
|> group(columns: [“vmname”])
|> aggregateWindow(every: v.windowPeriod, fn: mean, createEmpty: false)
|> yield(name: “mean”)
Hello,
There is no error, no. That query is using the center variable to query the CPU and RAM. And the vCenter is got with this variable on the dashboard:
https://www.dropbox.com/s/8oxveskkqcuywbg/2022-03-16_10-07-56.jpg?dl=1
So, if in that variable you do not get anything, that might be the error.
Or on that query you showed me, you can remove the ~ /${vcenter:regex}/ and just put your vcenter guesthostname like:
from(bucket: v.defaultBucket)|> range(start: v.timeRangeStart, stop: v.timeRangeStop)
|> filter(fn: (r) => r["_measurement"] == "vsphere_vm_cpu")
|> filter(fn: (r) => r["_field"] == "usage_average")
|> filter(fn: (r) => r["guesthostname"] == "vcsa.jorgedelacruz.es")
|> group(columns: ["vmname"])
|> aggregateWindow(every: v.windowPeriod, fn: mean, createEmpty: false)
|> yield(name: "mean")
Cheers
yes this worked. thanks Jorge.
https://ibb.co/GcvLj9N
Can we name the green and yellow lines? It’s written as Vcenter Server, both on cpu and ram?
Yes, create 2 overrides, one per query, with display name of your choice.
Cheers!
thank you so so much Jorge. everthing is working well
Hi Jorgeuk,
Thanks for this guide. Lots of good stuff. Your vSphere overview dashboard is awesome. I am new to Gragana so I have been trying to understand how to tweak the fields for the widgets. Would you know how to create a widget that would show you if your vcenter host are running as N+1 or not? Something that would take the CPU and RAM from each host and then divided it by the free CPU and RAM to the running N+1 rating? Not sure if that is possible or not.
Hi Jorge,
Thanks for the guide super helpful. I was wondering if you had a widget for showing your vcenter cluster host as a N+1 or not? The vcenter over view is an awesome dashboard but would like to add one that lets me know if we have enough host for a failover.
Hello Ben,
Appreciated it, yes that might be possible, running the specific queries without a doubt. Let me give it a try.
https://jorgedelacruz.uk/wp-content/uploads/2021/04/grafana-influx2-003-750×382.jpg, can you put in gist or editable txt for try?
again, https://jorgedelacruz.uk/wp-content/uploads/2021/04/grafana-influx2-003-750×382.jpg, can you post that query textable pls
Hello,
But those queries, you can find them inside the Dashboard themselves, minus the variables that you can not use on the Explore from Grafana – https://www.dropbox.com/s/fn9tc8bbbzvjjy8/2022-09-07_9-16-35.png?dl=1
Or, you can build those queries visually using Chronograf, the https://YOURINFLUXIP:8086 there you pick the stuff, click in edit and you will see the query you can copy/paste in Grafana.
Cheers
Hello jorgeuk,
I followed this guide with no issues. For some reason I am not able to see any data from vcenter. I loaded your dashboards and still unable to see any data. https://jorgedelacruz.uk/2021/04/14/looking-for-the-perfect-dashboard-influxdb-telegraf-and-grafana-part-i-installing-influxdb-telegraf-and-grafana-on-ubuntu-20-04-lts/
I used you “Recommended telegraph configuration for your VMware vSphere environments” in /etc/telegraf/telegraf.d/vsphere-monitor.conf file: https://jorgedelacruz.uk/2020/01/23/vmware-how-to-achieve-a-perfect-metric-collection-interval-with-telegraf-influxdb-and-grafana/
below is the failed test result with no data in the dashboard:
@grafana:/home/user# telegraf –config /etc/telegraf/telegraf.conf –test
2022-10-27T04:36:20Z W! DeprecationWarning: Option “force_discover_on_init” of plugin “inputs.vsphere” deprecated since version 1.14.0 and will be removed in 2.0.0: option is ignored
2022-10-27T04:36:20Z I! Starting Telegraf 1.24.2
2022-10-27T04:36:20Z I! Available plugins: 222 inputs, 9 aggregators, 26 processors, 20 parsers, 57 outputs
2022-10-27T04:36:20Z I! Loaded inputs: system vsphere
2022-10-27T04:36:20Z I! Loaded aggregators:
2022-10-27T04:36:20Z I! Loaded processors:
2022-10-27T04:36:20Z W! Outputs are not used in testing mode!
2022-10-27T04:36:20Z I! Tags enabled: host=grafana
2022-10-27T04:36:20Z W! Deprecated inputs: 0 and 1 options
2022-10-27T04:36:20Z I! [inputs.vsphere] Starting plugin
> system,host=grafana load1=0,load15=0,load5=0.01,n_cpus=2i,n_users=2i 1666845380000000000
> system,host=grafana uptime=2246i 1666845380000000000
> system,host=grafana uptime_format=” 0:37″ 1666845380000000000
2022-10-27T04:36:20Z I! [inputs.vsphere] Stopping plugin
root@grafana:/home/user#
Any help please? Thank you.
Hello,
What happens without the test option? What is the telegraf.log saying? If not enabled, the logging option, you should enable it first.
I can confirm it is a configuration issue on your side, as just followed all the steps and worked without any problem. The telegraf.log would show you more data.
Hi Jorgeuk,
I followed your recommended link and tested again (https://jorgedelacruz.uk/2021/04/14/looking-for-the-perfect-dashboard-influxdb-telegraf-and-grafana-part-i-installing-influxdb-telegraf-and-grafana-on-ubuntu-20-04-lts/). I am still unable to send vsphere data to influxdb. When I run it, it just stuck on Starting plugin as shown below:
———————————-
2022-10-31T14:53:14Z I! Starting Telegraf 1.24.2
2022-10-31T14:53:14Z I! Available plugins: 222 inputs, 9 aggregators, 26 processors, 20 parsers, 57 outputs
2022-10-31T14:53:14Z I! Loaded inputs: cpu disk diskio kernel mem processes swap system vsphere (2x)
2022-10-31T14:53:14Z I! Loaded aggregators:
2022-10-31T14:53:14Z I! Loaded processors:
2022-10-31T14:53:14Z I! Loaded outputs: influxdb_v2
2022-10-31T14:53:14Z I! Tags enabled: host=grafana
2022-10-31T14:53:14Z W! Deprecated inputs: 0 and 2 options
2022-10-31T14:53:14Z I! [agent] Config: Interval:10s, Quiet:false, Hostname:”grafana”, Flush Interval:10s
2022-10-31T14:53:14Z I! [inputs.vsphere] Starting plugin
2022-10-31T14:53:14Z I! [inputs.vsphere] Starting plugin
—————————–
Below is the debug output.
2022-10-31T14:43:24Z I! Starting Telegraf 1.24.2
2022-10-31T14:43:24Z I! Available plugins: 222 inputs, 9 aggregators, 26 processors, 20 parsers, 57 outputs
2022-10-31T14:43:24Z I! Loaded inputs: cpu disk diskio kernel mem processes swap system vsphere (2x)
2022-10-31T14:43:24Z I! Loaded aggregators:
2022-10-31T14:43:24Z I! Loaded processors:
2022-10-31T14:43:24Z I! Loaded outputs: influxdb_v2
2022-10-31T14:43:24Z I! Tags enabled: host=grafana
2022-10-31T14:43:24Z W! Deprecated inputs: 0 and 2 options
2022-10-31T14:43:24Z I! [agent] Config: Interval:10s, Quiet:false, Hostname:”grafana”, Flush Interval:10s
2022-10-31T14:43:24Z D! [agent] Initializing plugins
2022-10-31T14:43:24Z D! [agent] Connecting outputs
2022-10-31T14:43:24Z D! [agent] Attempting connection to [outputs.influxdb_v2]
2022-10-31T14:43:24Z D! [agent] Successfully connected to outputs.influxdb_v2
2022-10-31T14:43:24Z D! [agent] Starting service inputs
2022-10-31T14:43:24Z I! [inputs.vsphere] Starting plugin
2022-10-31T14:43:24Z D! [inputs.vsphere] Creating client: 10.10.10.10
2022-10-31T14:43:24Z D! [inputs.vsphere] Option query for maxQueryMetrics failed. Using default
2022-10-31T14:43:24Z D! [inputs.vsphere] vCenter version is: 7.0.3
2022-10-31T14:43:24Z D! [inputs.vsphere] vCenter says max_query_metrics should be 256
2022-10-31T14:43:24Z D! [inputs.vsphere] Running initial discovery
2022-10-31T14:43:24Z D! [inputs.vsphere] Discover new objects for 10.10.10.10
2022-10-31T14:43:24Z D! [inputs.vsphere] Discovering resources for vm
2022-10-31T14:43:24Z D! [inputs.vsphere] Find(VirtualMachine, /*/vm/**) returned 0 objects
2022-10-31T14:43:24Z D! [inputs.vsphere] Find(ResourcePool, /*/host/**) returned 0 objects
2022-10-31T14:43:24Z D! [inputs.vsphere] Discovering resources for datastore
2022-10-31T14:43:24Z D! [inputs.vsphere] Find(Datastore, /*/datastore/**) returned 0 objects
2022-10-31T14:43:24Z D! [inputs.vsphere] Discovering resources for datacenter
2022-10-31T14:43:24Z D! [inputs.vsphere] Find(Datacenter, /*) returned 0 objects
2022-10-31T14:43:24Z D! [inputs.vsphere] Discovering resources for cluster
2022-10-31T14:43:24Z D! [inputs.vsphere] Find(ClusterComputeResource, /*/host/**) returned 0 objects
2022-10-31T14:43:24Z D! [inputs.vsphere] Discovering resources for resourcepool
2022-10-31T14:43:24Z D! [inputs.vsphere] Find(ResourcePool, /*/host/**) returned 0 objects
2022-10-31T14:43:24Z D! [inputs.vsphere] Discovering resources for host
2022-10-31T14:43:24Z D! [inputs.vsphere] Find(HostSystem, /*/host/**) returned 0 objects
2022-10-31T14:43:24Z I! [inputs.vsphere] Starting plugin
2022-10-31T14:43:24Z D! [inputs.vsphere] Creating client: 10.10.10.10
2022-10-31T14:43:24Z D! [inputs.vsphere] Option query for maxQueryMetrics failed. Using default
2022-10-31T14:43:24Z D! [inputs.vsphere] vCenter version is: 7.0.3
2022-10-31T14:43:24Z D! [inputs.vsphere] vCenter says max_query_metrics should be 256
2022-10-31T14:43:24Z D! [inputs.vsphere] Running initial discovery
2022-10-31T14:43:24Z D! [inputs.vsphere] Discover new objects for 10.10.10.10
2022-10-31T14:43:24Z D! [inputs.vsphere] Discovering resources for resourcepool
2022-10-31T14:43:24Z D! [inputs.vsphere] Find(ResourcePool, /*/host/**) returned 0 objects
2022-10-31T14:43:24Z D! [inputs.vsphere] Discovering resources for host
2022-10-31T14:43:24Z D! [inputs.vsphere] Find(HostSystem, /*/host/**) returned 0 objects
2022-10-31T14:43:24Z D! [inputs.vsphere] Discovering resources for vm
2022-10-31T14:43:24Z D! [inputs.vsphere] Discovering resources for datastore
2022-10-31T14:43:24Z D! [inputs.vsphere] Find(Datastore, /*/datastore/**) returned 0 objects
2022-10-31T14:43:24Z D! [inputs.vsphere] Discovering resources for datacenter
2022-10-31T14:43:24Z D! [inputs.vsphere] Find(Datacenter, /*) returned 0 objects
2022-10-31T14:43:24Z D! [inputs.vsphere] Discovering resources for cluster
2022-10-31T14:43:24Z D! [inputs.vsphere] Find(ClusterComputeResource, /*/host/**) returned 0 objects
2022-10-31T14:43:34Z D! [outputs.influxdb_v2] Wrote batch of 22 metrics in 4.9024ms
2022-10-31T14:43:34Z D! [outputs.influxdb_v2] Buffer fullness: 0 / 10000 metrics
2022-10-31T14:43:44Z D! [outputs.influxdb_v2] Wrote batch of 25 metrics in 4.57513ms
2022-10-31T14:43:44Z D! [outputs.influxdb_v2] Buffer fullness: 0 / 10000 metrics
———————–
Here is my config for vSphere input plugin:
———————–
# -# Read metrics from one or many vCenters
## Realtime instance
[[inputs.vsphere]]
interval = “60s”
vcenters = [ “https://10.10.10.10/sdk” ]
username = “[email protected]”
password = “secret”
insecure_skip_verify = true
# force_discover_on_init = true
# Exclude all historical metrics
datastore_metric_exclude = [“*”]
cluster_metric_exclude = [“*”]
datacenter_metric_exclude = [“*”]
resourcepool_metric_exclude = [“*”]
collect_concurrency = 5
discover_concurrency = 5
# Historical instance
[[inputs.vsphere]]
interval = “300s”
vcenters = [ “https://10.10.10.10/sdk” ]
username = “[email protected]”
password = “secret”
insecure_skip_verify = true
force_discover_on_init = true
host_metric_exclude = [“*”] # Exclude realtime metrics
vm_metric_exclude = [“*”] # Exclude realtime metrics
max_query_metrics = 256
collect_concurrency = 3
Could you please look into it and help me on this?
Thanks
Hi ,
I entered the below in telegraf.conf file
[[inputs.http_response]]
# name_override = “_http_status”
address = [“https://example.com”]
response_timeout = “10s”
method = “GET”
And the query i entered in grafana was
SELECT last(“http_response_code”) FROM “http_response” WHERE $timeFilter
and the output its showing only http_response_code . i want to see to which url that “http_response code” belongs to.
Can anyone help me on this query
Hello,
You will need to use grouping of course. https://docs.influxdata.com/influxdb/cloud/query-data/influxql/explore-data/group-by/
Give it a try.
Why not using the dashboard I already created to use it as inspiration? Also what version of InfluxDB are you using?
i have a veeam 12.2 and enterprise manager accordingly i have created local user and tried setting it for portal admin
but i still get this:
Unauthorized: Authentication failed
Any idea of where i failed?