
 Greetings friends, 2025 has started truly strong regarding cyber security, hopefully if you have not been living under a rock you might know by now how ransomware gangs are targeting ESXi, and more precisely the SSH service, a few references for you:
- https://www.bitdefender.com/en-us/blog/businessinsights/akira-ransomware-a-shifting-force-in-the-raas-domain
- https://thehackernews.com/2025/01/ransomware-targets-esxi-systems-via.html
- https://insight.scmagazineuk.com/covert-vmware-esxi-targeted-ransomware-facilitated-by-ssh-tunnelling
- https://www.bleepingcomputer.com/news/security/ransomware-gang-uses-ssh-tunnels-for-stealthy-vmware-esxi-access/
- https://www.techradar.com/pro/security/this-ransomware-gang-is-using-ssh-tunnels-to-target-vmware-appliances
ESXi – Seen by an attacker lens
This tactic is well know in the MITRE ATT&KC world as Lateral Movement – TA0008, but it is not the only one that hackers tend to use when we talk about ESXi. This is a comprehensive list of all the known tactics and techniques used today by ransomware:
| Tactic | MITRE ATT&CK Technique | Description |
|---|---|---|
| Initial Access (TA0001) | T1210 – Exploitation of Remote Services | Attackers exploit ESXi vulnerabilities (e.g., CVE-2021-21974) to gain access. |
| Execution (TA0002) | T1059 – Command and Scripting Interpreter | Once inside, attackers execute malicious scripts via SSH or ESXi Shell. |
| Persistence (TA0003) | T1543.003 – Create or Modify System Process: Unix Service | Attackers create persistent backdoors in ESXi services (e.g., modifying /etc/rc.local.d/local.sh). |
| Privilege Escalation (TA0004) | T1068 – Exploitation for Privilege Escalation | Exploiting misconfigurations or vulnerabilities to gain root access. |
| Defense Evasion (TA0005) | T1070.004 – Indicator Removal on Host: File Deletion | Attackers delete logs from ESXi to evade detection (rm -rf /var/log). |
| Credential Access (TA0006) | T1552.004 – Unsecured Credentials: Private Keys | Attackers steal SSH private keys to pivot into other ESXi hosts. |
| Lateral Movement (TA0008) | T1021.004 – Remote Services: SSH | Attackers use SSH tunneling to access internal systems. |
| Lateral Movement (TA0008) | T1563.001 – SSH Hijacking | Hijacking active SSH sessions from admins. |
| Collection (TA0009) | T1005 – Data from Local System | Attackers exfiltrate VM disk files before encryption. |
| Impact (TA0040) | T1486 – Data Encrypted for Impact | Ransomware encrypts VMFS storage on ESXi servers. |
| Impact (TA0040) | T1490 – Inhibit System Recovery | Attackers delete snapshots and backups (esxcli snapshot remove --all). |
Hopefully following the article, it can help us to diligently monitor this super critical part of every business out there running VMware vSphere. Look at what techradar says:
Veeam Data Platform – Advanced Edition
In Veeam Data Platform Advanced edition, we can found Veeam ONE. Veeam ONE is not just yet another monitoring tool, it is a real-time backup intelligence platform designed to give us full visibility, proactive alerting, and rapid incident response. From tracking protected vs. unprotected workloads across VMs, cloud instances, and physical machines to detecting ransomware-like behaviour in real time, Veeam ONE ensures us to stay ahead of issues before they impact our backups.
Anyways, if you want to know more please visit the official website: https://www.veeam.com/products/veeam-data-platform.html?ad=menu-products-portfolio
One of those functionalities that I always loved from Veeam ONE is the real-time VMware vSphere monitoring. Let’s see how Veeam ONE can help us identifying some of those ransomware techniques, to get notifications in real-time on our preferred Incident Management.
How-to track VMware vSphere Authentication Attempts
Veeam ONE comes with two native alarms to spot when a bad login attempt has occurred, to both, the ESXi Hosts, and vCenter: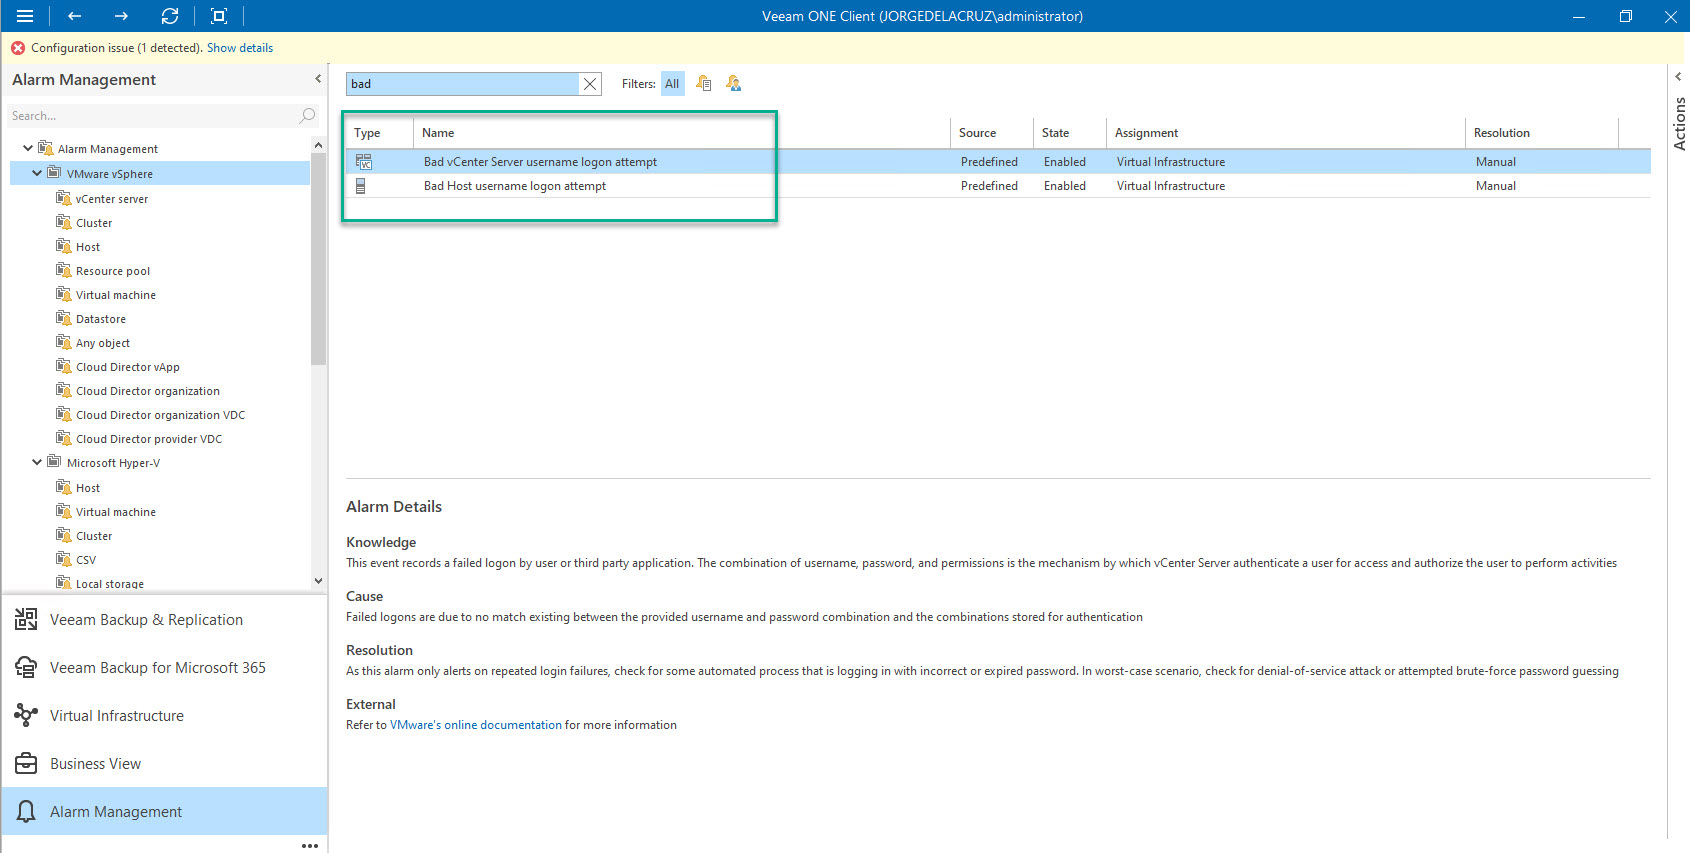 That couldn’t be easier, but what about tracking in real-time SSH authentication attempts? As I said before, the flexibility of Veeam ONE is outstanding, and we can create our own alarms from Events. Let’s explore Virtual Infrastructure events at the top of the Infrastructure tree, and let’s perform a few mixed logins as well, as you can see there are three different events for this particular host, let me explain them:
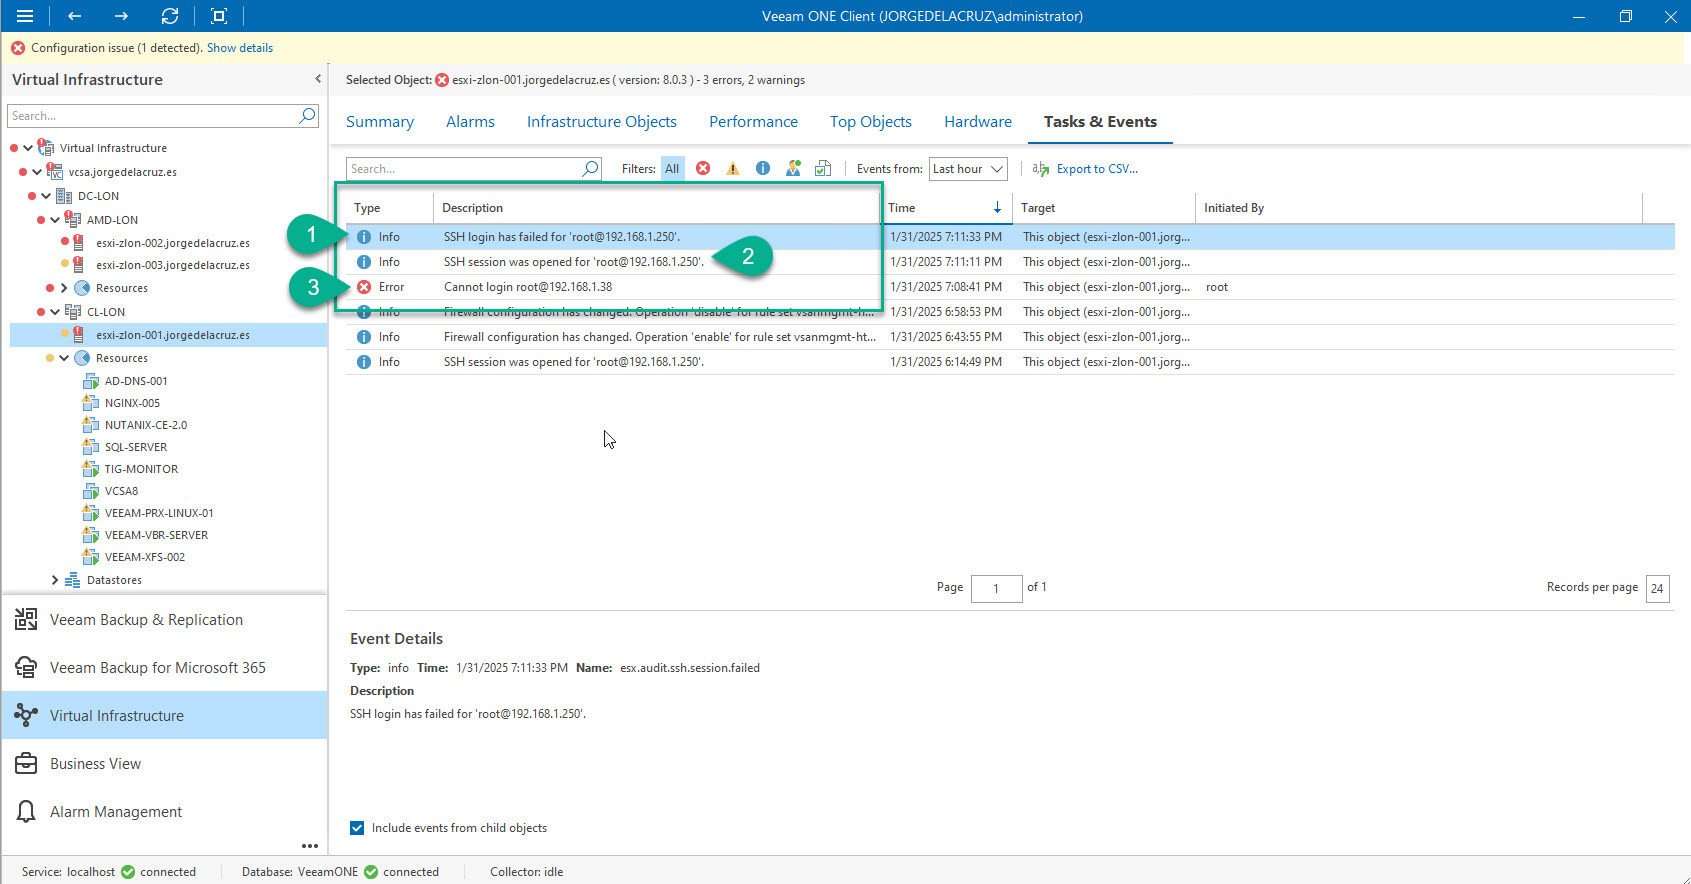
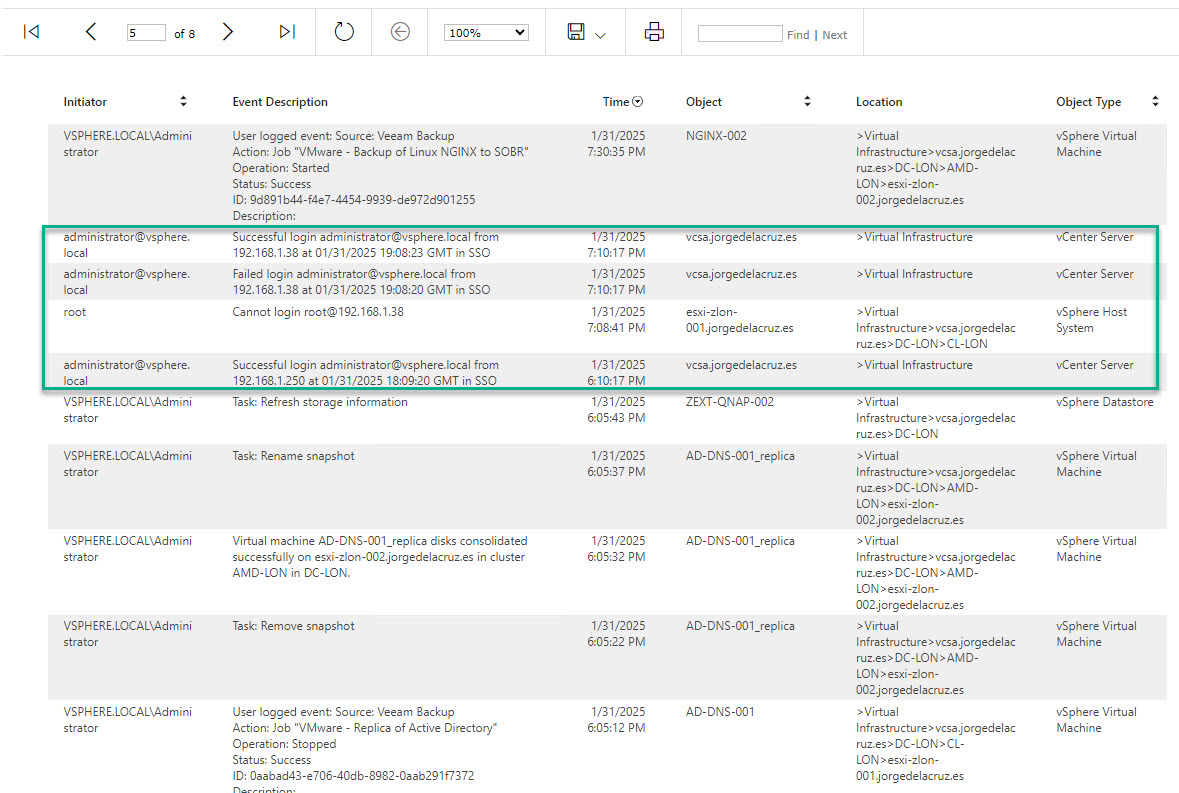
- A failed SSH Attempt using root, we can also see the source IP. Which it can be an infected host doing that SSH tunnelling we mentioned before.
- A successful SSH authentication, coming from the same IP in this case.
- A failed authentication from the Host Management web interface. This has a dedicated Veeam ONE alarm, mentioned above.
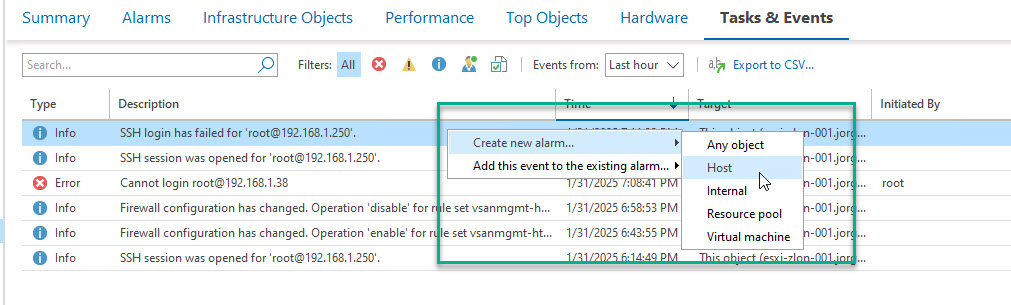
 Right, now that we have set the scene, I hope you agree that getting real-time alarms on point number one, and three is important. As number three is all good and covered by default by Veeam ONE, let’s focus on number one, click on it and select: Create new alarm > Host:
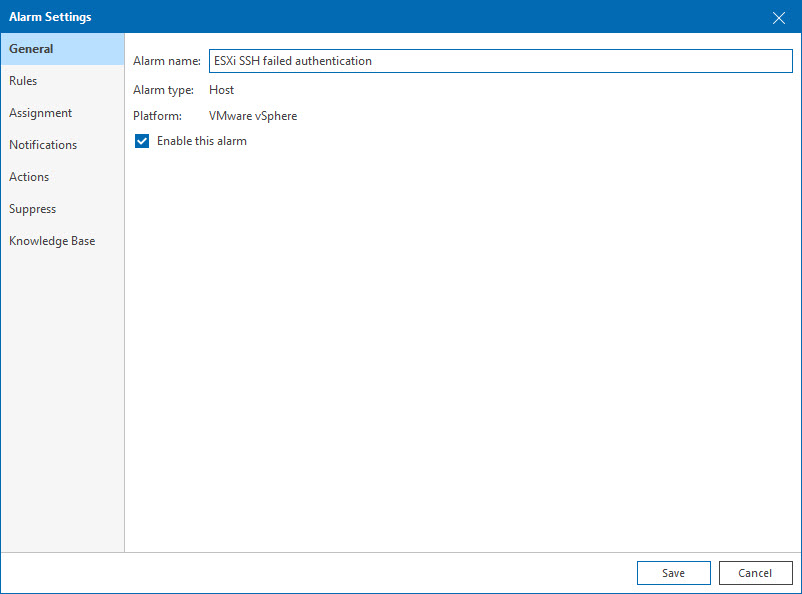
 1.- General: Let’s introduce a name for the Alarm, in my case ESXi SSH failed authentication:
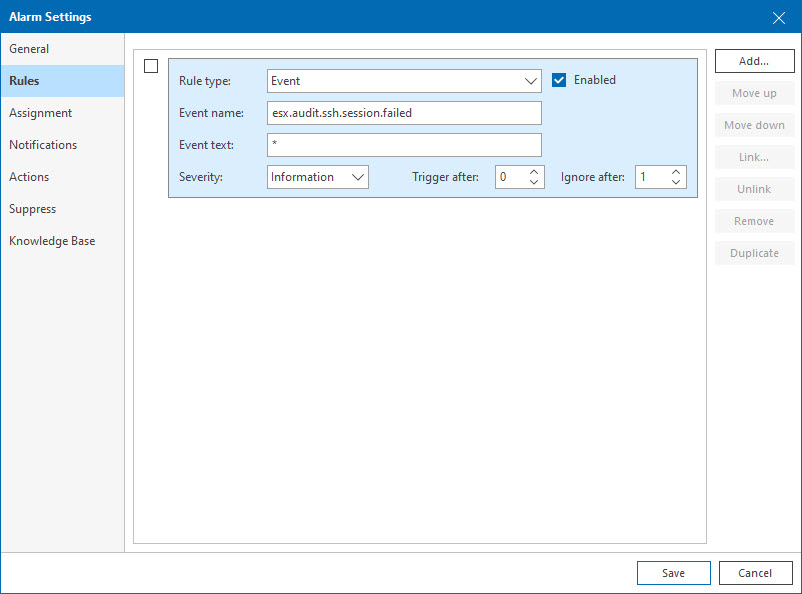
 2.- Rules: It is an event-based alarm, which is great, because we can group multiple SSH events we consider relevant and send an unique alarm, depending of the triggered event, up to you, on my case I will have a single event. Also, you can always fine-tune the trigger and ignore thresholds:
 3.- Assignment: Veeam ONE makes it extremely simple to apply this alarm, not just to one ESXi, but to all of the Virtual Infrastructure we have, imagine having dozens, or hundreds of ESXis, well that is just a single alarm configuration to keep an eye on all of them:
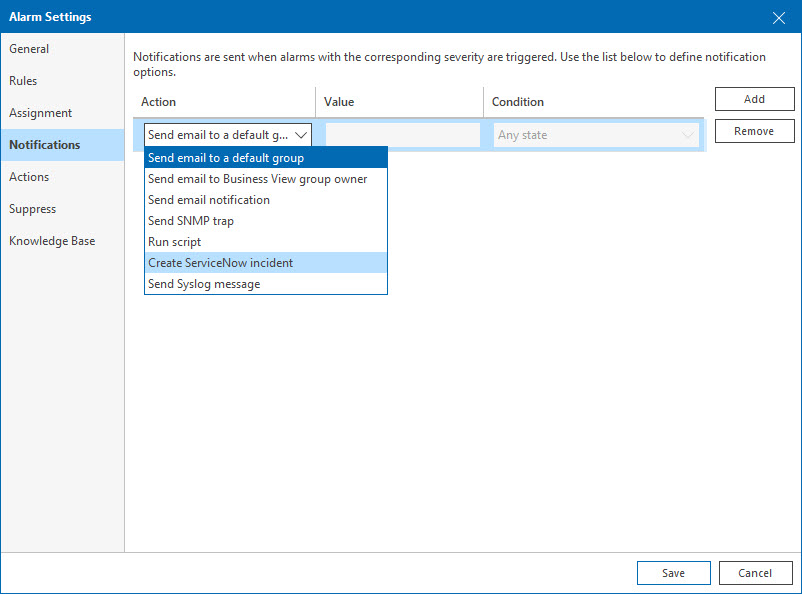
 4.- Notifications: The notifications part is the stronger part of Veeam ONE, as you can configure as many different teams need to receive this alarm, imagine an email to an specific team, perhaps a syslog to DevOps team, and a ServiceNow incident for the Security Team, all of that is possible:
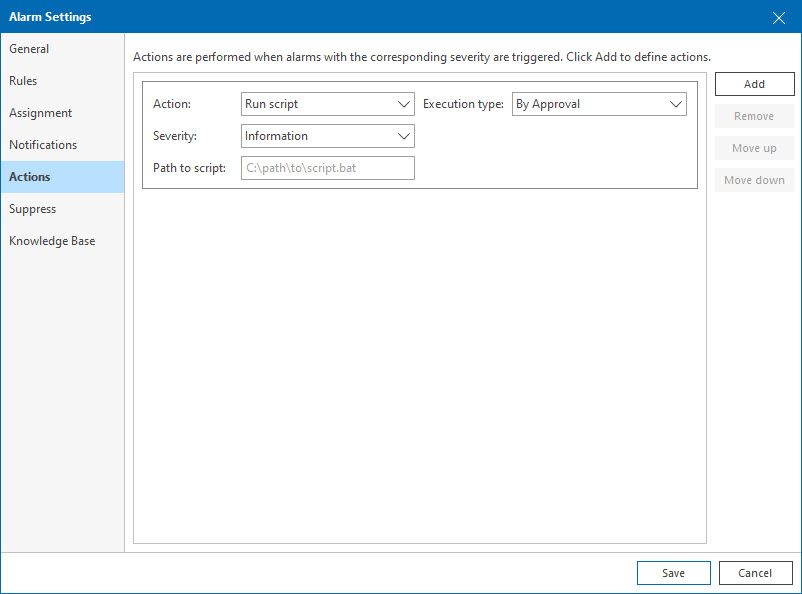
 5.- Actions: Finally, did you know that you can trigger scripts on the alarms? Imagine this specific alarm, getting errors of authentication on SSH. Perhaps we can hook a PowerCLI script that checks the status of the SSH across all hosts, and disable it in mass, why not? You can add anything .bat or .ps1 which Veeam ONE will execute, so you can be creative if required.
 Alright you got the idea, let’s see now a few other events that I think they deserve your attention, and most likely configuring Alarms if you see events/tasks like these:
- AccountCreatedEvent – Someone with access to the ESXi webui, or in SSH creates an esxi user
- esx.audit.ssh.enabled or esx.audit.ssh.disabled – Someone has enabled/disabled the SSH service, worth to explore what happened
- esx.audit.net.firewall.config.changed – Someone changing the Firewall configuration of an ESXi at 3am your local time? Doesn’t sound good, explore it!
- esx.audit.net.firewall.port.hooked – A new VMKernel created while you were having your Taco Tuesday with the team? Doesn’t look cool
And like these, there are hundreds of events that Veeam ONE picks from VMware vSphere that can help you creating your custom alarms to notify your different teams.
Enterprise Incident Management
Since Veeam ONE v12.1, now we can connect to our ServiceNow instance, and as I have shown you, just create incidents from our alarms. Which makes it truly easy to get these critical ESXi monitoring alarms, directly into the team that will action these incidents. This is how the alarm will look like:
This is from the list of ServiceNow Incidents
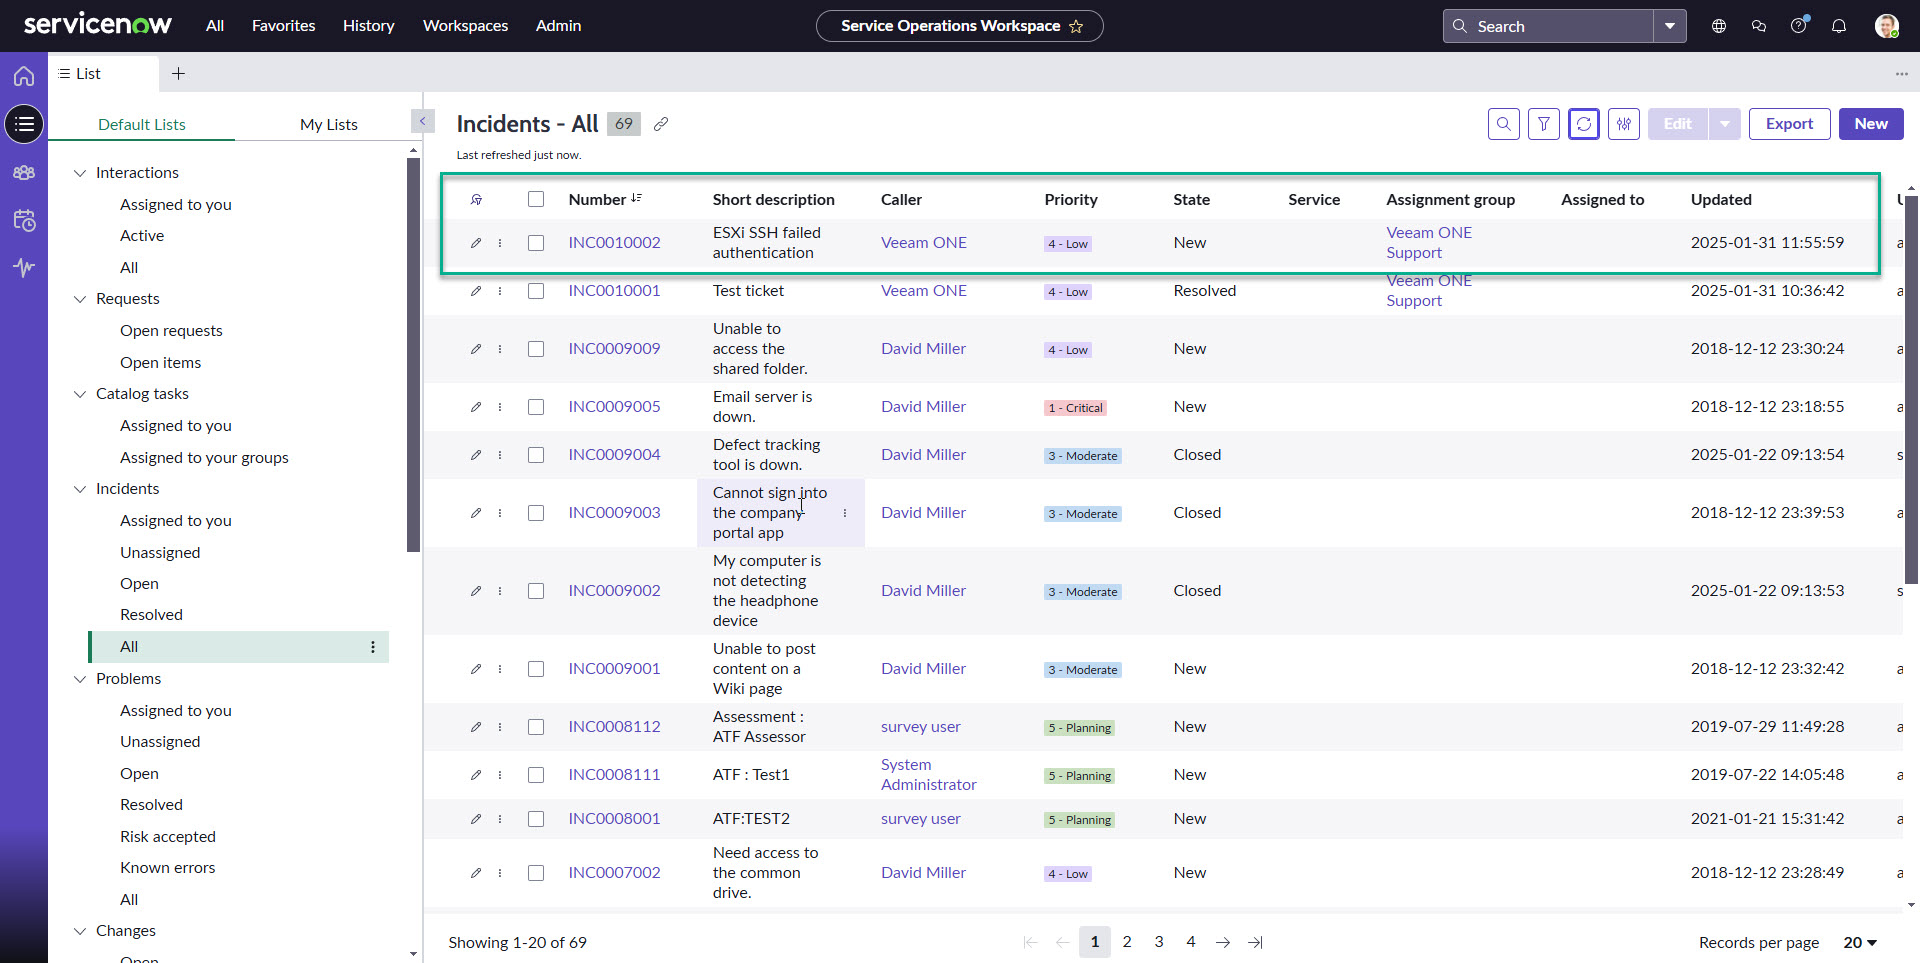 And this is the ServiceNow Incident expanded:
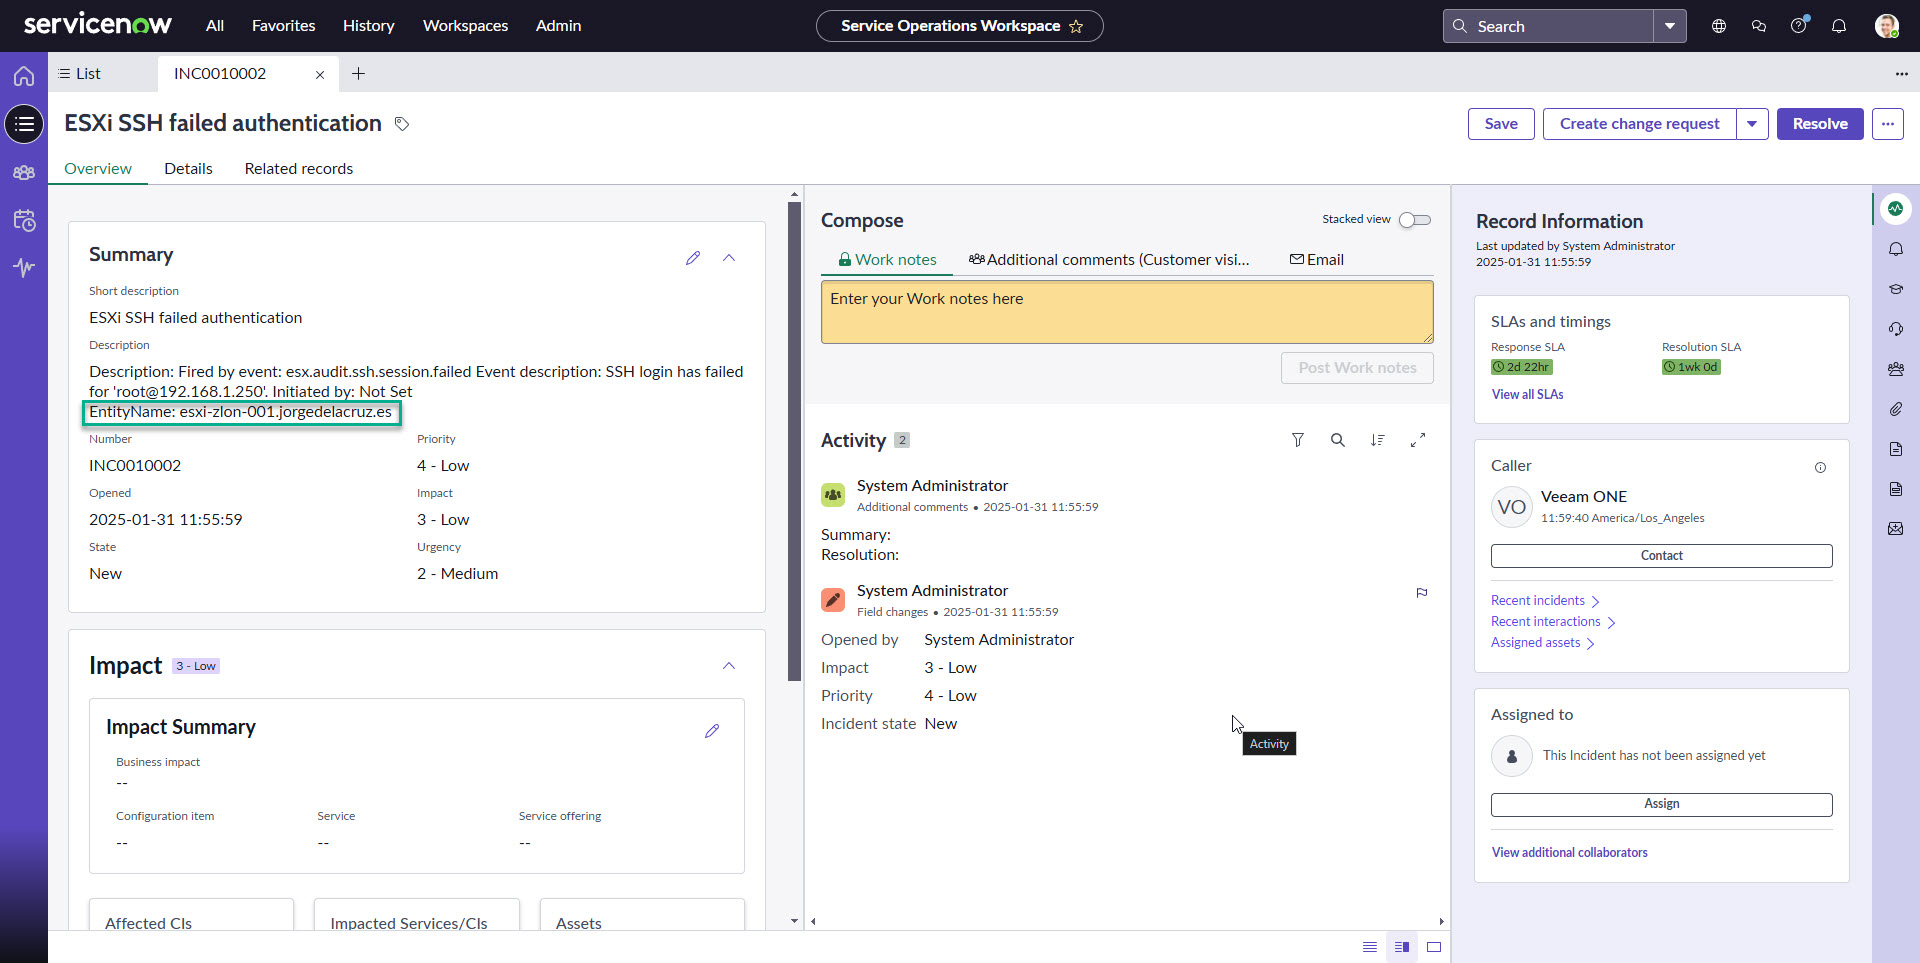 We can control the Priority and Impact in Veeam ONE by configuring if we think these alarms are Information, Warning, or Error. So for example the failed SSH attempt, to me it will be an Error so it triggers the most impact and priority in ServiceNow, but you can configure it.
Native Monitoring and Security
Of course, you can always add some open source tools, or even forward to syslog the next ESXi files:
- /var/log/shell.log (ESXi shell activity log)
- /var/log/hostd.log (Host agent log)
- /var/log/auth.log (authentication log)
- /var/log/vobd.log (VMware observer daemon log)
But configuring that, across a large ESXi fleet could be a bit tricky, it depends of Linux expertise and orchestration abilities I guess.
Reporting and Compliance
Now, if we need to produce a report on changes across all our ESXi Hosts within a given time period, Veeam ONE has the excellent:
Which it will be just perfect to present to an auditor, as it does log every single change that it happened to our environment, so we are not only receiving real-time alarms, but also we can go back in time at any time to perhaps even unfold a bit of the blast radius impact in case of an infection.
 Please let me know in case you are monitoring your ESXi SSH, and other events, how do you do it today? And if not, well, leave a comment anyways with your thoughts 🙂
Leave a Reply