
Greetings friends, in previous posts on FreeNAS 11.x I have shown you how to deploy it over vSphere, and how to deploy an SSL certificate using Let's Encrypt, both posts have been very well received by those who are using Homelabs, or if you have small businesses where your hosts have a lot of local storage it is a good idea to put that storage to
opensource
FreeNAS: How to Deploy a Let’s Encrypt SSL Certificate in FreeNAS 11.x and HTTPS Configuration
Greetings friends, the other day I showed you how to deploy FreeNAS 11.x on a vSphere environment, which can be perfectly reproduced in Hyper-V, or in any other Hypervisor or physical, or in Cloud. One of the most important things in this type of cases, is to have security when we activate space sharing services, whether FTP, Object Storage,
FreeNAS: Initial installation and configuration of FreeNAS 11.x as VM within vSphere
Greetings friends, today I come to tell you how to deploy and configure one of the best open source projects that I have been following for about 12 years. This is FreeNAS, a software that turns any computer, or VM, into a powerful NAS system with support for SMB, CIFS, NFS, SSH, iSCSI and much more. This project was also based on my beloved
Looking for the Perfect Dashboard: InfluxDB, Telegraf and Grafana – Part XVII – Showing Dashboards on Two Monitors Using Raspberry Pi 4
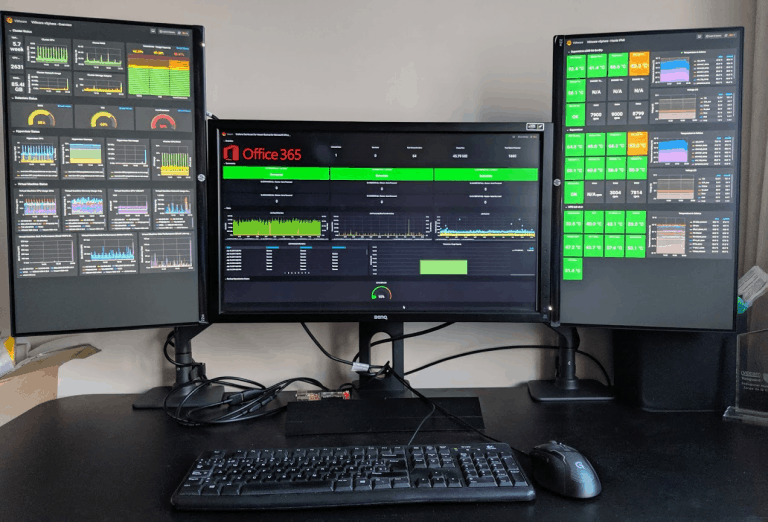
Greetings friends, I have been telling you throughout the series on Grafana many things, from how to monitor Linux, Windows, Veeam, VMware, and also the Server temperature using IPMI. Today I thought it convenient to show you the step by step to be able to visualize our Dashboards, if we have followed all the series will be already about 16
Looking for Perfect Dashboard: InfluxDB, Telegraf and Grafana – Part XVI – Performance and Advanced Security of Veeam Backup for Microsoft Office 365
Greetings friends, I come to the sixteenth post on InfluxDB, Telegraf and Grafana, you can find all the posts on InfluxDB, Telegraf and Grafana here. Today I bring you a new entry, in this case it is a Dashboard focused on advanced security when we use Veeam Backup for Microsoft Office 365. Veeam Backup for Microsoft Office 365 is in charge of