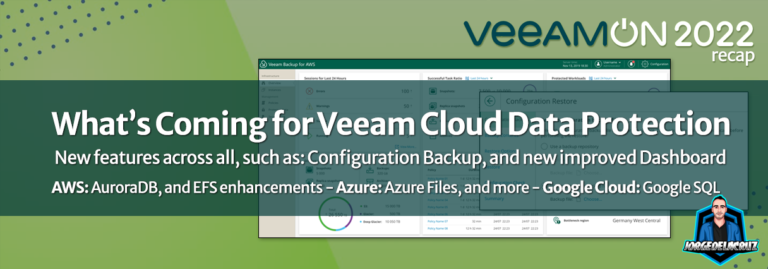
Greetings friends, I continue with the news of VeeamON, I have to view a lot of content on the VeeamON website, as many of these developments have not been reflected in any written document, but if they were announced during the main sessions, or breakout sessions. Today I come to tell you about all the news that we could see regarding the
Veeam: Veeam Announces Veeam ONE v12, improvements in Immutability reporting, VB365 monitoring and much more
Greetings friends, during the week of May 16, 2022, Veeam returned to the live conference, VeeamON 2022 in Las Vegas has been a great event, with lots of on-demand material ready to consume, with sessions for those who attended remotely, and with some live sessions with summaries, and preparing the day that left us a very good taste (these sessions
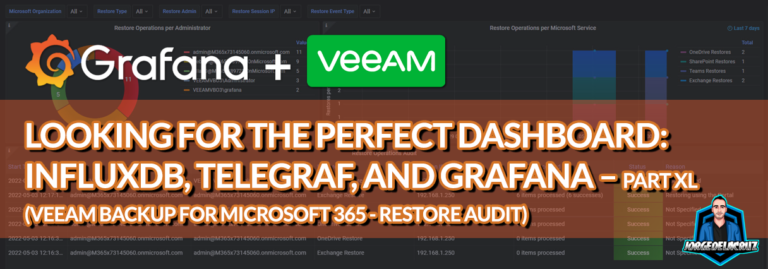
Looking for the Perfect Dashboard: InfluxDB, Telegraf, and Grafana – Part XL (Veeam Backup for Microsoft 365 – Restore Audit)
Greetings friends, before we jump into the blog post, I want to personally thank you for being here with me along with these 40 Blog Post series! Absolutely insane number of blogs regarding one topic, Observability, so the only thing I hope is that you have been enjoying them as much as I enjoyed writing them. In the previous blog post, I wrote
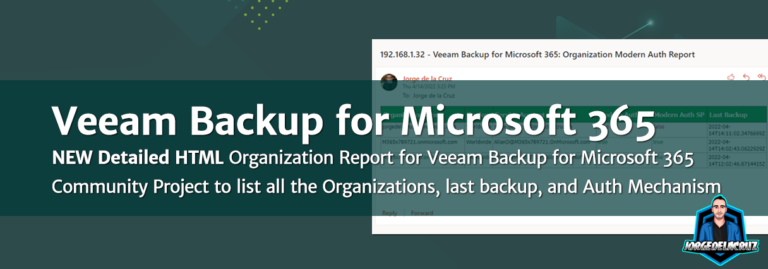
Veeam: Detailed HTML Organization Report for Veeam Backup for Microsoft 365 is now available – Community Project
Greetings friends, I am on a roll with Veeam Backup for Microsoft 365 it seems, just take a look at the latest Blog Posts in case you missed them: Veeam: How to restrict the login to certain users to the Restore Portal from Veeam Backup for Microsoft 365 v6 Veeam: How to add new URLs to be able to log in on the new Restore Portal from Veeam
Veeam: How to restrict the login to certain users to the Restore Portal from Veeam Backup for Microsoft 365 v6
Greetings friends, what a Blog series we are seeing regarding the new Veeam Restore Portal that Veeam Backup for Microsoft 365 v6 brings. I think I have covered plenty of different topics, pretty much all of them regarding day-to-day operations. If you have missed some of those, please find the full list here: Veeam: How to add new URLs to be


