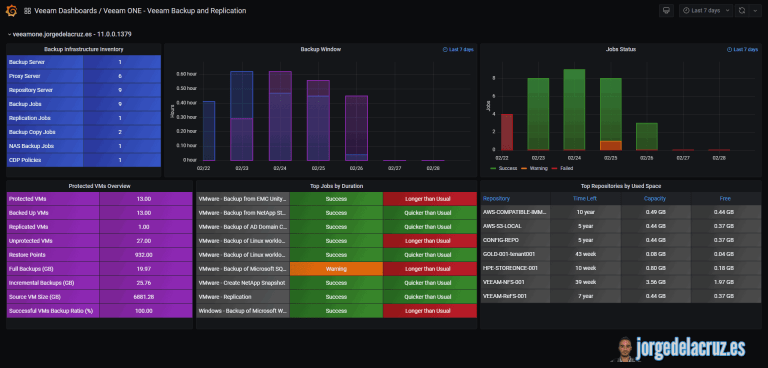
Greetings, friends! The excitement in the data protection community has been brewing, and for a very good reason. After being inundated with inquiries, it's finally time to lift the veil on the next big thing in the Grafana blog series – a freshly minted Grafana Dashboard for Veeam Backup & Replication, now leveraging the power of the novel VBR
veeam dashboard
Veeam: API Reference Maps, a visual representation of Veeam’s feature-rich APIs
Greetings friends, for years I have been exploring Veeam APIs. I always used Veeam's official Helpcenter Reference APIs, and of course the swagger on the products whenever available. I have been lucky enough to build all sort of things using Veeam APIs, like for example: All the Veeam Grafana Dashboards for every single product -
Looking for the Perfect Dashboard: InfluxDB, Telegraf, and Grafana – Part XXXII (Monitoring Veeam ONE – experimental)
Greetings friends, today I bring you a new post about Grafana, today's post is also one of the most special that I have written, since it is an experimental version, and we do not know if this will come to some port, or will be changed in the future. I am talking about nothing more and nothing less than a Grafana Dashboard for Veeam ONE! Yes,


