• Skip to main content
  • Skip to secondary menu
  • Skip to primary sidebar
The Blog of Jorge de la Cruz

The Blog of Jorge de la Cruz

Everything about VMware, Veeam, InfluxData, Grafana, Zimbra, etc.

  • Home
  • VMWARE
  • VEEAM
    • Veeam Content Recap 2021
    • Veeam v11a
      • Veeam Backup and Replication v11a
    • Veeam Backup for AWS
      • Veeam Backup for AWS v4
    • Veeam Backup for Azure
      • Veeam Backup for Azure v3
    • VeeamON 2021
      • Veeam Announces Support for Red Hat Enterprise Virtualization (RHEV/KVM)
      • Veeam announces enhancements for new versions of Veeam Backup for AWS v4/Azure v3/GVP v2
      • VBO v6 – Self-Service Portal and Native Integration with Azure Archive and AWS S3 Glacier
  • Grafana
    • Part I (Installing InfluxDB, Telegraf and Grafana on Ubuntu 20.04 LTS)
    • Part VIII (Monitoring Veeam using Veeam Enterprise Manager)
    • Part XII (Native Telegraf Plugin for vSphere)
    • Part XIII – Veeam Backup for Microsoft Office 365 v4
    • Part XIV – Veeam Availability Console
    • Part XV – IPMI Monitoring of our ESXi Hosts
    • Part XVI – Performance and Advanced Security of Veeam Backup for Microsoft Office 365
    • Part XVII – Showing Dashboards on Two Monitors Using Raspberry Pi 4
    • Part XIX (Monitoring Veeam with Enterprise Manager) Shell Script
    • Part XXII (Monitoring Cloudflare, include beautiful Maps)
    • Part XXIII (Monitoring WordPress with Jetpack RESTful API)
    • Part XXIV (Monitoring Veeam Backup for Microsoft Azure)
    • Part XXV (Monitoring Power Consumption)
    • Part XXVI (Monitoring Veeam Backup for Nutanix)
    • Part XXVII (Monitoring ReFS and XFS (block-cloning and reflink)
    • Part XXVIII (Monitoring HPE StoreOnce)
    • Part XXIX (Monitoring Pi-hole)
    • Part XXXI (Monitoring Unifi Protect)
    • Part XXXII (Monitoring Veeam ONE – experimental)
    • Part XXXIII (Monitoring NetApp ONTAP)
    • Part XXXIV (Monitoring Runecast)
  • Nutanix
  • ZIMBRA
  • PRTG
  • LINUX
  • MICROSOFT

veeam grafana

Looking for the Perfect Dashboard: InfluxDB, Telegraf, and Grafana – Part XLIV (Monitoring Veeam Backup & Replication API)

31st May 2023 - Written in: veeam

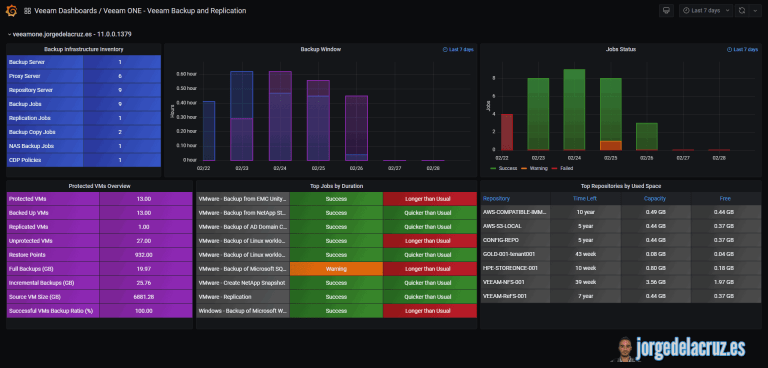
Greetings, friends! The excitement in the data protection community has been brewing, and for a very good reason. After being inundated with inquiries, it's finally time to lift the veil on the next big thing in the Grafana blog series – a freshly minted Grafana Dashboard for Veeam Backup & Replication, now leveraging the power of the novel VBR

Continue Reading

Looking for the Perfect Dashboard: InfluxDB, Telegraf, and Grafana – Part XLII (Veeam ONE v12 Audit Events)

16th February 2023 - Written in: opensource

Greetings friends, Veeam ONE v12 has been launched, there are tons of improvements which we will cover on this blog shortly. But before I jump into native great features, I wanted to show you the art of the possible once again. Veeam ONE v12 comes with a new Audit funcionality that stores in the Windows Events Logs absolutely everything that

Continue Reading

Looking for the Perfect Dashboard: InfluxDB, Telegraf, and Grafana – Part XLI (Veeam Backup for Salesforce)

2nd November 2022 - Written in: opensource, veeam

Greetings friends, another fabolous Veeam release, I am talking about Veeam Backup for Salesforce, and another Dashboard for your Grafana. This blog entry is a bit particular, as I am using the internal APIs the product uses for the Web Interface, and this is unsupported, so please be aware, no tickets to Veeam whatsoever until an official Swagger

Continue Reading

Looking for the Perfect Dashboard: InfluxDB, Telegraf, and Grafana – Part XXXIX (Veeam Restore Portal Users Login Audit)

29th March 2022 - Written in: veeam

Greetings friends, Veeam Backup for Microsoft 365 has been with us for a few weeks already. And within this great product, comes a lot of new ideas and possible functionalities, integrations, etc. Speaking with Mike Resseler, Senior Director of Product Management, who owns VB365 and many other initiatives, we had the idea to enhance a bit the

Continue Reading

Looking for the Perfect Dashboard: InfluxDB, Telegraf, and Grafana – Part XXXII (Monitoring Veeam ONE – experimental)

1st March 2021 - Written in: opensource, veeam

Greetings friends, today I bring you a new post about Grafana, today's post is also one of the most special that I have written, since it is an experimental version, and we do not know if this will come to some port, or will be changed in the future. I am talking about nothing more and nothing less than a Grafana Dashboard for Veeam ONE! Yes,

Continue Reading

  • Page 1
  • Page 2
  • Page 3
  • Go to Next Page »

Primary Sidebar

  • E-mail
  • GitHub
  • LinkedIn
  • RSS
  • Twitter
  • YouTube

Posts Calendar

May 2025
M T W T F S S
 1234
567891011
12131415161718
19202122232425
262728293031  
« Mar    

Disclaimer

All opinions expressed on this site are my own and do not represent the opinions of any company I have worked with, am working with, or will be working with.

Copyright © 2025 · The Blog of Jorge de la Cruz