
 Greetings friends, I come to the sixteenth post on InfluxDB, Telegraf and Grafana, you can find all the posts on InfluxDB, Telegraf and Grafana here. Today I bring you a new entry, in this case it is a Dashboard focused on advanced security when we use Veeam Backup for Microsoft Office 365.
Veeam Backup for Microsoft Office 365 is in charge of protecting our elements in Office 365, be it all the mailboxes we have in Exchange Online, or SharePoint Online and even OneDrive for Business, I also leave you the entire category on this product (remember that there is a Community Edition with up to 10 free users, without paying anything).
Veeam Backup for Microsoft Office 365 Dashboard
At the end of the entry you will have something similar to that Dashboard that will allow you to visualize:
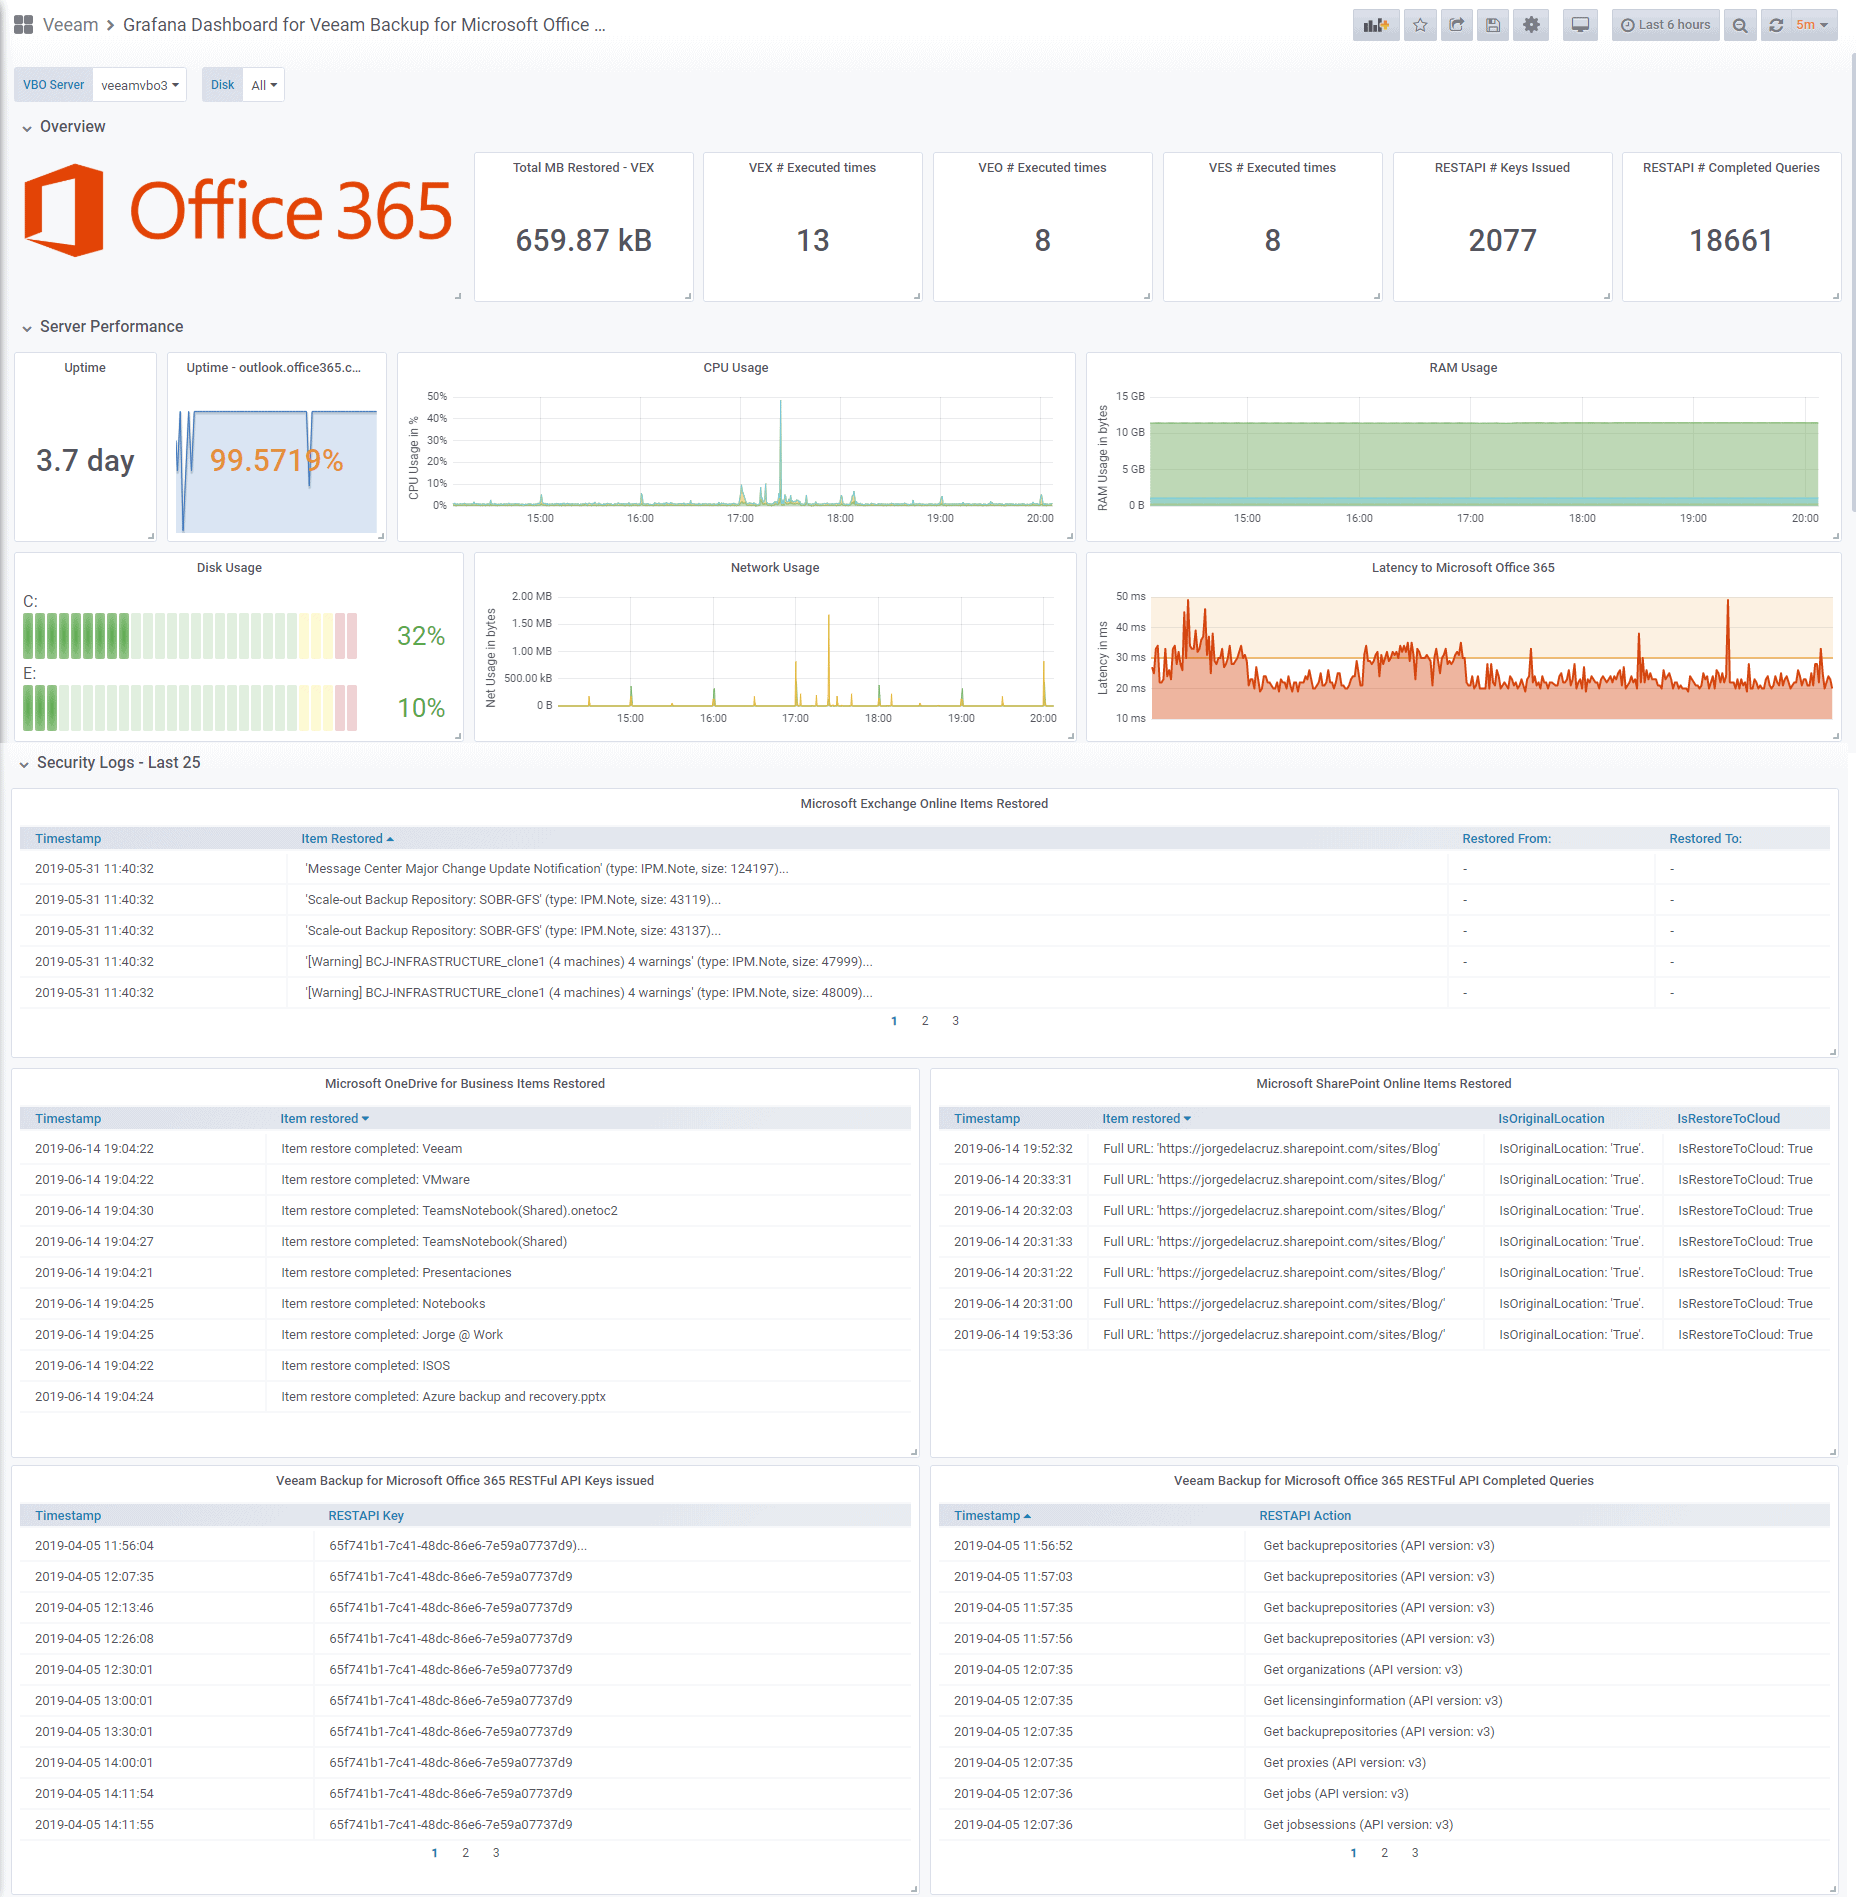
General Description Section
- Total MB restored with Veeam Explorer for Exchange
- Number of times Veeam Explorer for Exchange has been opened
- Number of times Veeam Explorer for OneDrive for Business has been opened
- Number of times Veeam Explorer for SharePoint Online has been opened
- Number of RESTFulAPI keys that have been created or updated
- Number of completed RESTFulAPI queries
Server Performance Section
- VBO servers uptime
- Uptime, connectivity, to outlook.office365.com from VBO servers
- CPU usage of VBO servers
- RAM usage of VBO servers
- VBO Server Disk Usage
- Network use of VBO servers
- Latency in ms to outlook.office365.com from VBO servers
Security Logs
- Items restored using Veeam Explorer for Exchange Online, from which user to which user
- Items restored using Veeam Explorer for OneDrive for Enterprise, item name only
- Items restored using Veeam Explorer for SharePoint Online, URL for now and whether it was restored to Original Location or restored to Cloud
Topology with all logic components
This entry is a little different from the previous ones, since in this case we will use telegraf for Microsoft Windows to collect logs and metrics from the Veeam Backup for Microsoft Office 365 servers. The design would be something similar to this: As we can see, the telegraf agent will collect all the logs, the parseara, as well as the counters with metrics, and sends them to InfluxDB, from where we can view them comfortably with Grafana.
Download and install as telegraf service for Microsoft Windows
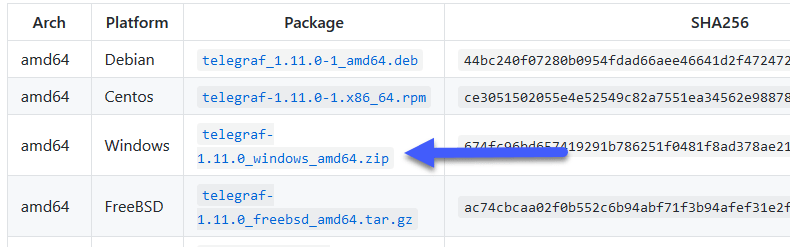
Although I told you the steps a few years ago, let’s see the updated steps, the first thing will be to download the latest version of Telegraf for Windows from GitHub:
 Create a folder in C:/Program Files/Telegraf and extract the files inside:
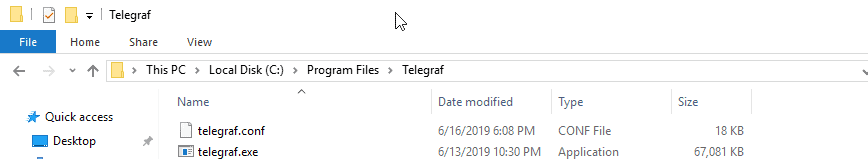
From a PowerShell or CMD console, as administrator, we will launch the following:
C:\"Program Files "Telegraf\telegraf.exe --service install
And already with this we would have telegraf installed, to start it, we could launch it testing the config with the following command:
C:Program Files "Telegraph.exe --config C:Program Files "Telegraph.conf --test
Or a simple one:
net start telegraf
Since we have everything ready, let’s go to the next step to see what we need to add to the configuration file.
Configuration of telegraf.conf for Veeam Backup for Microsoft Office 365
The telegraf configuration file is quite dense, the first thing we will have to edit as always is the output, where we will have to configure the path of the InfluxDB where we are sending data, in my case:
[[outputs.influxdb]]
urls = ["http://192.168.1.3:8086"]
database = "telegraf"
username = "myuser"
password = "mypass"
In addition to this basic, this is the recommended configuration to be able to parse the necessary logs of Veeam Backup for Microsoft Office 365, apart from the ping input:
# # Read and parse Logs from Veeam Explorer for Exchange Online
# Operator who opened the VEX
[[inputs.logparser]]
  files = ["C:/ProgramData/Veeam/Backup/ExchangeExplorer/Logs/*.log"]
  from_beginning = true
  name_override = "veeam_office365_audit_vex"
  watch_method = "poll"

[inputs.logparser.grok]
patterns = ['%{DATESTAMP_AMPM:timestamp:ts-"1/2/2006 3:04:05 PM"} %{SPACE} %{NUMBER} \(%{NUMBER}\) Account:%{GREEDYDATA:operator}']
custom_patterns = "DATESTAMP_AMPM %{DATESTAMP} (AM|PM)"

# Items to restore
[[inputs.logparser]]
  files = ["C:/ProgramData/Veeam/Backup/ExchangeExplorer/Logs/*.log"]
  from_beginning = true
  name_override = "veeam_office365_audit_vex"
  watch_method = "poll"

[inputs.logparser.grok]
patterns = ['%{DATESTAMP_AMPM:timestamp:ts-"1/2/2006 3:04:05 PM"} %{SPACE} %{NUMBER} \(%{NUMBER}\) Restoring message:%{GREEDYDATA:exchangeobject}']
custom_patterns = "DATESTAMP_AMPM %{DATESTAMP} (AM|PM)"

# Restore From:
[[inputs.logparser]]
  files = ["C:/ProgramData/Veeam/Backup/ExchangeExplorer/Logs/*.log"]
  from_beginning = true
  name_override = "veeam_office365_audit_vex"
  watch_method = "poll"

[inputs.logparser.grok]
patterns = ['%{DATESTAMP_AMPM:timestamp:ts-"1/2/2006 3:04:05 PM"} %{SPACE} %{NUMBER} \(%{NUMBER}\) %{SPACE} From:%{GREEDYDATA:restorefrom}']
custom_patterns = "DATESTAMP_AMPM %{DATESTAMP} (AM|PM)"

# Restore To:
[[inputs.logparser]]
  files = ["C:/ProgramData/Veeam/Backup/ExchangeExplorer/Logs/*.log"]
  from_beginning = true
  name_override = "veeam_office365_audit_vex"
  watch_method = "poll"

[inputs.logparser.grok]
patterns = ['%{DATESTAMP_AMPM:timestamp:ts-"1/2/2006 3:04:05 PM"} %{SPACE} %{NUMBER} \(%{NUMBER}\) %{SPACE} To:%{GREEDYDATA:restoreto}']
custom_patterns = "DATESTAMP_AMPM %{DATESTAMP} (AM|PM)"

# Bytes Restored
[[inputs.logparser]]
  files = ["C:/ProgramData/Veeam/Backup/ExchangeExplorer/Logs/*.log"]
  from_beginning = true
  name_override = "veeam_office365_audit_vex"
  watch_method = "poll"

[inputs.logparser.grok]
patterns = ['%{DATESTAMP_AMPM:timestamp:ts-"1/2/2006 3:04:05 PM"} %{SPACE} %{NUMBER} \(%{NUMBER}\) Creating %{GREEDYDATA} %{NUMBER:bytesrestored:int}']
custom_patterns = "DATESTAMP_AMPM %{DATESTAMP} (AM|PM)"

# # Read and parse Logs from Veeam Backup for Microsoft Office 365 RESTFulAPI
# REST KEY ID
[[inputs.logparser]]
  files = ["C:/ProgramData/Veeam/Backup365/Logs/Veeam.Archiver.REST*.log"]
  from_beginning = true
  name_override = "veeam_office365_audit_rest"
  watch_method = "poll"

[inputs.logparser.grok]
patterns = ['%{DATESTAMP_AMPM:timestamp:ts-"1/2/2006 3:04:05 PM"} %{SPACE} %{NUMBER} \(%{NUMBER}\) Adding new backup server session%{GREEDYDATA} %{GREEDYDATA:restkey}']
custom_patterns = "DATESTAMP_AMPM %{DATESTAMP} (AM|PM)"

# REST REFRESH KEY ID
[[inputs.logparser]]
  files = ["C:/ProgramData/Veeam/Backup365/Logs/Veeam.Archiver.REST*.log"]
  from_beginning = true
  name_override = "veeam_office365_audit_rest"
  watch_method = "poll"

[inputs.logparser.grok]
patterns = ['%{DATESTAMP_AMPM:timestamp:ts-"1/2/2006 3:04:05 PM"} %{SPACE} %{NUMBER} \(%{NUMBER}\) Credentials refreshed%{GREEDYDATA} \(key=%{GREEDYDATA:restkey}\)']
custom_patterns = "DATESTAMP_AMPM %{DATESTAMP} (AM|PM)"

# REST ACTIONS
[[inputs.logparser]]
  files = ["C:/ProgramData/Veeam/Backup365/Logs/Veeam.Archiver.REST*.log"]
  from_beginning = true
  name_override = "veeam_office365_audit_rest"
  watch_method = "poll"

[inputs.logparser.grok]
patterns = ['%{DATESTAMP_AMPM:timestamp:ts-"1/2/2006 3:04:05 PM"} %{SPACE} %{NUMBER} \(%{NUMBER}\) Action started:%{GREEDYDATA:restaction}']
custom_patterns = "DATESTAMP_AMPM %{DATESTAMP} (AM|PM)"

# # Read and parse Logs from Veeam Explorer for OneDrive for Business
# Operator who opened the VXONE
[[inputs.logparser]]
  files = ["C:/ProgramData/Veeam/Backup/OneDriveExplorer/Logs/*.log"]
  from_beginning = true
  name_override = "veeam_office365_audit_vone"
  watch_method = "poll"

[inputs.logparser.grok]
patterns = ['%{DATESTAMP_AMPM:timestamp:ts-"1/2/2006 3:04:05 PM"} %{SPACE} %{NUMBER} \(%{NUMBER}\) Account:%{GREEDYDATA:operator}']
custom_patterns = "DATESTAMP_AMPM %{DATESTAMP} (AM|PM)"

# Global monitoring for VXONE
[[inputs.logparser]]
  files = ["C:/ProgramData/Veeam/Backup/OneDriveExplorer/Logs/*.log"]
  from_beginning = true
  name_override = "veeam_office365_audit_vone"
  watch_method = "poll"

[inputs.logparser.grok]
patterns = ['%{DATESTAMP_AMPM:timestamp:ts-"1/2/2006 3:04:05 PM"} %{SPACE} %{NUMBER} \(%{NUMBER}\) %{GREEDYDATA:message}']
custom_patterns = "DATESTAMP_AMPM %{DATESTAMP} (AM|PM)"

# # Read and parse Logs from Veeam Explorer for SharePoint Online
# Operator who opened the VXSPO
[[inputs.logparser]]
  files = ["C:/ProgramData/Veeam/Backup/SharePointExplorer/Logs/*.log"]
  from_beginning = true
  name_override = "veeam_office365_audit_vspo"
  watch_method = "poll"

[inputs.logparser.grok]
patterns = ['%{DATESTAMP_AMPM:timestamp:ts-"1/2/2006 3:04:05 PM"} %{SPACE} %{NUMBER} \(%{NUMBER}\) Account:%{GREEDYDATA:operator}']
custom_patterns = "DATESTAMP_AMPM %{DATESTAMP} (AM|PM)"

# Global monitoring for VXSPO
[[inputs.logparser]]
  files = ["C:/ProgramData/Veeam/Backup/SharePointExplorer/Logs/*.log"]
  from_beginning = true
  name_override = "veeam_office365_audit_vspo"
  watch_method = "poll"

[inputs.logparser.grok]
patterns = ['%{DATESTAMP_AMPM:timestamp:ts-"1/2/2006 3:04:05 PM"} %{SPACE} %{NUMBER} \(%{NUMBER}\) %{GREEDYDATA:message}']
custom_patterns = "DATESTAMP_AMPM %{DATESTAMP} (AM|PM)"


# # Ping and latency between the Veeam Backup for Microsoft Office 365 Server and Exchange Online on Office 365
# Ping input
[[inputs.ping]]
interval = "60s"
urls = ["outlook.office365.com"]
count = 4
timeout = 2.0
With this file telegraf.conf ready, please edit if you have the logs in another location or something, we can start the service:
net start telegraf
We can do more of the telegraf.log to see if there are any errors.
Note: In case you have very old logs, this will make you see hundreds of thousands of metrics, so I recommend you to increase the maximum output to be able to ingest everything:
## Maximum number of unwritten metrics per output.
metric_buffer_limit = 1000000
We’ve got everything, we’re going to the next step.
Checking that we are ingesting information with Chronograf
The normal thing at this point, if we have done all the steps well, is that we are already sending information compiled by the script to InfluxDB, if we do a search using the wonderful Chronograf, we can check that we have information: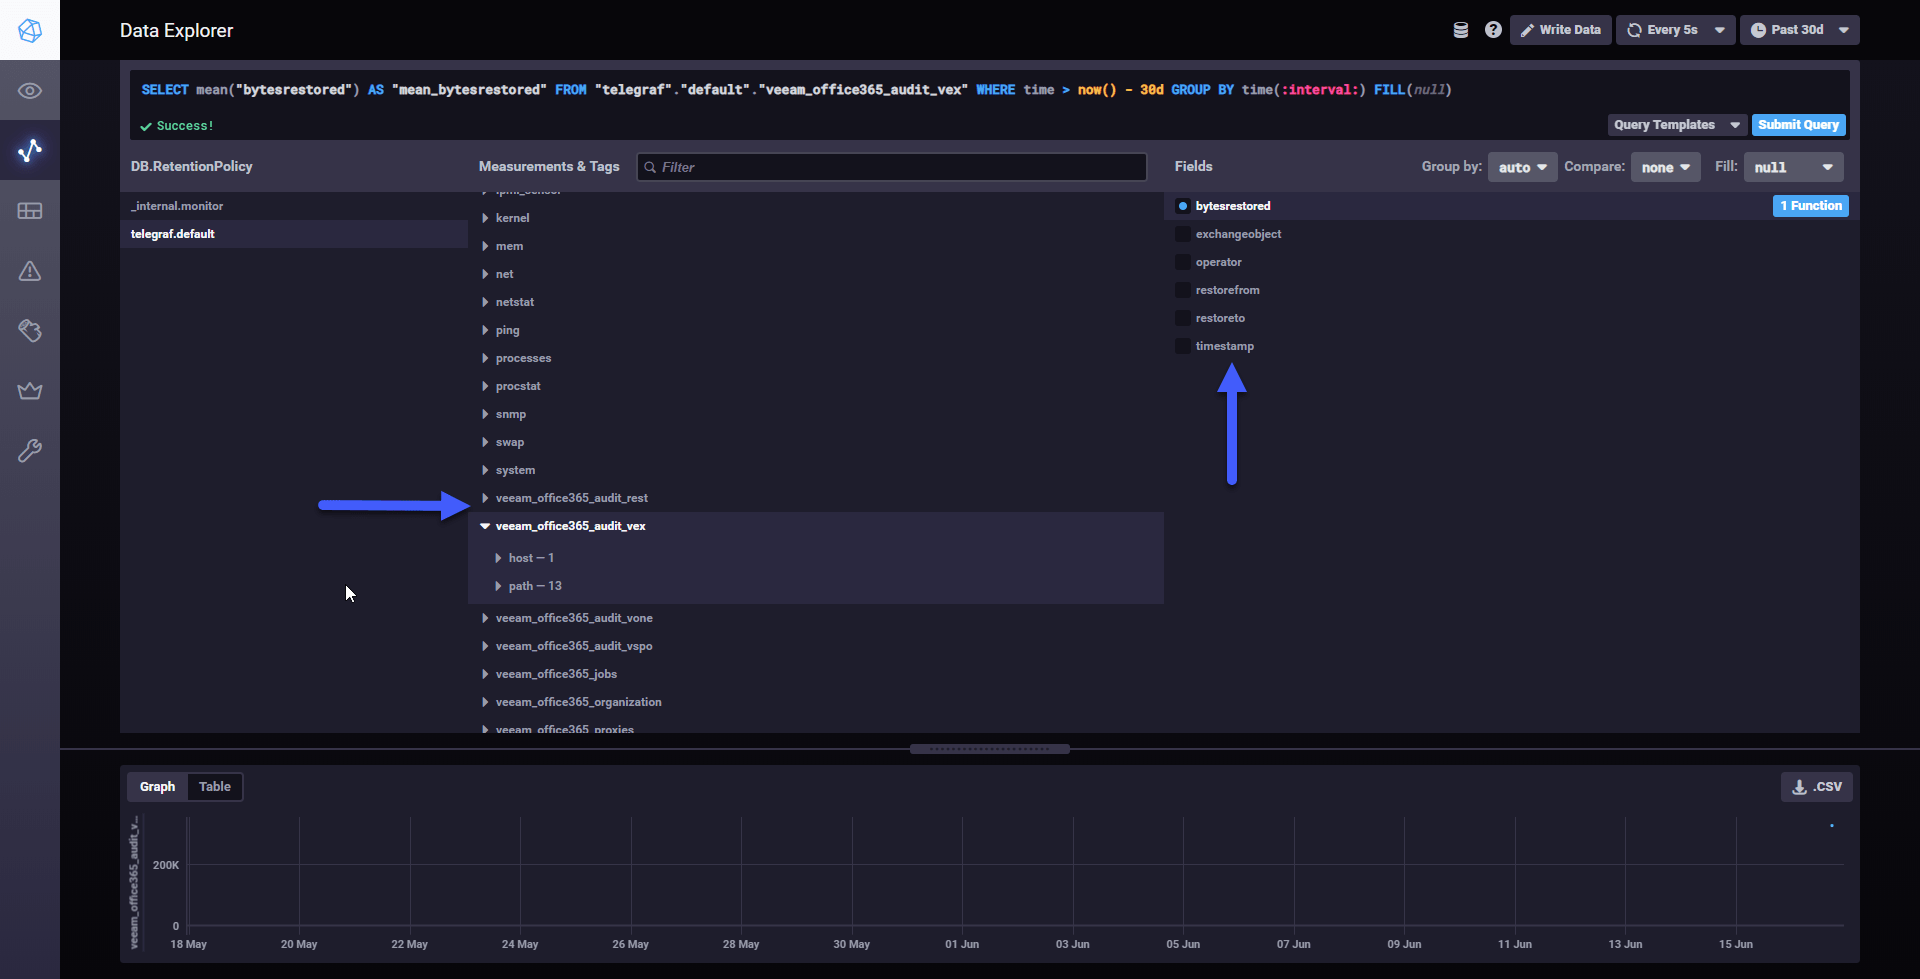 All the variables of this new Veeam script for VBO are stored in veeam_office365_audit_* so it’s really easy to find them.
Grafana Dashboards
I have created a Dashboard from scratch selecting the best requests to the database, finishing off colors, thinking what graphic and how to show it, and everything is automated so that it fits our environment without any problem and without having to edit anything manually. You can find the Dashboard here, once imported, you can use the top dropdown menus to select between organizations, backups, repositories, and proxies:
How to Import the Grafana Dashboards
So that you don’t have to waste hours configuring a new Dashboard, and ingesting and debugging queries, I’ve already created four wonderful Dashboards with everything you need to monitor our environment in a very simple way, you’ll look like the image I showed you above. From our Grafana, we’ll do Create – Import. Select the name you want and enter the ID: 10349, which is the unique ID of the Dashboard, or the URL:
With the menus above you can deploy and adjust the Dashboard to your organization, VBO Server, disks, etc:
Please leave your feedback in the comments, or in GitHub.
I hope you like it, and I would like to leave you the complete series here, so you can start playing with the plugins that I have been telling you about all these years:
- Looking for the Perfect Dashboard: InfluxDB, Telegraf, and Grafana – Part I (Installing InfluxDB, Telegraf, and Grafana on Ubuntu 20.04 LTS)
- En busca del Dashboard perfecto: InfluxDB, Telegraf y Grafana – Parte II (Instalar agente Telegraf en Nodos remotos Linux)
- En busca del Dashboard perfecto: InfluxDB, Telegraf y Grafana – Parte III Integración con PRTG
- En busca del Dashboard perfecto: InfluxDB, Telegraf y Grafana – Parte IV (Instalar agente Telegraf en Nodos remotos Windows)
- En busca del Dashboard perfecto: InfluxDB, Telegraf y Grafana – Parte V (Activar inputs específicos, Red, MySQL/MariaDB, Nginx)
- En busca del Dashboard perfecto: InfluxDB, Telegraf y Grafana – Parte VI (Monitorizando Veeam)
- En busca del Dashboard perfecto: InfluxDB, Telegraf y Grafana – Parte VII (Monitorizar vSphere)
- En busca del Dashboard perfecto: InfluxDB, Telegraf y Grafana – Parte VIII (Monitorizando Veeam con Enterprise Manager)
- En busca del Dashboard perfecto: InfluxDB, Telegraf y Grafana – Parte IX (Monitorizando Zimbra Collaboration)
- En busca del Dashboard perfecto: InfluxDB, Telegraf y Grafana – Parte X (Grafana Plugins)
- En busca del Dashboard perfecto: InfluxDB, Telegraf y Grafana – Parte XI – (Monitorizando URL e IPS con Telegraf y Ping)
- Looking for the Perfect Dashboard: InfluxDB, Telegraf, and Grafana – Part XII (Native Telegraf Plugin for vSphere)
- Looking for the Perfect Dashboard: InfluxDB, Telegraf, and Grafana – Part XIII (Veeam Backup for Microsoft Office 365 v4)
- Looking for the Perfect Dashboard: InfluxDB, Telegraf, and Grafana – Part XIV – Veeam Availability Console
- Looking for the Perfect Dashboard: InfluxDB, Telegraf, and Grafana – Part XV (IPMI Monitoring of our ESXi Hosts)
- Looking for Perfect Dashboard: InfluxDB, Telegraf, and Grafana – Part XVI (Performance and Advanced Security of Veeam Backup for Microsoft Office 365)
- Looking for the Perfect Dashboard: InfluxDB, Telegraf, and Grafana – Part XVII (Showing Dashboards on Two Monitors Using Raspberry Pi 4)
- En busca del Dashboard perfecto: InfluxDB, Telegraf y Grafana – Parte XVIII – Monitorizar temperatura y estado de Raspberry Pi 4
- Looking for the Perfect Dashboard: InfluxDB, Telegraf, and Grafana – Part XIX (Monitoring Veeam with Enterprise Manager) Shell Script
- Looking for the Perfect Dashboard: InfluxDB, Telegraf, and Grafana – Part XXIV (Monitoring Veeam Backup for Microsoft Azure)
- Looking for the Perfect Dashboard: InfluxDB, Telegraf, and Grafana – Part XXV (Monitoring Power Consumption)
- Looking for the Perfect Dashboard: InfluxDB, Telegraf, and Grafana – Part XXVI (Monitoring Veeam Backup for Nutanix)
- Looking for the Perfect Dashboard: InfluxDB, Telegraf, and Grafana – Part XXVII (Monitoring ReFS and XFS (block-cloning and reflink)
- Looking for the Perfect Dashboard: InfluxDB, Telegraf, and Grafana – Part XXVIII (Monitoring HPE StoreOnce)
- Looking for the Perfect Dashboard: InfluxDB, Telegraf, and Grafana – Part XXIX (Monitoring Pi-hole)
- Looking for the Perfect Dashboard: InfluxDB, Telegraf, and Grafana – Part XXIX (Monitoring Veeam Backup for AWS)
- Looking for the Perfect Dashboard: InfluxDB, Telegraf, and Grafana – Part XXXI (Monitoring Unifi Protect)
- Looking for the Perfect Dashboard: InfluxDB, Telegraf, and Grafana – Part XXXII (Monitoring Veeam ONE – experimental)
- Looking for the Perfect Dashboard: InfluxDB, Telegraf, and Grafana – Part XXXIII (Monitoring NetApp ONTAP)
- Looking for the Perfect Dashboard: InfluxDB, Telegraf, and Grafana – Part XXXIV (Monitoring Runecast)
- Looking for the Perfect Dashboard: InfluxDB, Telegraf, and Grafana – Part XXXV (GPU Monitoring)
- Looking for the Perfect Dashboard: InfluxDB, Telegraf, and Grafana – Part XXXVI (Monitoring Goldshell Miners – JSONv2)
- Looking for the Perfect Dashboard: InfluxDB, Telegraf, and Grafana – Part XXXVII (Monitoring Veeam Backup for Google Cloud Platform)
- En Busca del Dashboard perfecto: InfluxDB, Telegraf y Grafana – Parte XXXVIII (Monitorizando Temperatura y Humedad con Xiaomi Mijia)
- Looking for the Perfect Dashboard: InfluxDB, Telegraf, and Grafana – Part XL (Veeam Backup for Microsoft 365 – Restore Audit)
- Looking for the Perfect Dashboard: InfluxDB, Telegraf, and Grafana – Part XLI (Veeam Backup for Salesforce)
- Looking for the Perfect Dashboard: InfluxDB, Telegraf, and Grafana – Part XLII (Veeam ONE v12 Audit Events)
- Looking for the Perfect Dashboard: InfluxDB, Telegraf, and Grafana – Part XLIII (Monitoring QNAP using SNMP v3)
- Looking for the Perfect Dashboard: InfluxDB, Telegraf, and Grafana – Part XLIV (Monitoring Veeam Backup & Replication API)
- Looking for the Perfect Dashboard: InfluxDB, Telegraf, and Grafana – Part XLV (Monitoring Synology using SNMP v3)
- Looking for the Perfect Dashboard: InfluxDB, Telegraf, and Grafana – Part XLVI (Monitoring NVIDIA Jetson Nano)
- Looking for the Perfect Dashboard: InfluxDB, Telegraf, and Grafana – Part XLVII (Monitoring Open WebUI)
- Looking for the Perfect Dashboard: InfluxDB, Telegraf, and Grafana – Part XLVIII (Monitoring Veeam Data Platform Advanced)
- Looking for the Perfect Dashboard: InfluxDB, Telegraf, and Grafana – Part XLIX (Monitoring Unofficial Veeam ONE Node Exporter)
Leave a Reply