 Greetings friends, I have been telling you throughout the series on Grafana many things, from how to monitor Linux, Windows, Veeam, VMware, and also the Server temperature using IPMI.
Today I thought it convenient to show you the step by step to be able to visualize our Dashboards, if we have followed all the series will be already about 16 Dashboards, in a dynamic way and in two monitors using a Raspberry Pi 4 Model B.
Once you have finished the tutorial step by step, you will be able to have something similar to this in your Homelabs, offices:
Raspberry Pi 4 Model B – The ultimate multi-purpose device
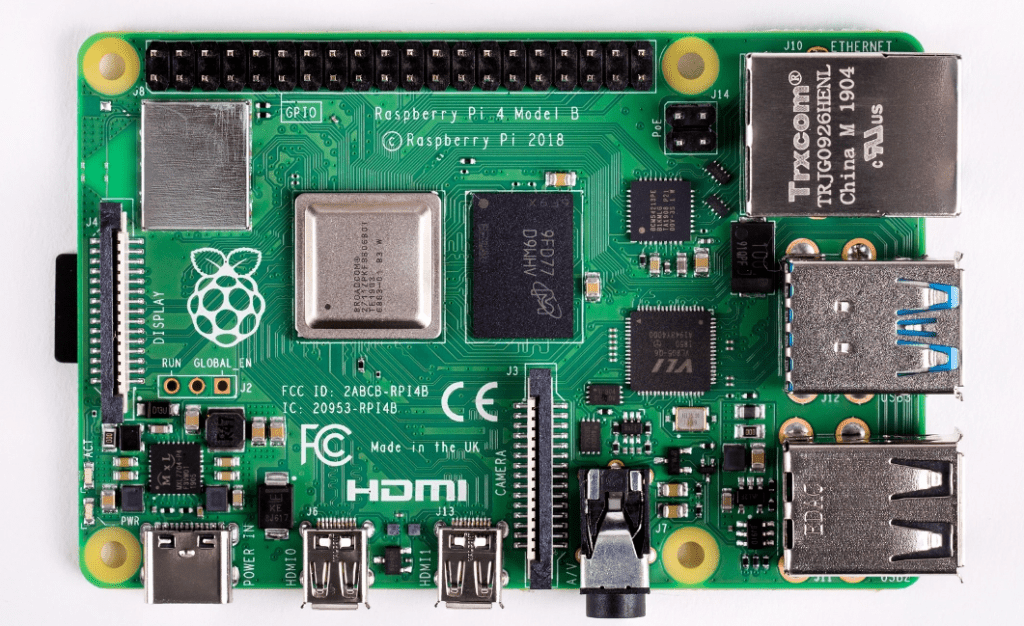
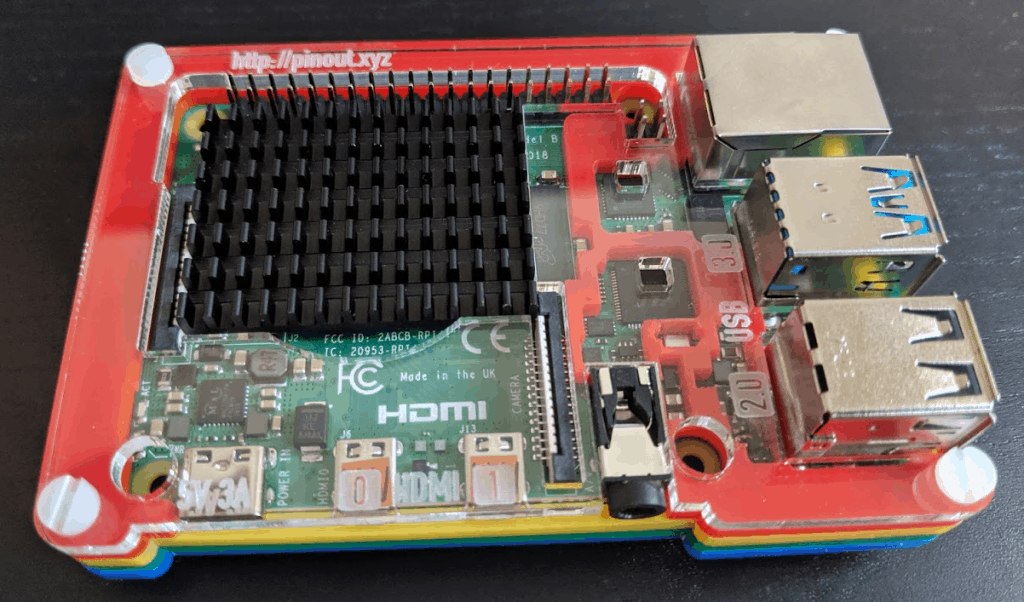
Just a few weeks ago the new Raspberry Pi 4 Model B was released, and as soon as I saw it I knew I had found my better half to monitor, in my case I’m only using it to open a Chromium and show the graphs on two monitors, but with the 4GB model we could perfectly deploy InfluxDB, Telegraf and Grafana and use it as a server.
Technical specifications Raspberry Pi 4 Model B
- SoC: Broadcom BCM2711B0 quad-core A72 (ARMv8-A) 64-bit @ 1.5GHz
- GPU: Broadcom VideoCore VI
- Red: 2.4 GHz and 5 GHz 802.11b/g/n/ac wireless LAN
- RAM: 1GB, 2GB, o 4GB LPDDR4 SDRAM
- Bluetooth: Bluetooth 5.0, Bluetooth Low Energy (BLE)
- GPIO: 40-pin GPIO header, populated
- Storage: microSD
- Ports: 2 × micro-HDMI 2.0, 3.5 mm analogue audio-video jack, 2 × USB 2.0, 2 × USB 3.0, Gigabit Ethernet, Camera Serial Interface (CSI), Display Serial Interface (DSI)
- Dimensions: 88 mm × 58 mm × 19.5 mm, 46 g
Total price of Raspberry Pi 4 bundle
In my case I have acquired a Raspberry Pi 4 Model B of 4GB, in addition to storage, housing and so on, I leave the complete list with the price of each component to have everything ready:
- 1x Raspberry Pi 4 – 4GB RAM – £54
- 1x NOOBS 32GB microSD card (3.1) – £9
- 1x Raspberry Pi 4 Heatsink – £2.40
- 1x Universal USB-C Power Supply – 5.1V 3A – £9
- 1x Pibow Coupé 4 (Raspberry Pi 4 only) – Rainbow – £8.50
- 1x VCE 2-PACK Micro HDMI Male to HDMI Female Converter Adapter – £6.25
This makes a total of £89.15 which in Euros is something like 99.10 Euros. In case you decide to buy this case, which I recommend because it is outdoors and allows you to dissipate the incredible heat this new version produces, I leave you the step by step of how to mount the case:
HP 22w 21.5 inches LED Monitors for the visualization in kiosk mode
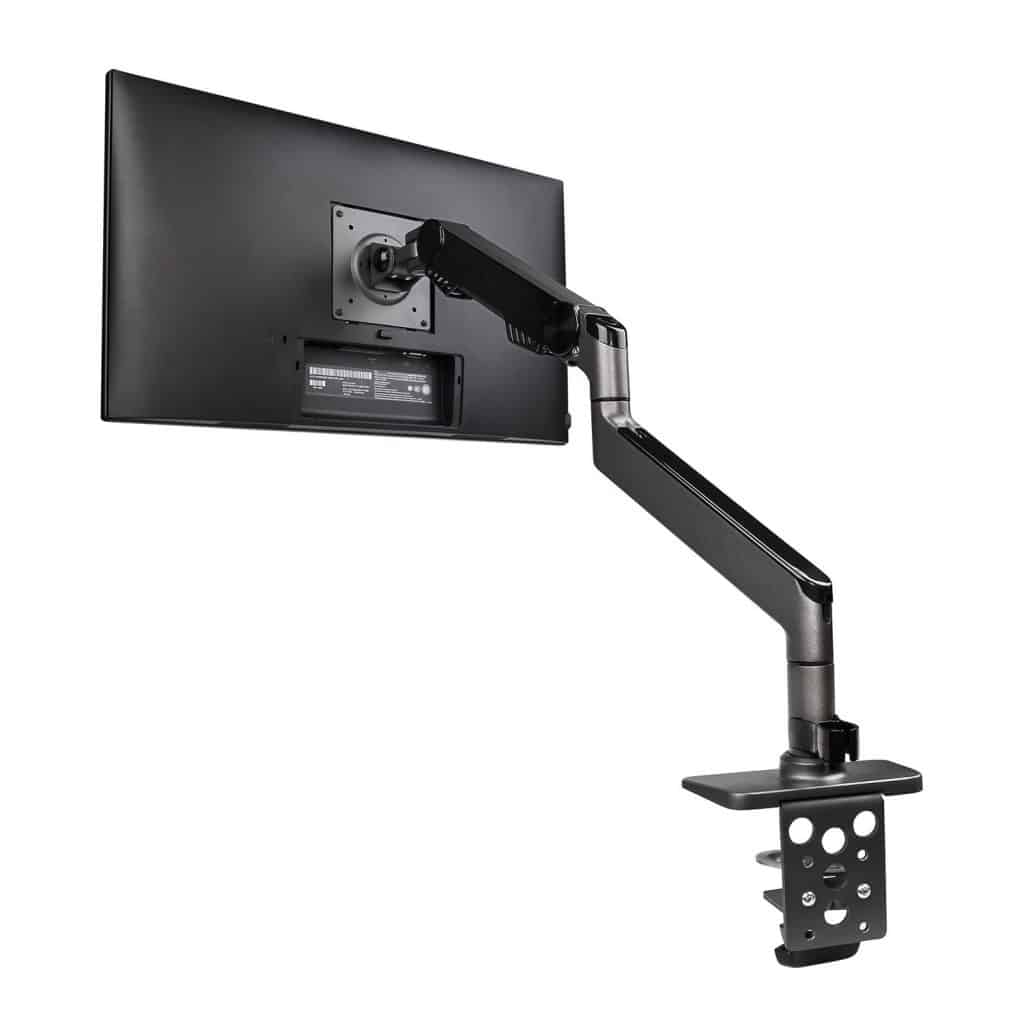
I have chosen these monitors because of their good number of positive reviews, relatively low power consumption, low weight and also know that I have the HP guarantee.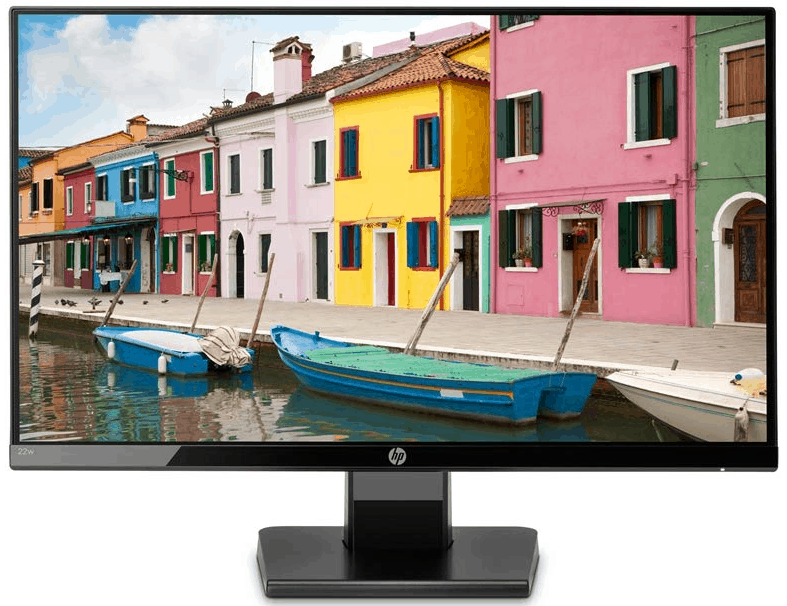 Also to be able to put this monitor on my desk, or on yours, or on the wall, I opted for a hydraulic arm that would allow me to turn the monitor easily, and position them as I wanted, I opted for the model Bestand Monitor Arm Mount-Upgraded Version that looks like this:
Total price of the bundle of two HP monitors and two hydraulic arms for monitor
In my case I have purchased both products in Amazon.co.uk, I leave you the detailed list:
- 2x HP 22w 21.5 inch LED Monitor (1920 x 1080 Pixel Full HD (FHD) 5ms 60hz Refresh Rate HDMI VGA) – Black – £79.99
- 2x Bestand Monitor Arm Mount-Upgraded Version, Vesa Desk Mount Stand for LCD LED Computer Screen up to 27″, (Single Monitor Arm, Grey) – £69.99
This makes a total of £299.96 which in Euros is something like 333.38 Euros.
Configuration of Raspberry Pi 4 Model B as terminal showing Dashboards Grafana
Once we insert the microSD card into our Raspberry Pi 4 Model B, and connect the microHDMI and the power supply will start for the first time the terminal. As it contains the NOOBS distribution, it will boot with Raspbian, a Debian version specially created for Raspberry Pi, as it has 4GB of RAM, and the new processor, we will be able to see the start menu very quickly: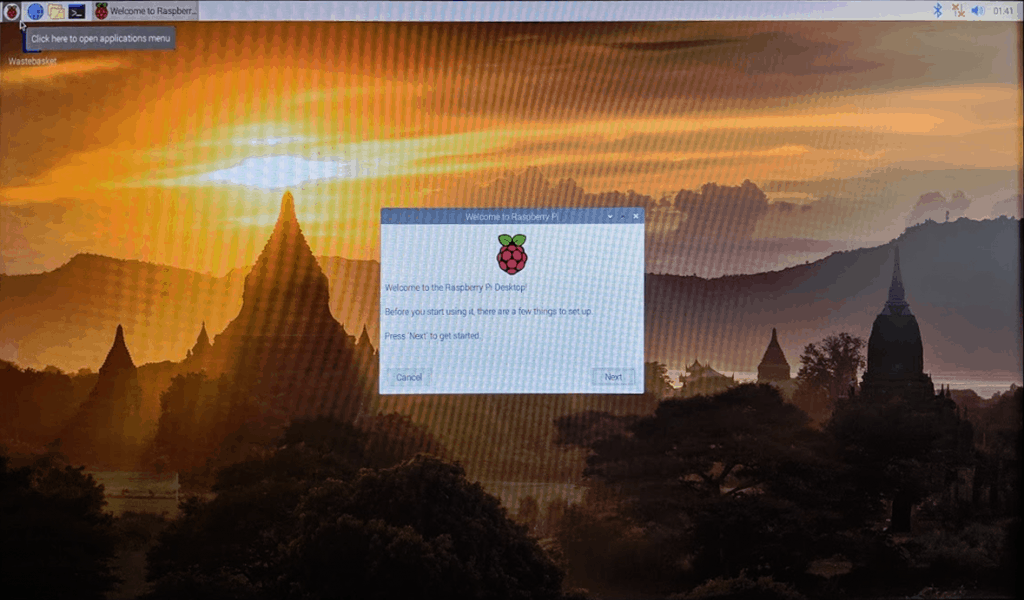 The first thing we’ll have to do is connect the RPi to a Wi-Fi, or if we had a network cable with DHCP, better.
Once we have network connection, the next step is to update the system, for it we will follow these steps, we will make a sudo apt update
sudo apt update
Hit:1 http://archive.raspberrypi.org/debian buster InRelease
Get:2 http://raspbian.raspberrypi.org/raspbian buster InRelease [15.0 kB]
E: Repository 'http://raspbian.raspberrypi.org/raspbian buster InRelease' changed its 'Suite' value from 'testing' to 'stable'
N: This must be accepted explicitly before updates for this repository can be applied. See apt-secure(8) manpage for details.
It will ask us that if we want to change the repository and continue, we will type Y:
Do you want to accept these changes and continue updating from this repository? [y/N] y
This will cause the repositories to be updated with the new routes:
Get:3 http://raspbian.raspberrypi.org/raspbian buster/main armhf Packages [13.0 MB]
Get:4 http://raspbian.raspberrypi.org/raspbian buster/contrib armhf Packages [58.7 kB]
Fetched 13.1 MB in 13s (978 kB/s)
Reading package lists... Done
Building dependency tree
Reading state information... Done
129 packages can be upgraded. Run 'apt list --upgradable' to see them.
Once we are ready, we can make the typical apt-get update and upgrade, so we will ask to restart at the end:
sudo apt-get update && sudo apt-get upgrade
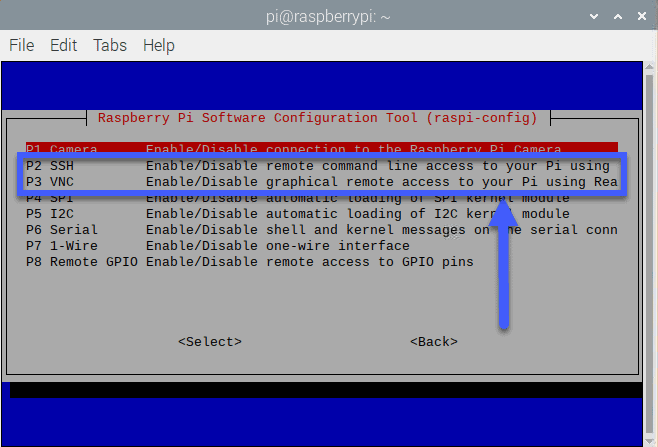
Once we restart, we can launch the RPi configuration menu, to configure the SSH server and the VNC server:
sudo raspi-config
Select Interfacing options from the main menu: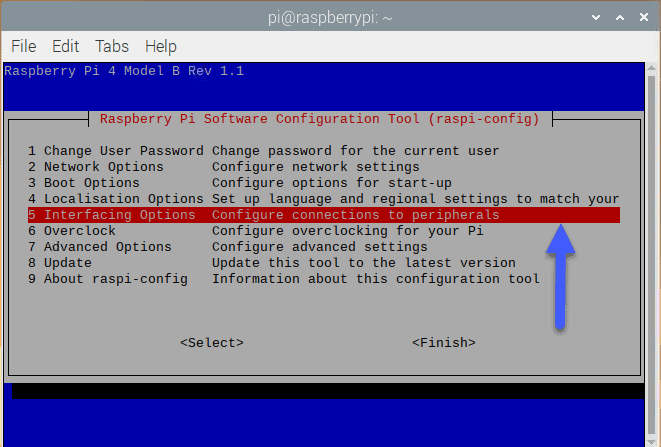 And now we can enable the SSH and VNC server to remotely manage the RPi, recommended:
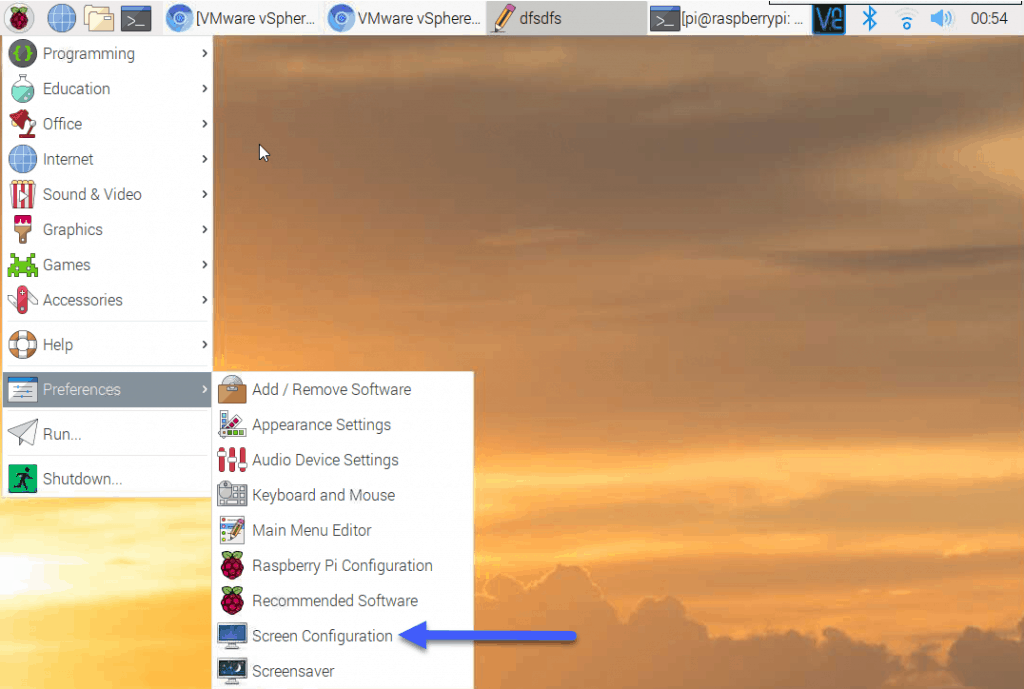
 If we want to rotate the screens so that you can show them vertically, as I showed you in the image at the beginning of the post, we’ll have to go to Preferences – Screen Configuration:
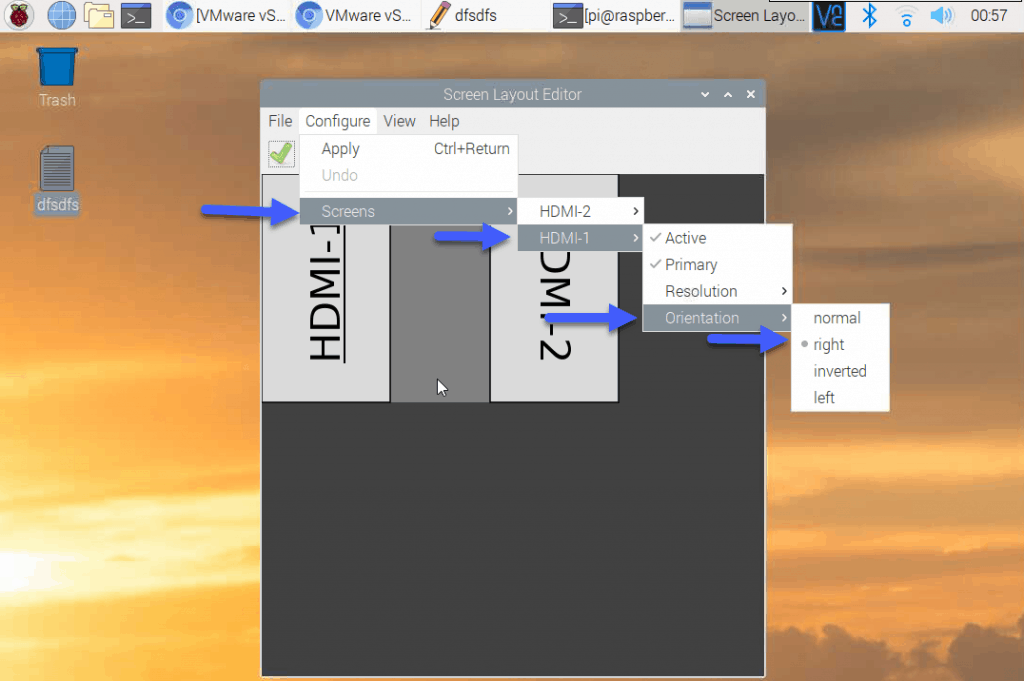
 And we will have to select if we want it to turn right or left, it depends on how we have turned the monitors:
 With this we will only have to open Chromium and go to our interface of Grafana, and select the Dashboards that we like the most, show them as we like also, in full screen, multiple Dashboards in the same screen, rotating, etc. The result has to be something similar to this:
I hope you like it, and I would like to leave you the complete series here, so you can start playing with the plugins that I have been telling you about all these years:
- Looking for the Perfect Dashboard: InfluxDB, Telegraf, and Grafana – Part I (Installing InfluxDB, Telegraf, and Grafana on Ubuntu 20.04 LTS)
- En busca del Dashboard perfecto: InfluxDB, Telegraf y Grafana – Parte II (Instalar agente Telegraf en Nodos remotos Linux)
- En busca del Dashboard perfecto: InfluxDB, Telegraf y Grafana – Parte III Integración con PRTG
- En busca del Dashboard perfecto: InfluxDB, Telegraf y Grafana – Parte IV (Instalar agente Telegraf en Nodos remotos Windows)
- En busca del Dashboard perfecto: InfluxDB, Telegraf y Grafana – Parte V (Activar inputs específicos, Red, MySQL/MariaDB, Nginx)
- En busca del Dashboard perfecto: InfluxDB, Telegraf y Grafana – Parte VI (Monitorizando Veeam)
- En busca del Dashboard perfecto: InfluxDB, Telegraf y Grafana – Parte VII (Monitorizar vSphere)
- En busca del Dashboard perfecto: InfluxDB, Telegraf y Grafana – Parte VIII (Monitorizando Veeam con Enterprise Manager)
- En busca del Dashboard perfecto: InfluxDB, Telegraf y Grafana – Parte IX (Monitorizando Zimbra Collaboration)
- En busca del Dashboard perfecto: InfluxDB, Telegraf y Grafana – Parte X (Grafana Plugins)
- En busca del Dashboard perfecto: InfluxDB, Telegraf y Grafana – Parte XI – (Monitorizando URL e IPS con Telegraf y Ping)
- Looking for the Perfect Dashboard: InfluxDB, Telegraf, and Grafana – Part XII (Native Telegraf Plugin for vSphere)
- Looking for the Perfect Dashboard: InfluxDB, Telegraf, and Grafana – Part XIII (Veeam Backup for Microsoft Office 365 v4)
- Looking for the Perfect Dashboard: InfluxDB, Telegraf, and Grafana – Part XIV – Veeam Availability Console
- Looking for the Perfect Dashboard: InfluxDB, Telegraf, and Grafana – Part XV (IPMI Monitoring of our ESXi Hosts)
- Looking for Perfect Dashboard: InfluxDB, Telegraf, and Grafana – Part XVI (Performance and Advanced Security of Veeam Backup for Microsoft Office 365)
- Looking for the Perfect Dashboard: InfluxDB, Telegraf, and Grafana – Part XVII (Showing Dashboards on Two Monitors Using Raspberry Pi 4)
- En busca del Dashboard perfecto: InfluxDB, Telegraf y Grafana – Parte XVIII – Monitorizar temperatura y estado de Raspberry Pi 4
- Looking for the Perfect Dashboard: InfluxDB, Telegraf, and Grafana – Part XIX (Monitoring Veeam with Enterprise Manager) Shell Script
- Looking for the Perfect Dashboard: InfluxDB, Telegraf, and Grafana – Part XXIV (Monitoring Veeam Backup for Microsoft Azure)
- Looking for the Perfect Dashboard: InfluxDB, Telegraf, and Grafana – Part XXV (Monitoring Power Consumption)
- Looking for the Perfect Dashboard: InfluxDB, Telegraf, and Grafana – Part XXVI (Monitoring Veeam Backup for Nutanix)
- Looking for the Perfect Dashboard: InfluxDB, Telegraf, and Grafana – Part XXVII (Monitoring ReFS and XFS (block-cloning and reflink)
- Looking for the Perfect Dashboard: InfluxDB, Telegraf, and Grafana – Part XXVIII (Monitoring HPE StoreOnce)
- Looking for the Perfect Dashboard: InfluxDB, Telegraf, and Grafana – Part XXIX (Monitoring Pi-hole)
- Looking for the Perfect Dashboard: InfluxDB, Telegraf, and Grafana – Part XXIX (Monitoring Veeam Backup for AWS)
- Looking for the Perfect Dashboard: InfluxDB, Telegraf, and Grafana – Part XXXI (Monitoring Unifi Protect)
- Looking for the Perfect Dashboard: InfluxDB, Telegraf, and Grafana – Part XXXII (Monitoring Veeam ONE – experimental)
- Looking for the Perfect Dashboard: InfluxDB, Telegraf, and Grafana – Part XXXIII (Monitoring NetApp ONTAP)
- Looking for the Perfect Dashboard: InfluxDB, Telegraf, and Grafana – Part XXXIV (Monitoring Runecast)
- Looking for the Perfect Dashboard: InfluxDB, Telegraf, and Grafana – Part XXXV (GPU Monitoring)
- Looking for the Perfect Dashboard: InfluxDB, Telegraf, and Grafana – Part XXXVI (Monitoring Goldshell Miners – JSONv2)
- Looking for the Perfect Dashboard: InfluxDB, Telegraf, and Grafana – Part XXXVII (Monitoring Veeam Backup for Google Cloud Platform)
- En Busca del Dashboard perfecto: InfluxDB, Telegraf y Grafana – Parte XXXVIII (Monitorizando Temperatura y Humedad con Xiaomi Mijia)
- Looking for the Perfect Dashboard: InfluxDB, Telegraf, and Grafana – Part XL (Veeam Backup for Microsoft 365 – Restore Audit)
- Looking for the Perfect Dashboard: InfluxDB, Telegraf, and Grafana – Part XLI (Veeam Backup for Salesforce)
- Looking for the Perfect Dashboard: InfluxDB, Telegraf, and Grafana – Part XLII (Veeam ONE v12 Audit Events)
- Looking for the Perfect Dashboard: InfluxDB, Telegraf, and Grafana – Part XLIII (Monitoring QNAP using SNMP v3)
- Looking for the Perfect Dashboard: InfluxDB, Telegraf, and Grafana – Part XLIV (Monitoring Veeam Backup & Replication API)
- Looking for the Perfect Dashboard: InfluxDB, Telegraf, and Grafana – Part XLV (Monitoring Synology using SNMP v3)
- Looking for the Perfect Dashboard: InfluxDB, Telegraf, and Grafana – Part XLVI (Monitoring NVIDIA Jetson Nano)
- Looking for the Perfect Dashboard: InfluxDB, Telegraf, and Grafana – Part XLVII (Monitoring Open WebUI)
- Looking for the Perfect Dashboard: InfluxDB, Telegraf, and Grafana – Part XLVIII (Monitoring Veeam Data Platform Advanced)
- Looking for the Perfect Dashboard: InfluxDB, Telegraf, and Grafana – Part XLIX (Monitoring Unofficial Veeam ONE Node Exporter)

Leave a Reply