
 Greetings friends, we continue with the fantastic series on Veeam ONE, where we will see step by step to deploy monitoring, reporting, and capacity planning system. Today we have the most basic, the download and installation of Veeam ONE.
Veeam ONE ISO download
 It should be noted that Veeam is part of Veeam Availability Suite, which is a bundle that includes Veeam Backup & Replication and Veeam ONE, and which is usually much cheaper than buying Veeam ONE separately.
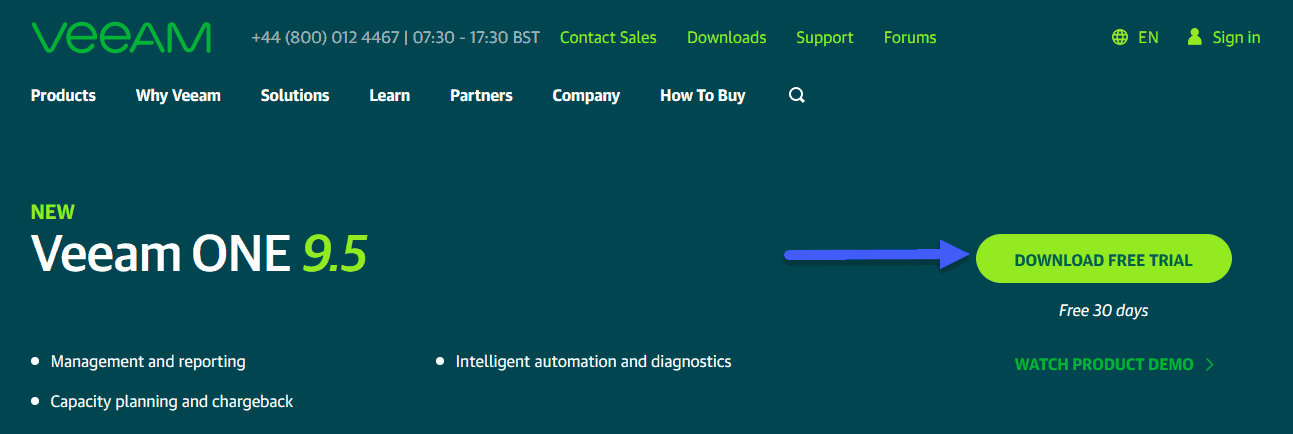
Today we are going to download the ISO of Veeam ONE, to do so, we will go to the official website of Veeam ONE and click on Download Free Trial:
 Once we have the ISO downloaded, we can map it to a new VM to start the installation.
Calculator to know the size of the Veeam ONE database
I already told you in great detail the importance of downloading the size calculator of Veeam ONE before installing it, to know the size of the DB, and assess whether we will need a dedicated SQL, even if it is within the same VM, or we want to use the Express. The calculator looks like this, I leave you the post with all the data: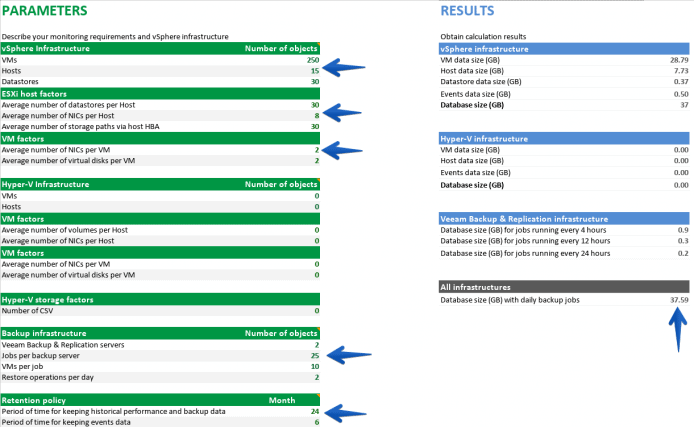
Hardware requirements for Veeam ONE
If we want to install an all-in-one, or what comes to be all the components in a VM, we will have to take into account how many Hosts we are monitoring, I leave you a table: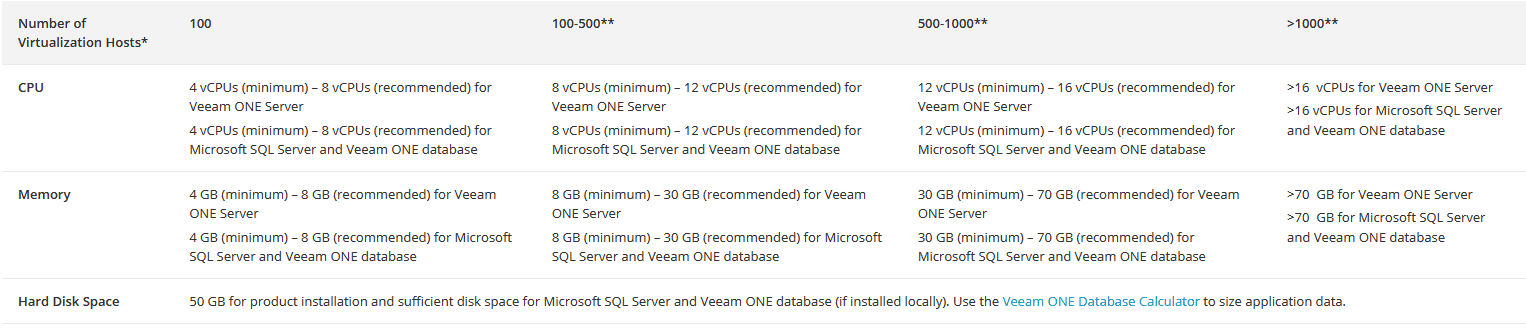 To calculate the disk space, use the calculator that I showed you before.
Installing Veeam ONE with SQL Express
We will start the installation process by mapping the ISO to our VM, either through VMware or by opening the ISO file from the browser: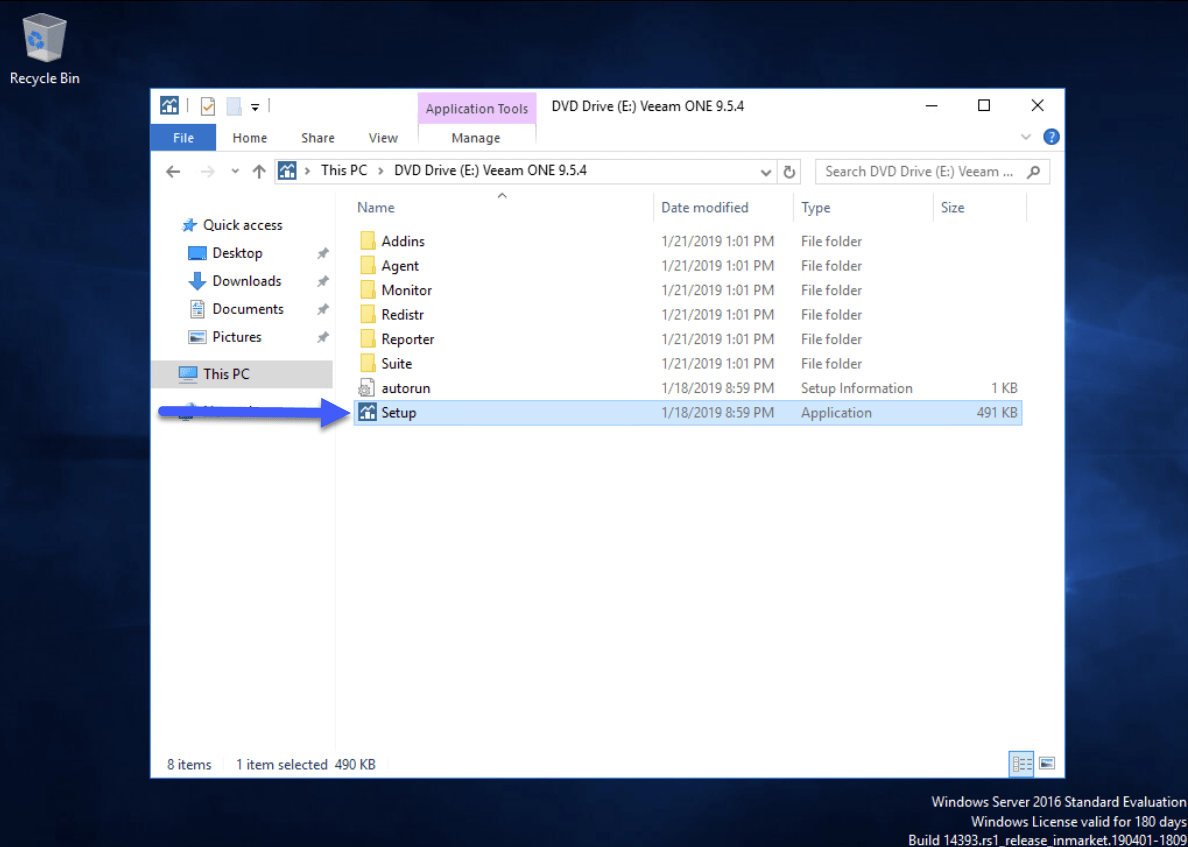 From the installation menu, we will select the big button that will install all the components:
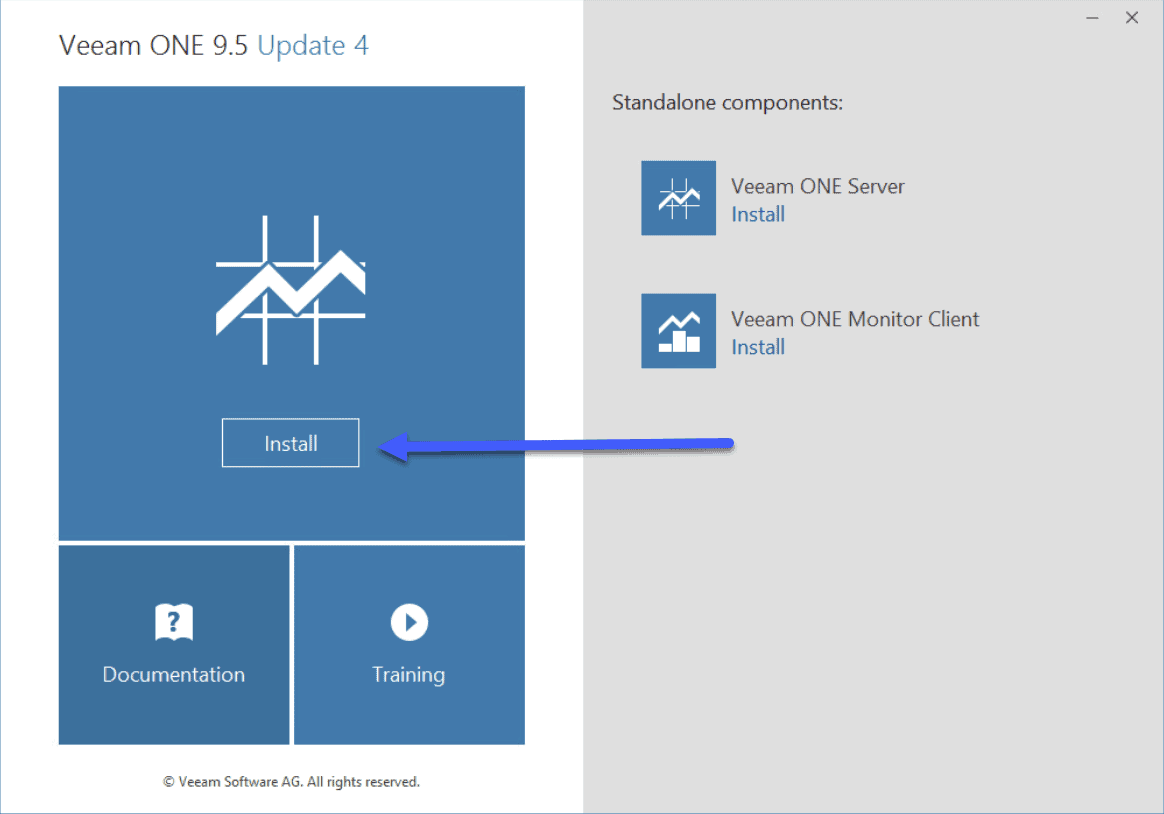 We will accept the EULA after reading it all and if we agree:
 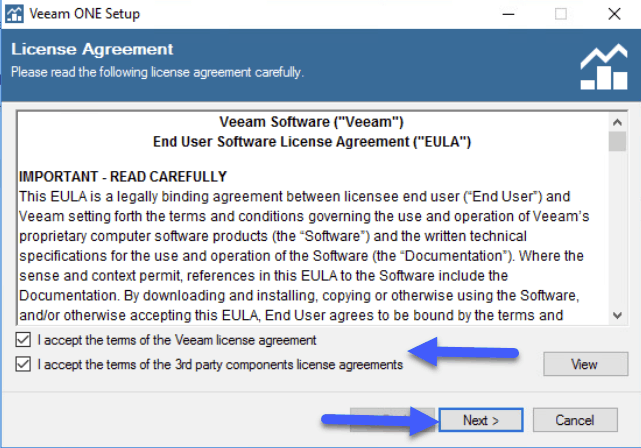 We will have two types of installation, in my case I have selected Typical since I do not want to change anything advanced:
 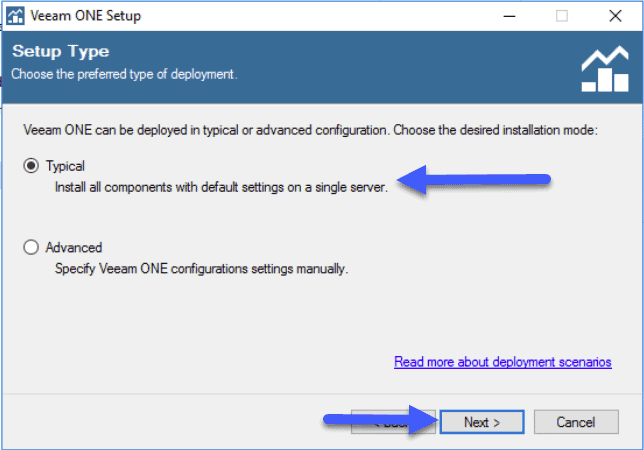 The installation process requires several components that can be activated with a simple Install in the wizard:
 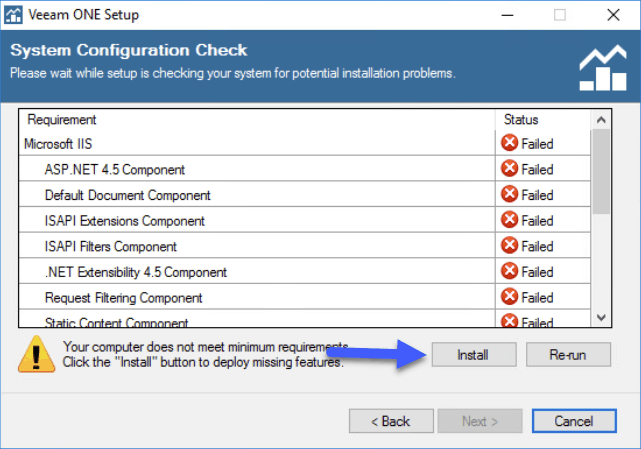 Once we have all the dependencies, we can click on Next:
 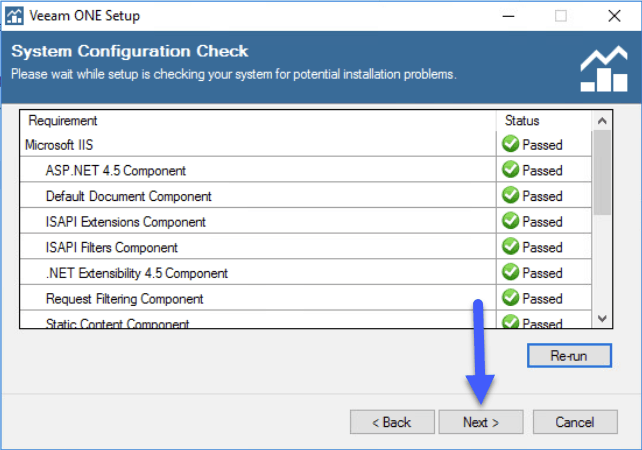 I have installed Veeam ONE in the default folder, since the installation itself will not grow in disk:
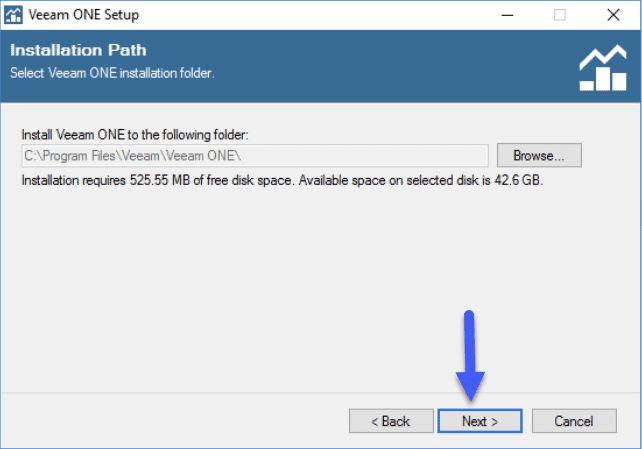 When installing Veeam ONE, we will have to select a system account for the start of the services, in my case, I recommend that monitoring systems normally are not in domain, since this way you will be able to monitor if the DNS and AD is down and so on without problems:
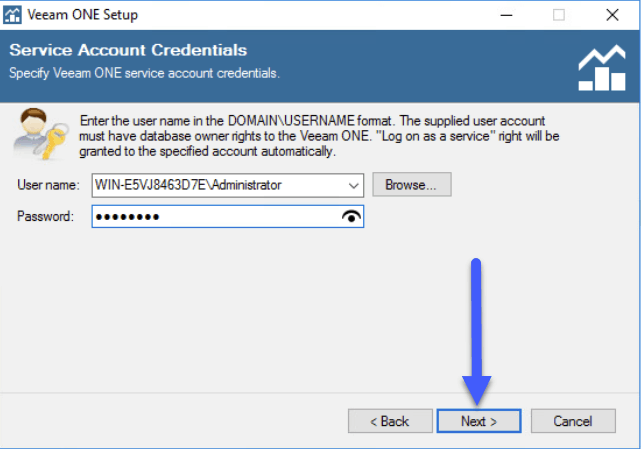 In this step, we can install the SQL Express that Veeam ONE comes with, or select an instance of SQL if we have decided that we have enough ESXi Hosts that we need a dedicated SQL:
 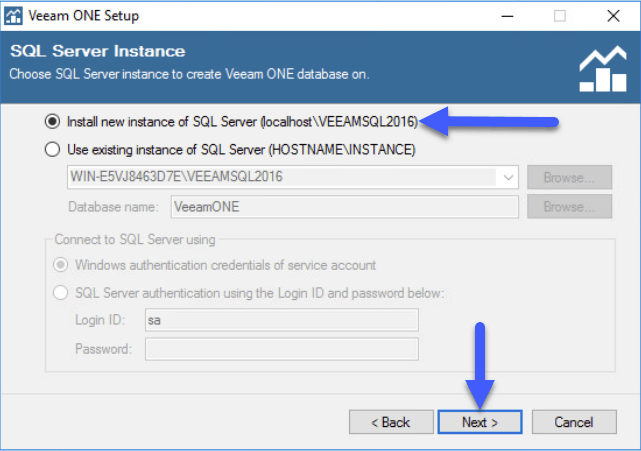 We could use the Community version, which is free with certain limited functionality, or we can apply the trial license that we have downloaded with Veeam ONE:
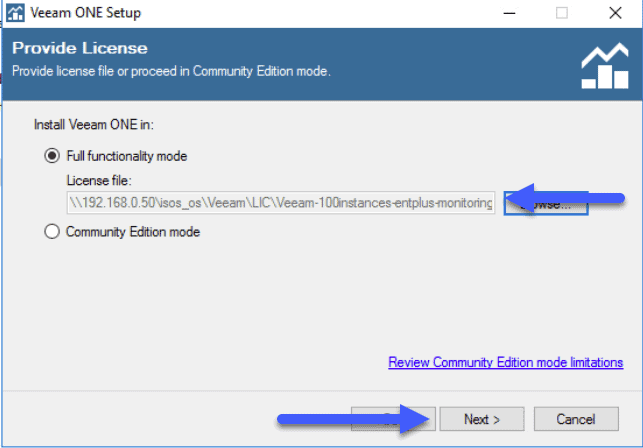 We can also change the ports of Veeam ONE and the SSL certificate that is shown when we browse in Veeam ONE Reporter UI:
 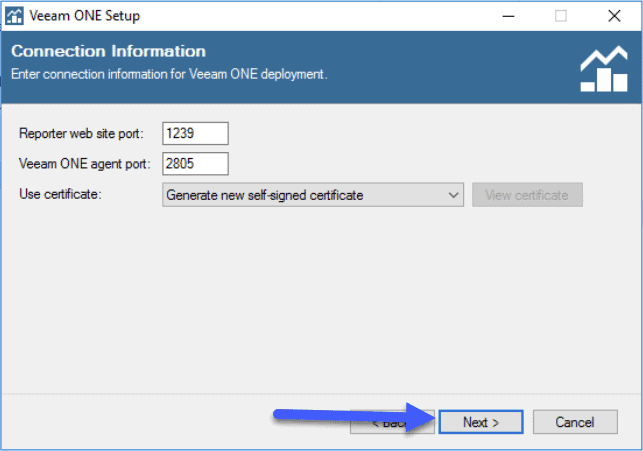 For the performance Data Caching I recommend a fast disk, if it is possible that it is outside C: so that we don’t have disk space problems:
 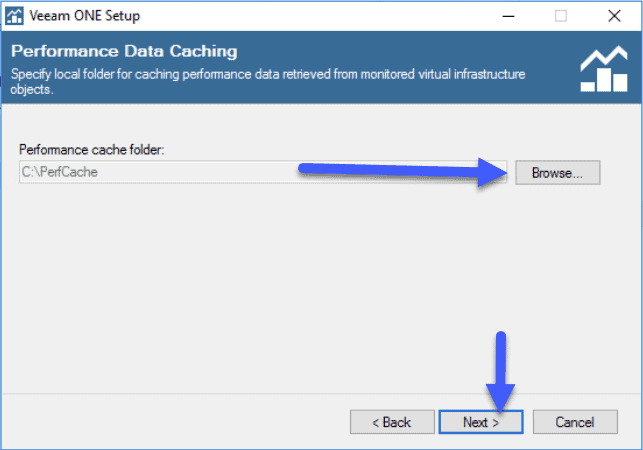 In the wizard we could add a VMware or Hyper-V environment, but in my case I have preferred to skip this step, and do it later in other Blog entries and see it in more detail:
 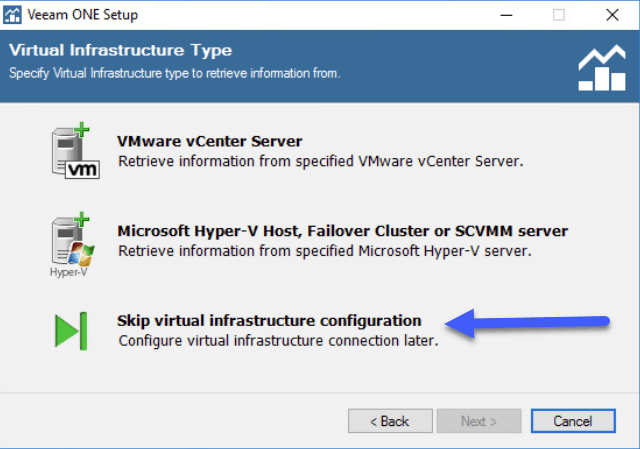 Veeam ONE has three methods to collect information, depending on what we want to monitor, in my case I have selected Optimized for Typical Deployment, since I have less than 100 Hosts and less than 1500 VMs:
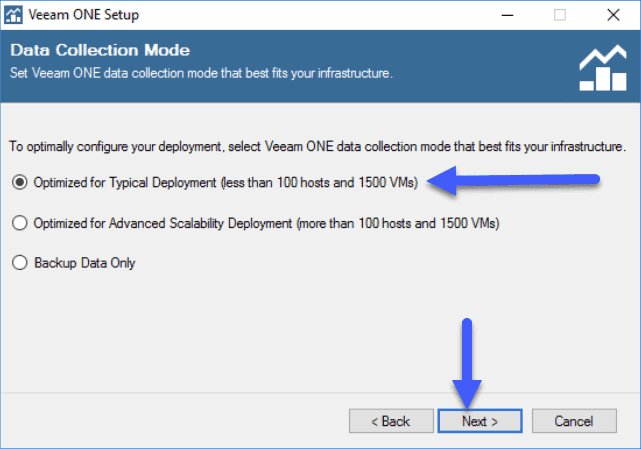 If everything is correct, we will click on Install to start the process:
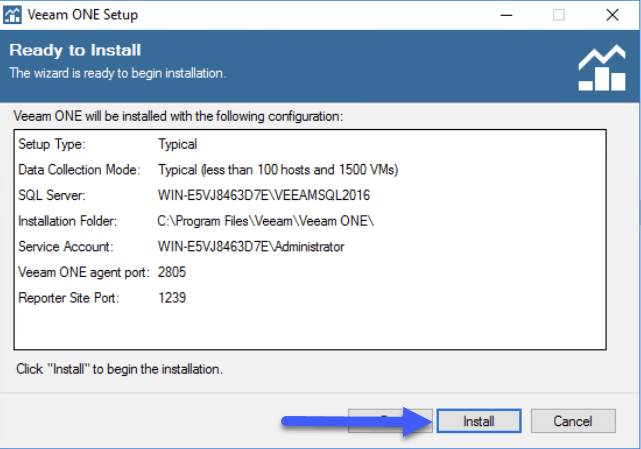 It will start with the installation of SQL Express:
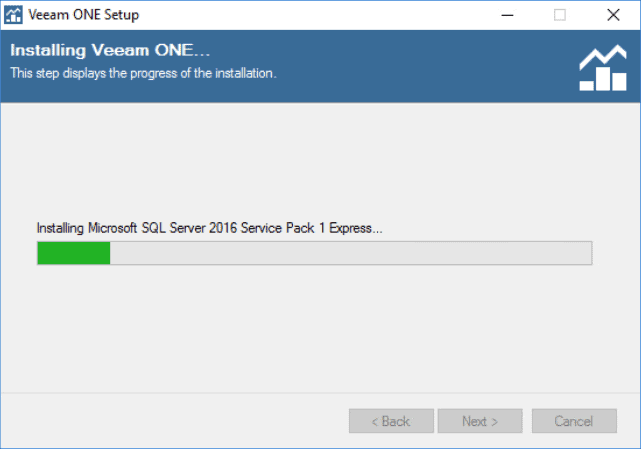 The installation process will take a few minutes, when it finishes we will see the following message:
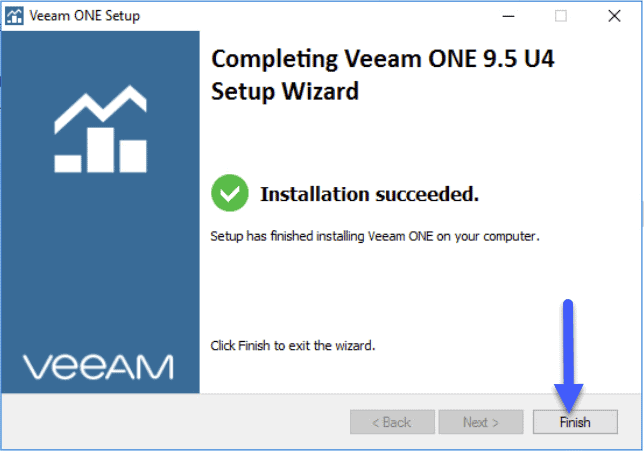 Once we log off and log on, we will be able to see the two icons that we will use depending on the role and position within the IT department:
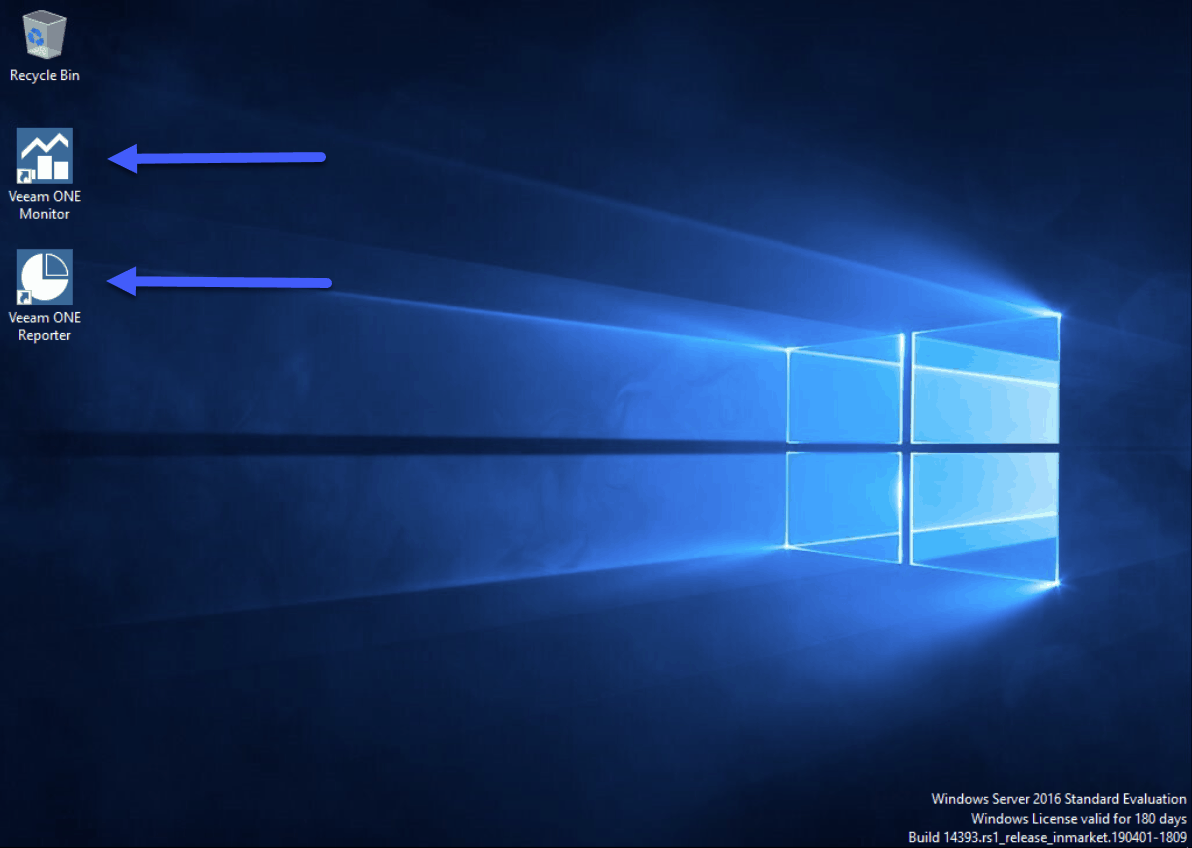 I leave you the list of all the articles that correspond to this interesting series about Veeam ONE as our monitoring and reporting system:
- Looking for the Perfect Dashboard: Veeam ONE – Part I – Introduction to Veeam ONE
- Looking for the Perfect Dashboard: Veeam ONE – Part II – Download and Install Veeam ONE
- Looking for the Perfect Dashboard: Veeam ONE – Part III – Adding a VMware vSphere Infrastructure to Veeam ONE
- Looking for the Perfect Dashboard: Veeam ONE – Part IV – Adding a Veeam Backup and Replication Infrastructure to Veeam ONE
- Looking for the Perfect Dashboard: Veeam ONE – Part V – Troubleshooting vSphere using Veeam ONE Monitor
- Looking for the Perfect Dashboard: Veeam ONE – Part VI – Troubleshooting Veeam Backup and Replication using Veeam ONE Monitor
- Looking for the Perfect Dashboard: Veeam ONE – Part VII – Dashboards at a Glance in the Veeam ONE Reporter
- Looking for the Perfect Dashboard: Veeam ONE – Part VIII – In-depth look at Reports in Veeam ONE Reporter
- Looking for the Perfect Dashboard: Veeam ONE – Part IX – Chargeback to create cost reports of our Infrastructure
Leave a Reply