
 Greetings friends, I have been telling you the first steps with Veeam ONE in previous posts, today I come to show you how to connect to our vSphere environment so that Veeam ONE can collect from there all the metrics of the VMs, Hosts, Clusters, etc. This process is not intrusive and does not affect VMs, hosts or vCenter.
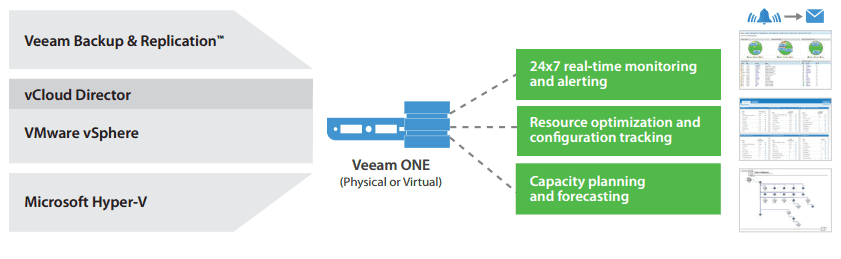
Adding a VMware Infrastructure to Veeam ONE
The first thing we’ll do is open the Veeam ONE Monitor with a user with admin privileges in vCenter, in the Infrastructure View, we’ll click on Add Server: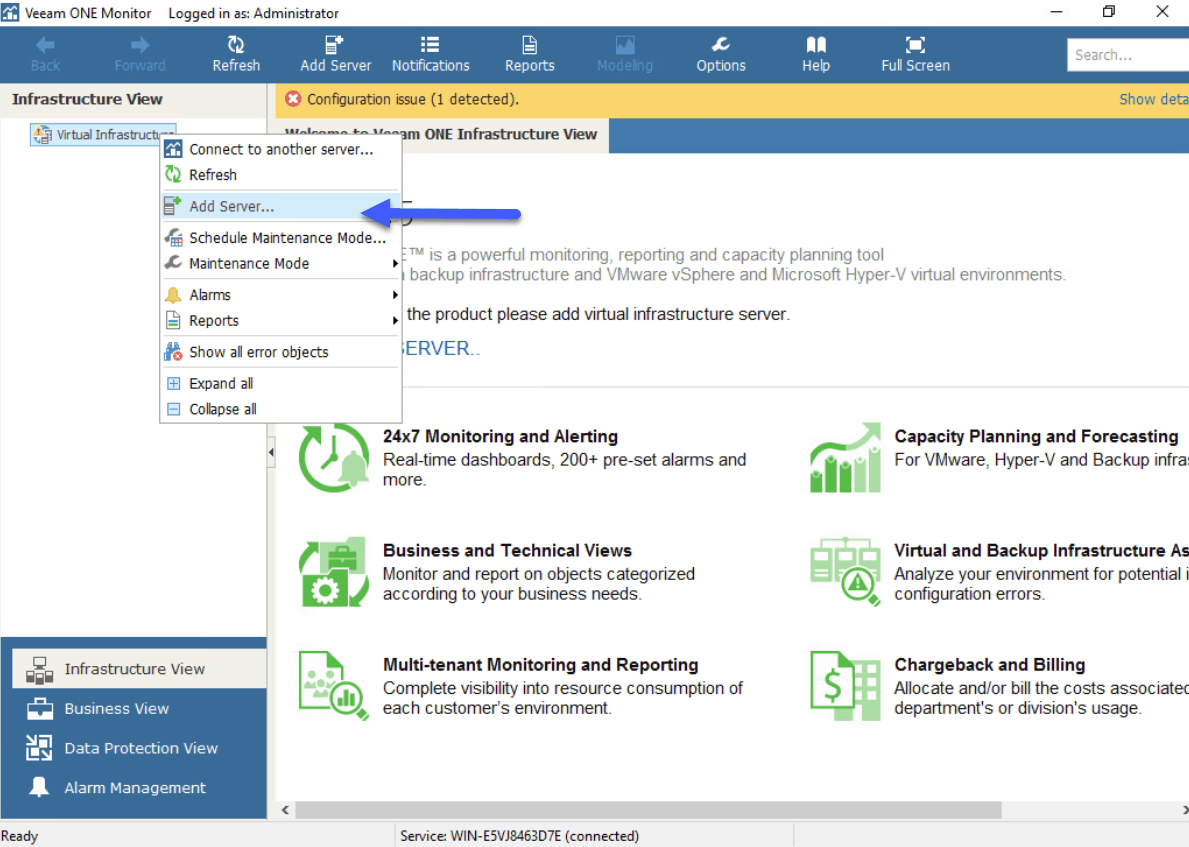
We will select the type of server we want to add, in our case of VMware Server type: 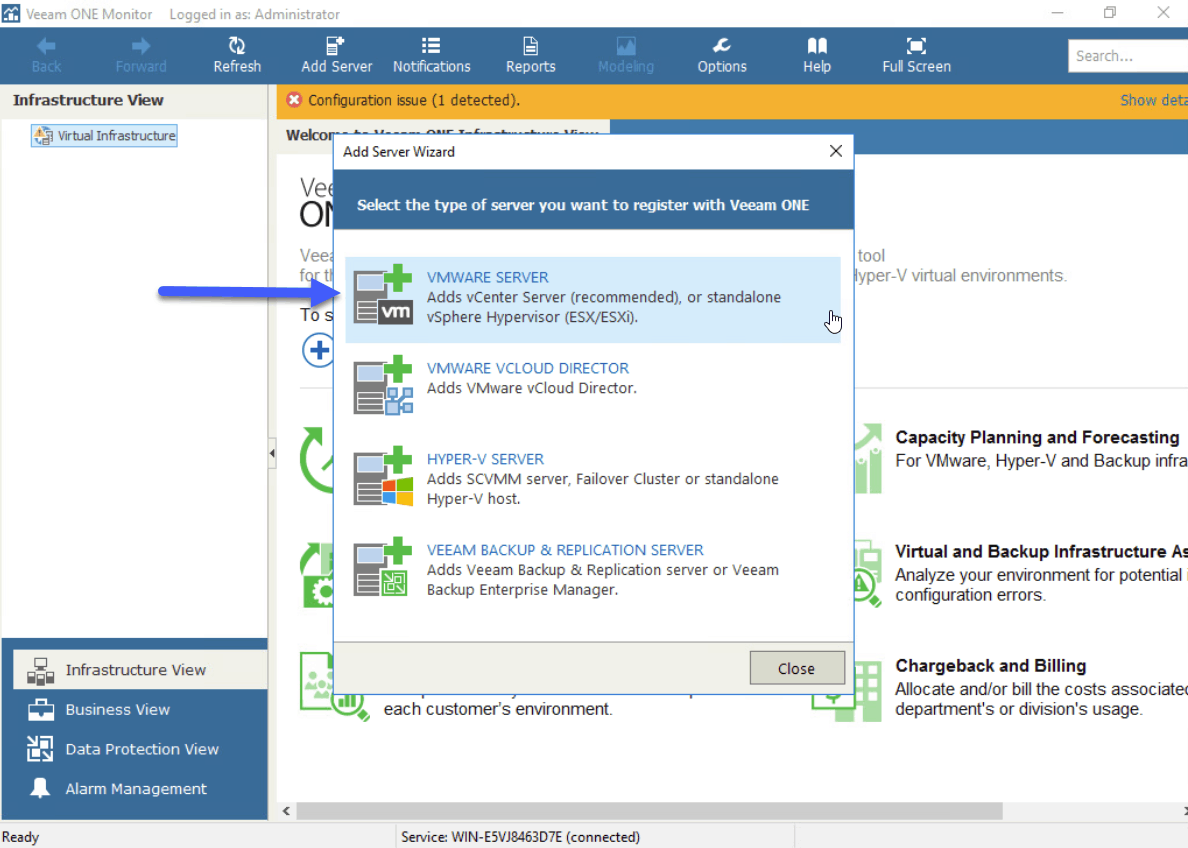 We will add the IP or FQDN of our vCenter, besides telling you that it is a vCenter type, we could also monitor those isolated ESXi that we could have:
 We will introduce a user with privileges inside vCenter so we can collect metrics:
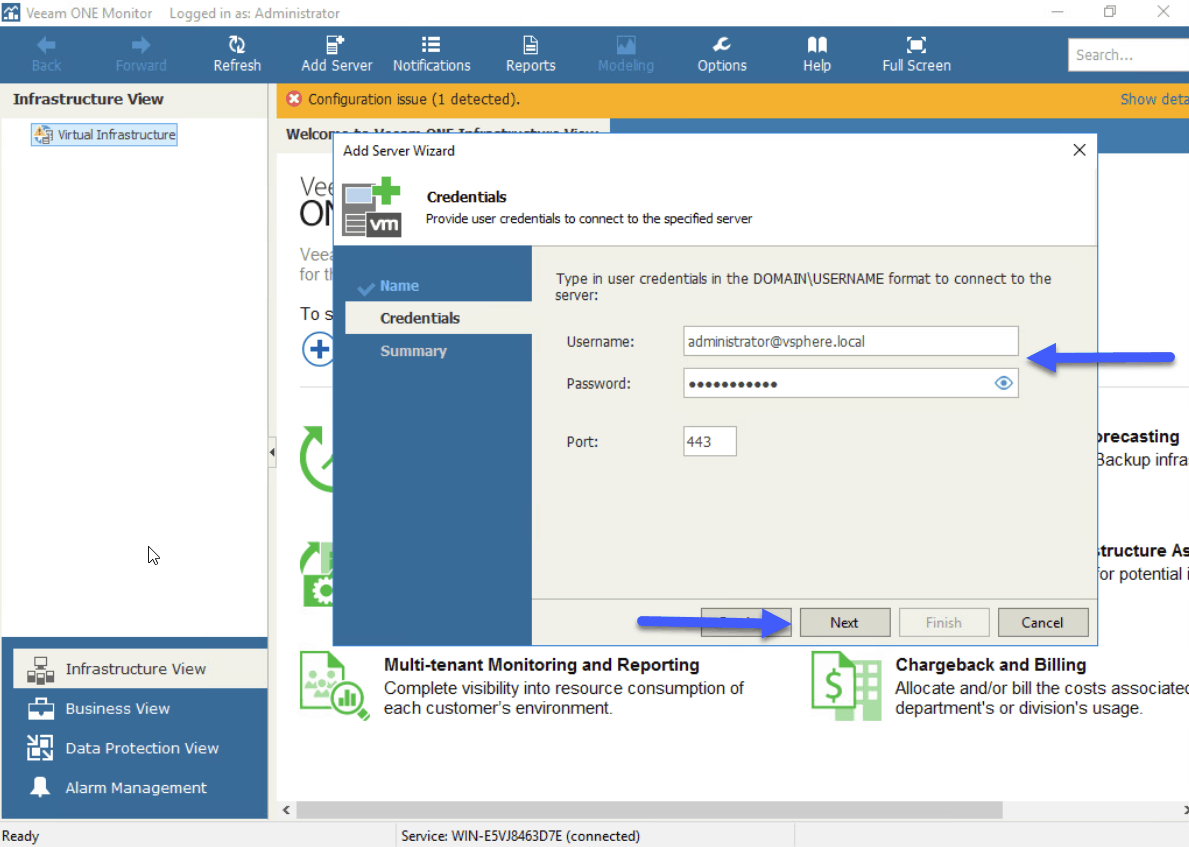 And if everything has gone well, we will see the Summary, we will be able to click on Finish:
 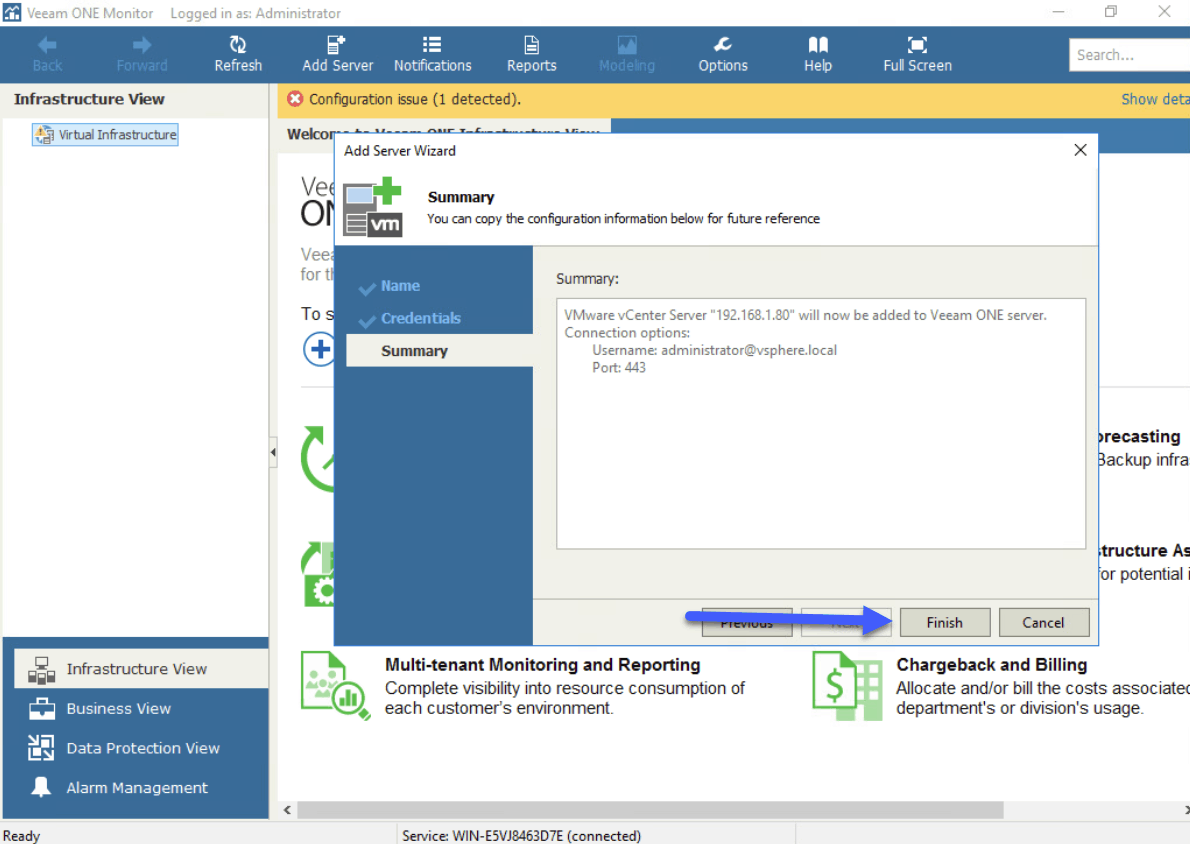 Now we will be able to see all our environment, the VMs, Datastores, Hosts, Clusters, and the alarms in each one of the components:
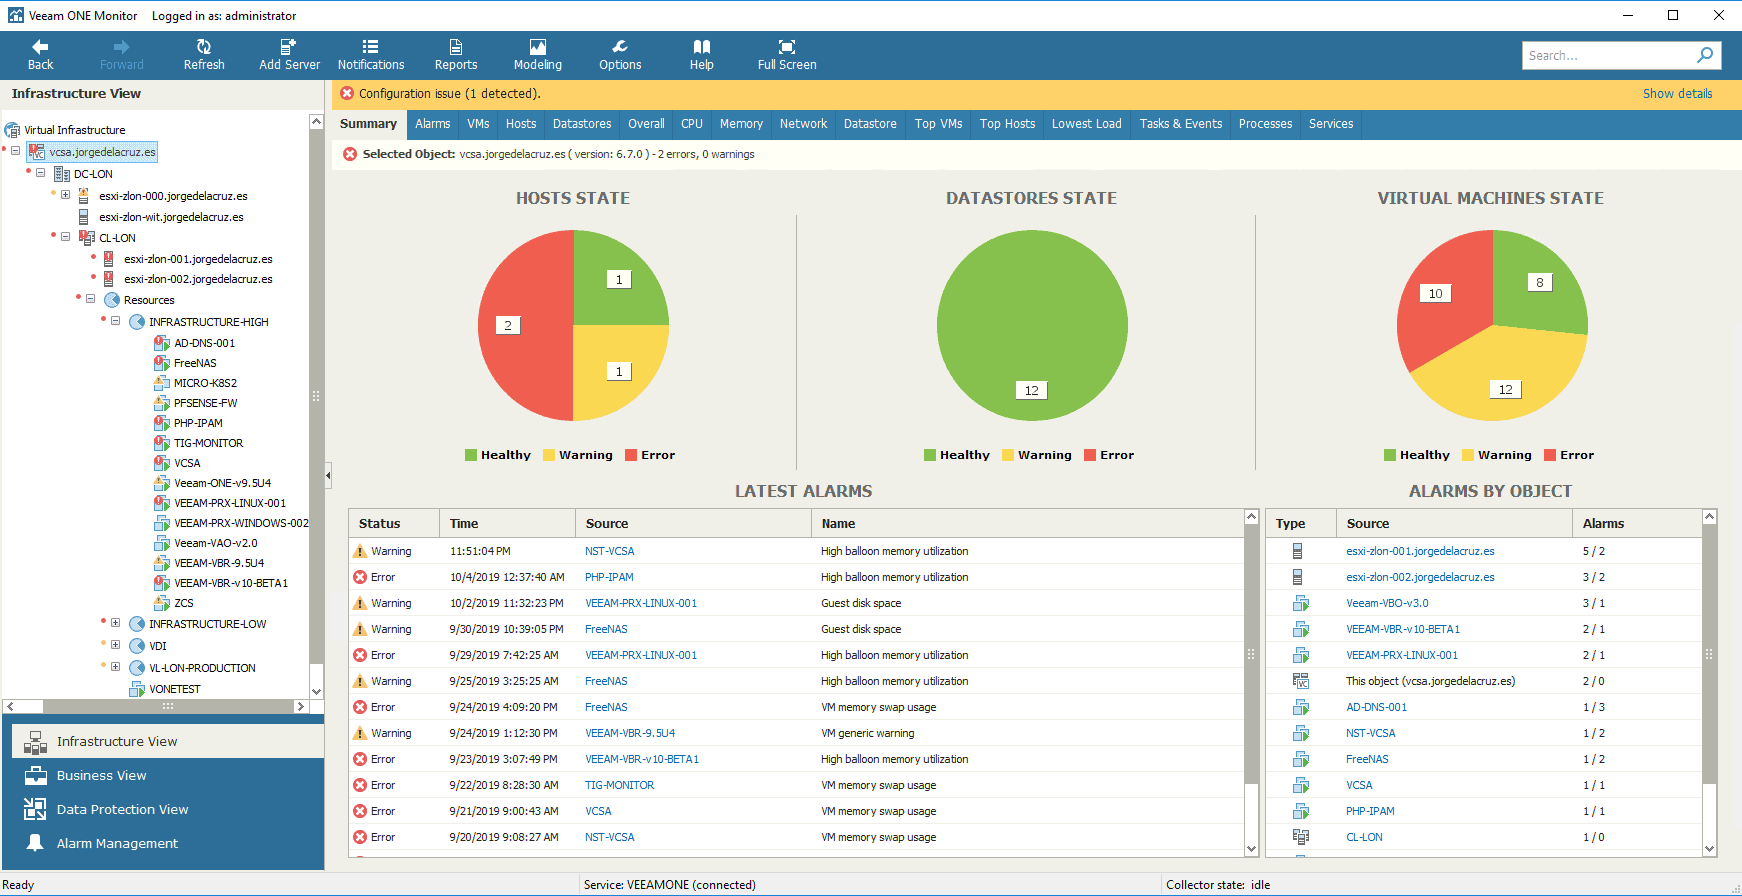
A quick overview of Veeam ONE Monitor with an associated VMware environment
Although we will see how to do troubleshooting later, I want to show you the fastest way to see consumption with Veeam ONE Monitor, for example, the view of Top VMs consuming more resources: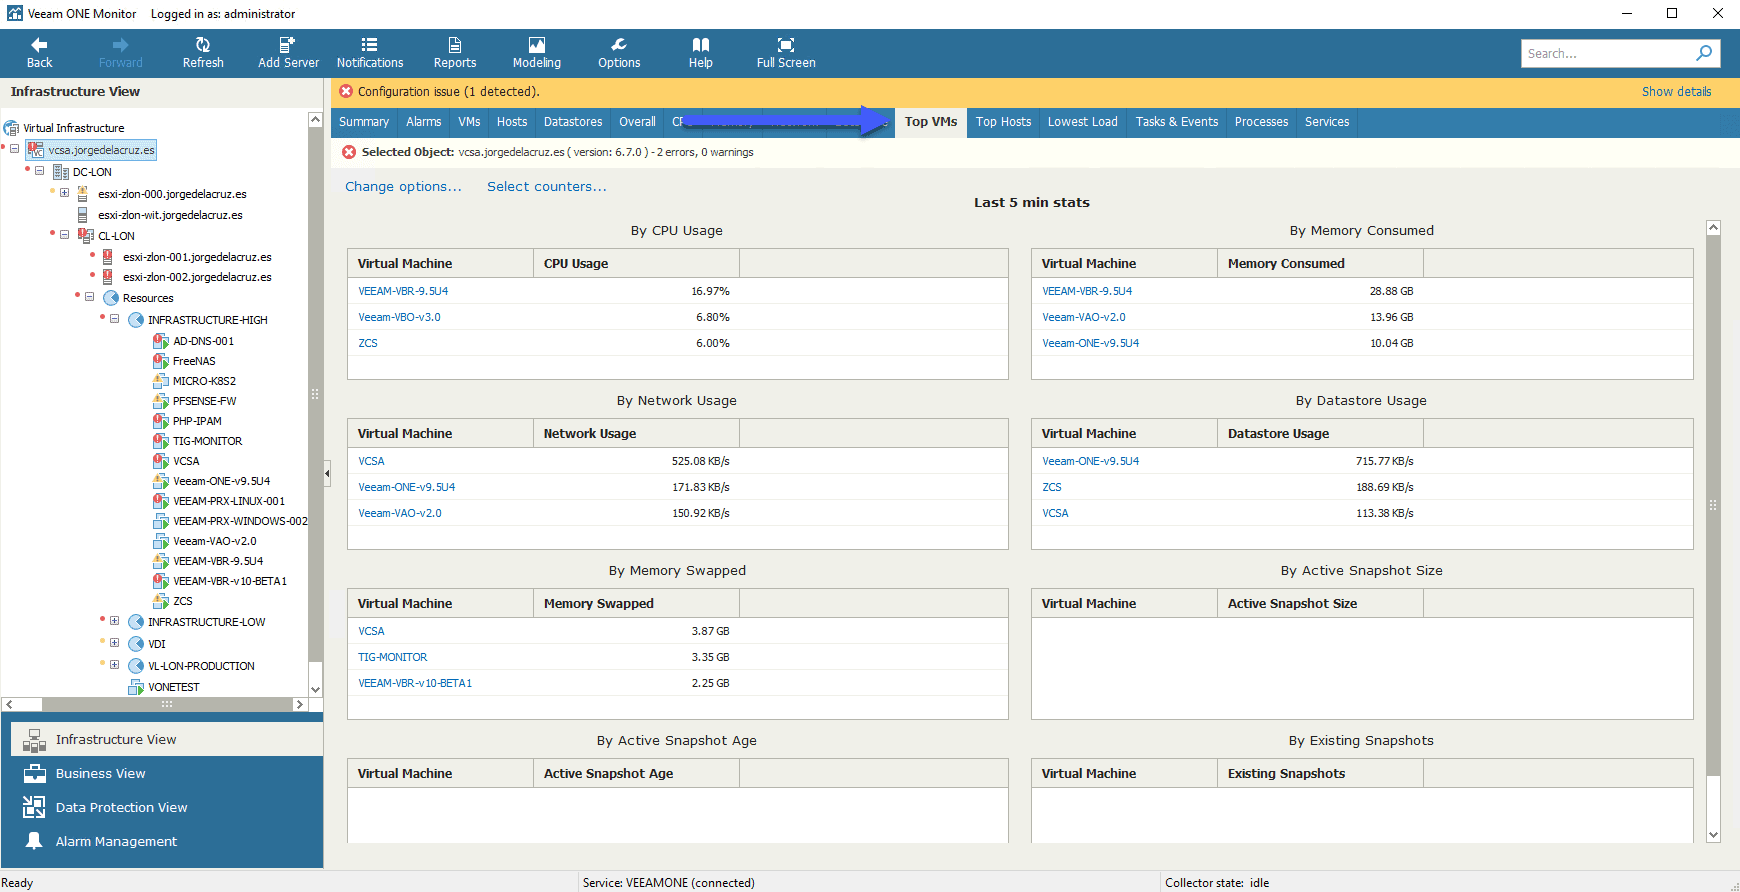 Or for example, the most stressed Hosts, that is always important to know if any of them has an excessive consumption in CPU, RAM, Disk, or Networking:
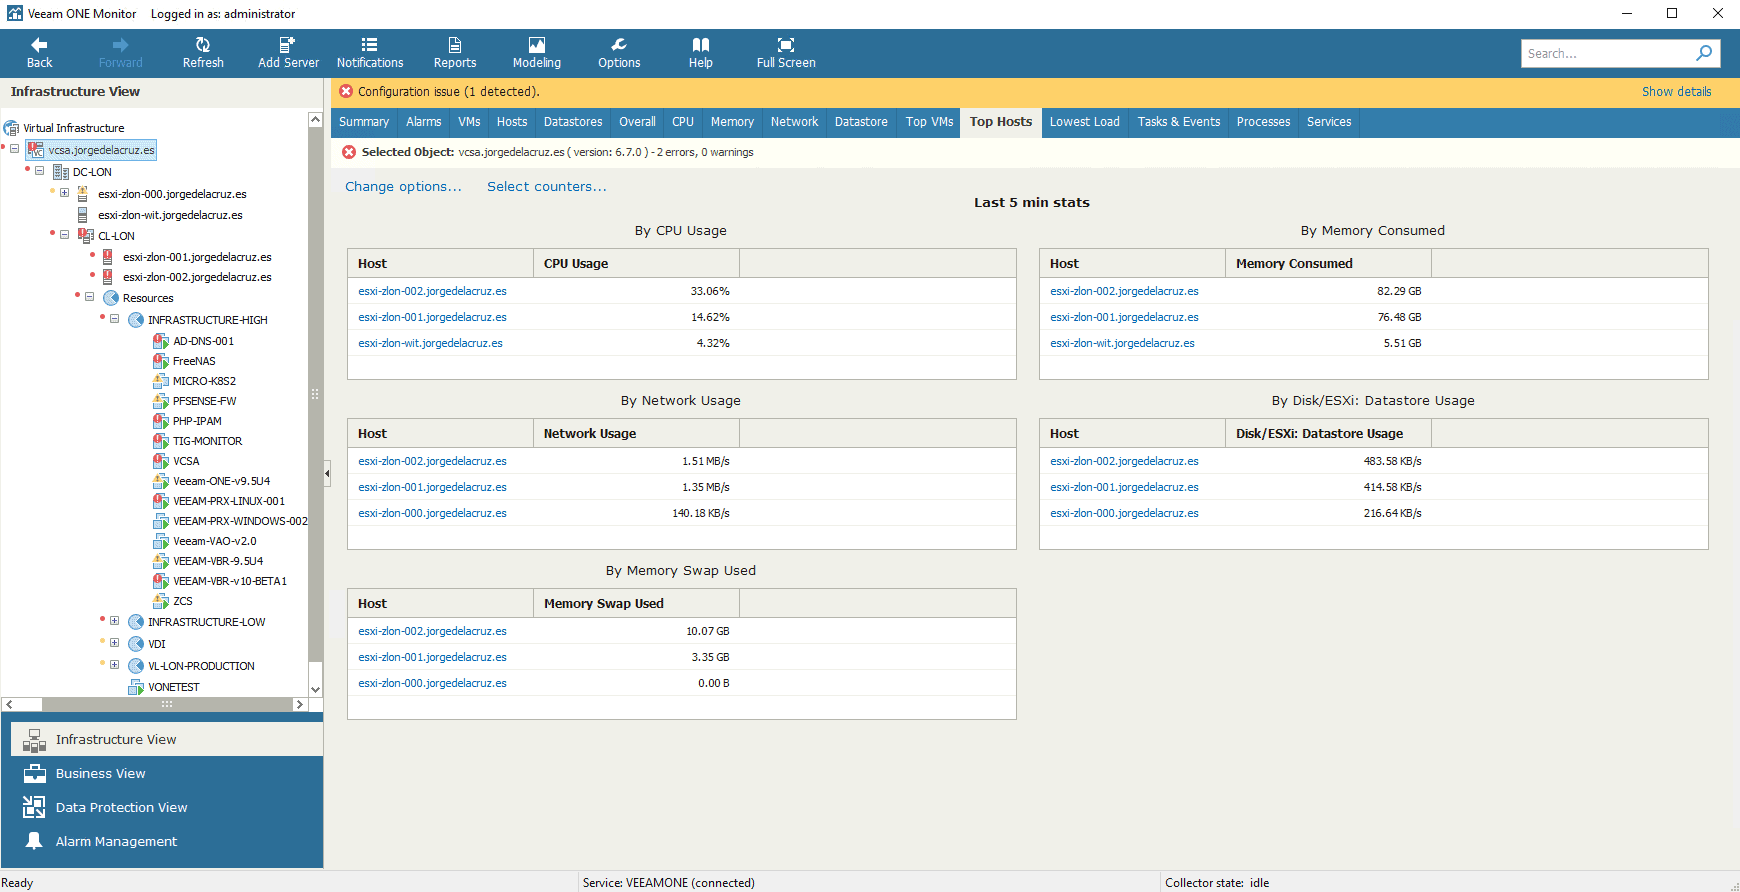 Likewise, if we move to our datastores, we will be able to see at a simple glance the state of it:
 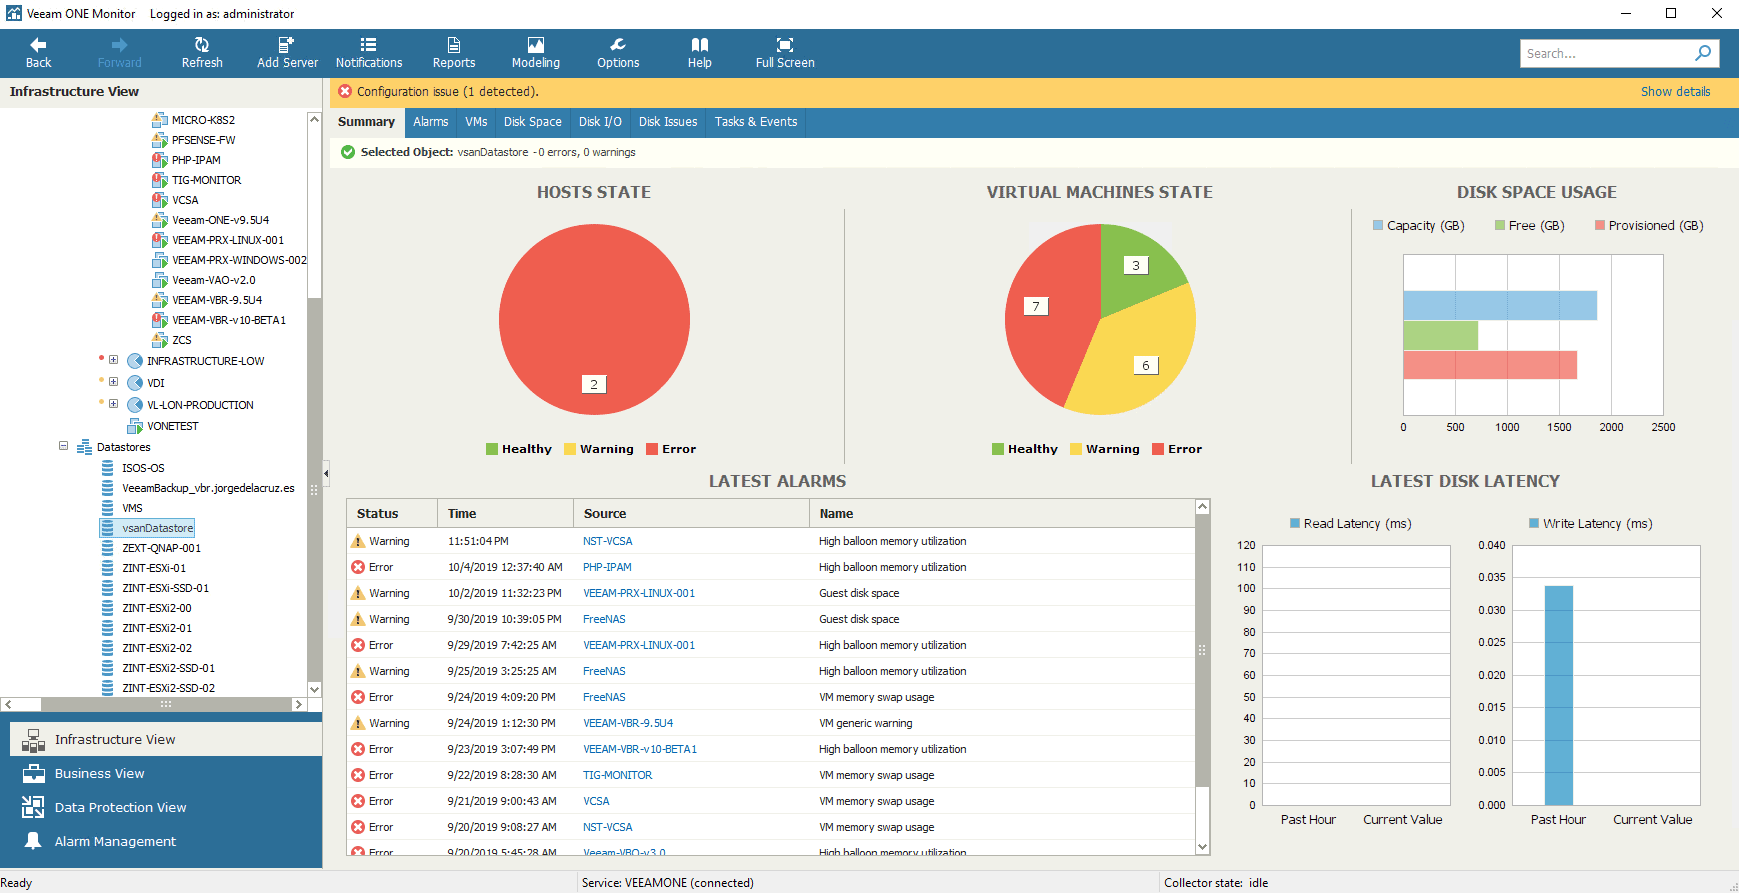 Nothing else friends, I hope that it has served you, and to continue reading this series that come more complex and detailed posts.
I leave you the list of all the articles that correspond to this interesting series about Veeam ONE as our monitoring and reporting system:
- Looking for the Perfect Dashboard: Veeam ONE – Part I – Introduction to Veeam ONE
- Looking for the Perfect Dashboard: Veeam ONE – Part II – Download and Install Veeam ONE
- Looking for the Perfect Dashboard: Veeam ONE – Part III – Adding a VMware vSphere Infrastructure to Veeam ONE
- Looking for the Perfect Dashboard: Veeam ONE – Part IV – Adding a Veeam Backup and Replication Infrastructure to Veeam ONE
- Looking for the Perfect Dashboard: Veeam ONE – Part V – Troubleshooting vSphere using Veeam ONE Monitor
- Looking for the Perfect Dashboard: Veeam ONE – Part VI – Troubleshooting Veeam Backup and Replication using Veeam ONE Monitor
- Looking for the Perfect Dashboard: Veeam ONE – Part VII – Dashboards at a Glance in the Veeam ONE Reporter
- Looking for the Perfect Dashboard: Veeam ONE – Part VIII – In-depth look at Reports in Veeam ONE Reporter
- Looking for the Perfect Dashboard: Veeam ONE – Part IX – Chargeback to create cost reports of our Infrastructure
Leave a Reply