
 Greetings friends, we have seen in previous posts the installation of VeeamONE, the basic configuration of a VMware and Veeam environment. Today we are going to go a step further and see the daily use that can be given to VeeamONE.
Troubleshooting of environment alarms
We are going to use Veeam ONE Monitor Client for all this lab, the first thing we will do is log in, and depending on the privileges we have we will be able to see more or fewer resources, in my case with Administrator permissions, I see everything, like the All-Seeing eye, then we can see at a glance all the alerts for each type of element, Hosts, Datastores and Virtual Machines: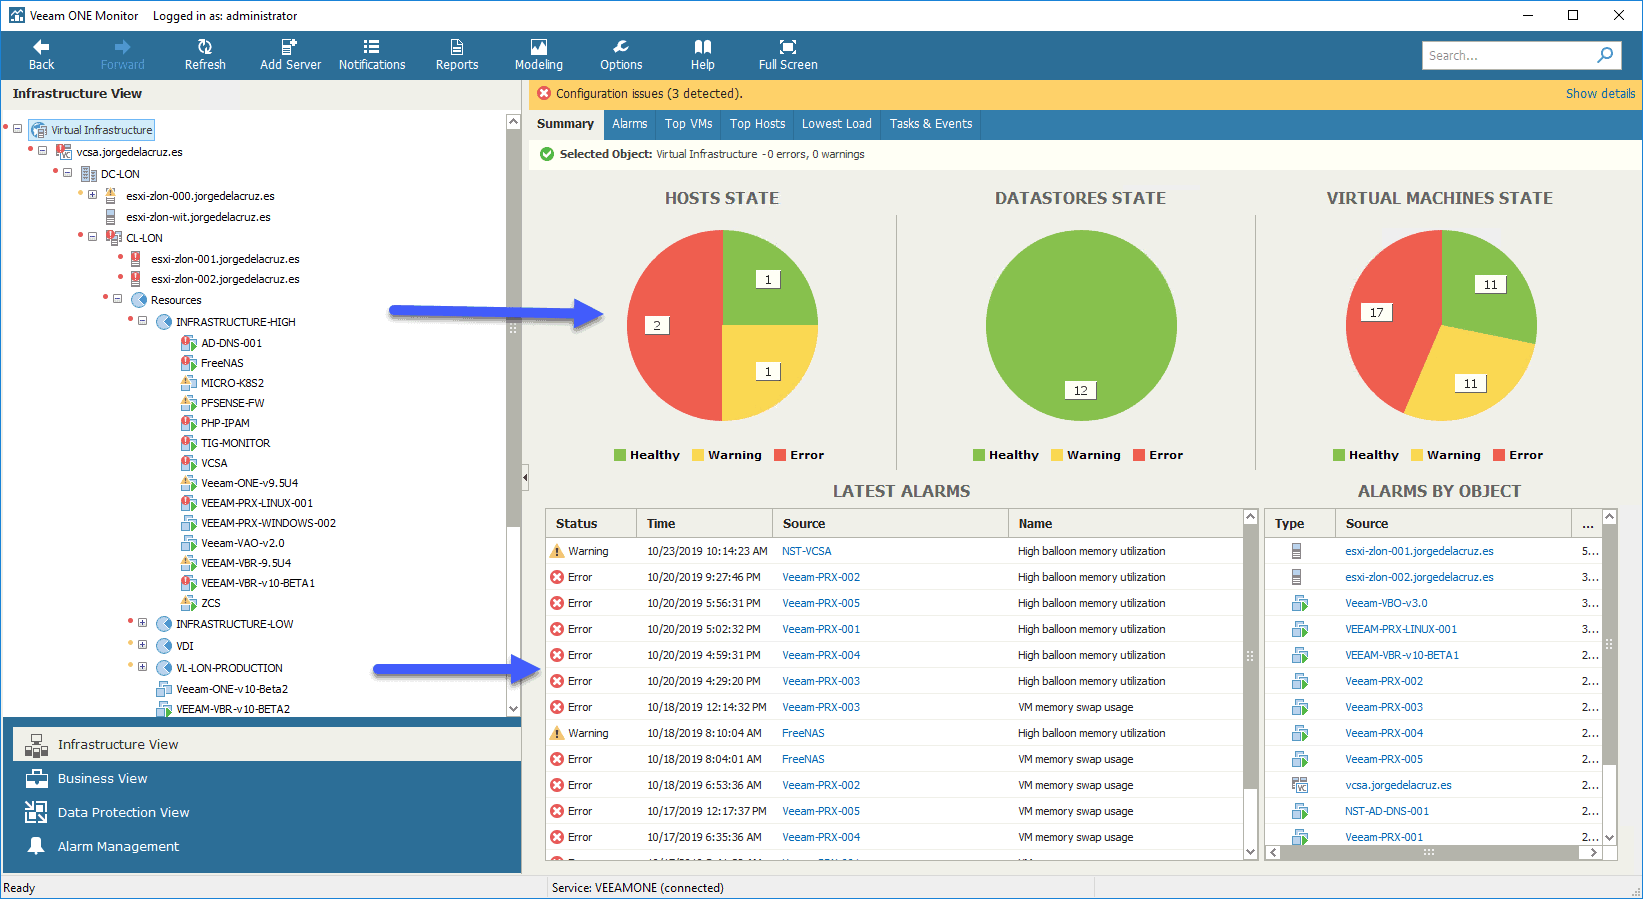 If for example, I click in any of the alerts, we can see the history of the element, also I like very much that Veeam ONE includes detailed information of the problem, in this case, it is ballooning in the VM, that means that we have a RAM memory problem:
 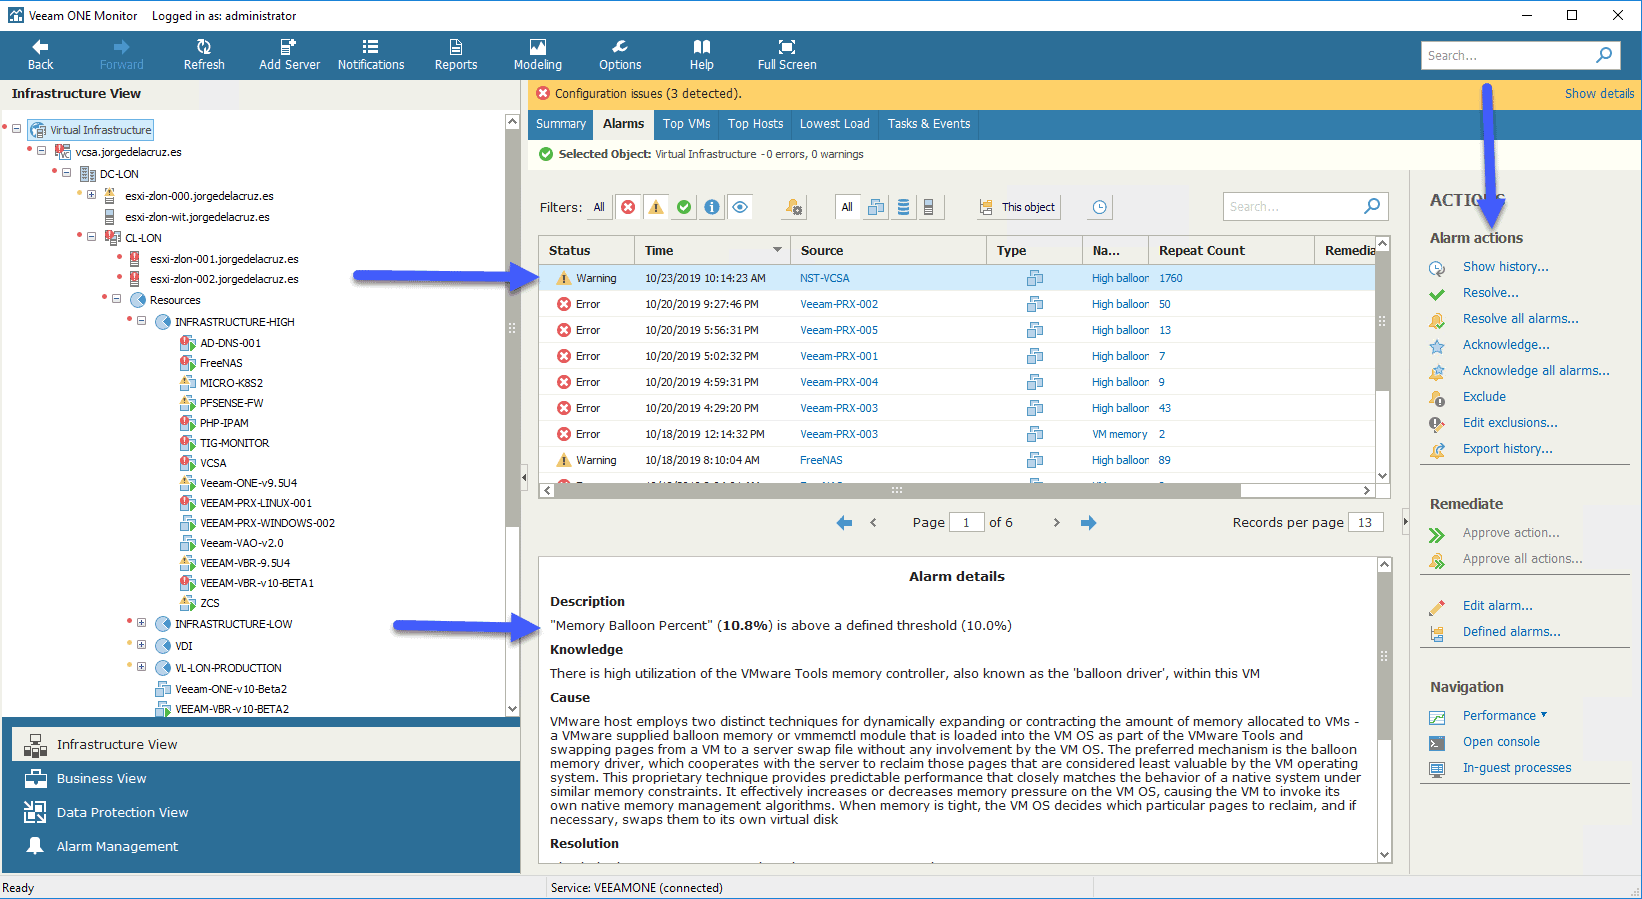 Or for example, this is another case, this time a Host alert, it is an attempt to access by root through SSH, with wrong username and password:
 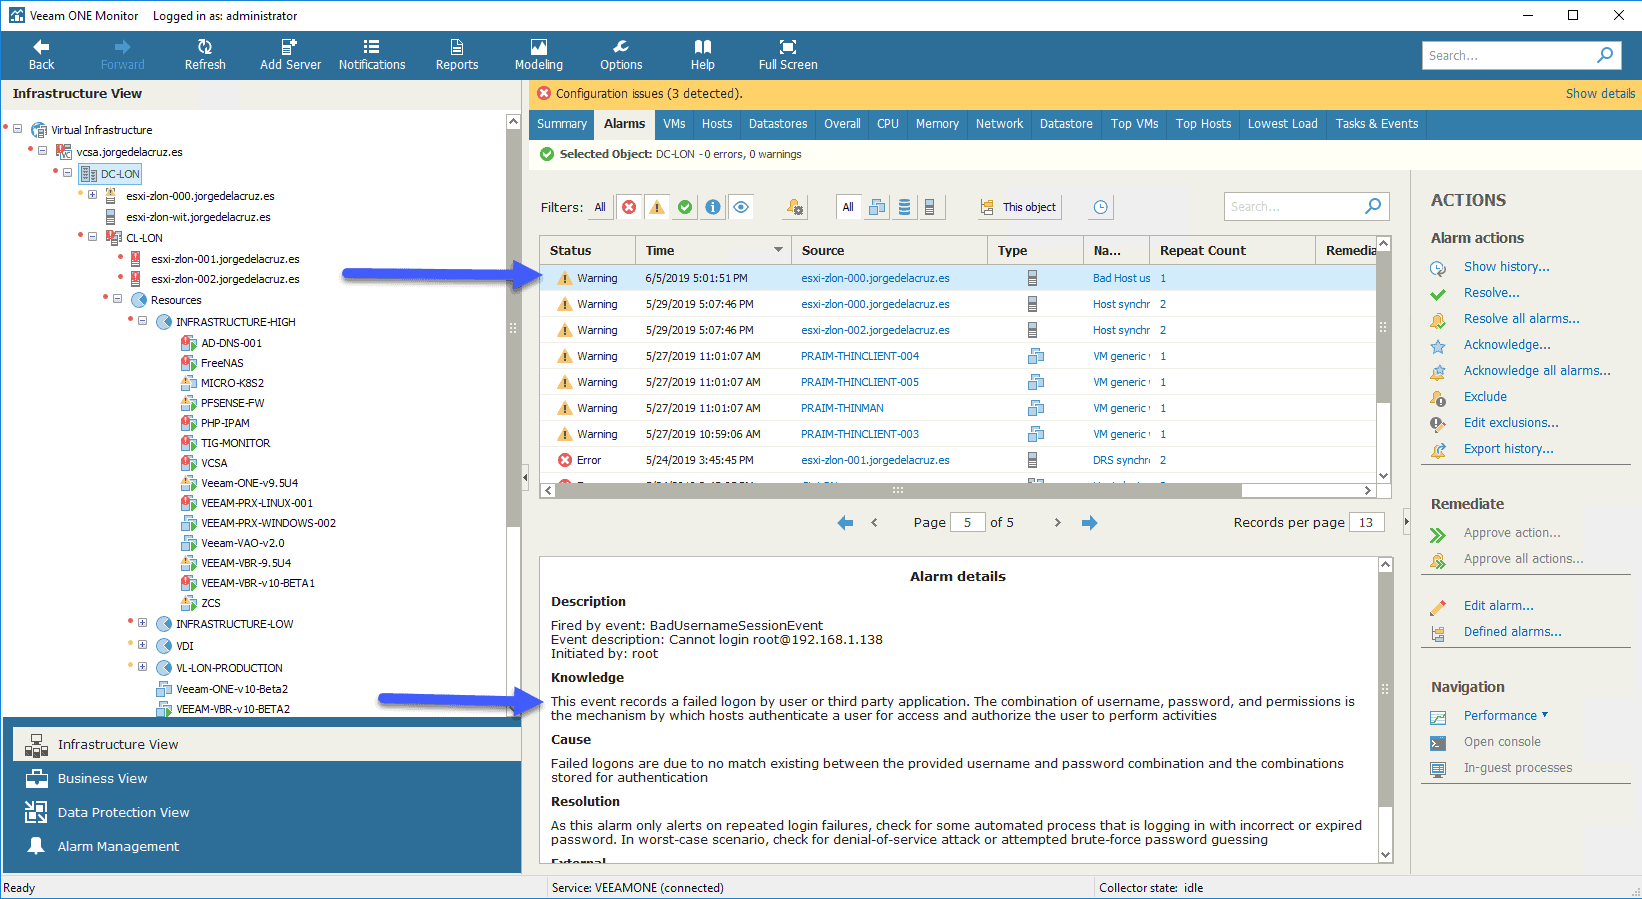 When solving the incidence, I recommend you to introduce a brief comment so that when we generate reports, we can see all these comments:
 This way we could see all the alarms of the element that I have selected, in this case esxi-zlon-000:
 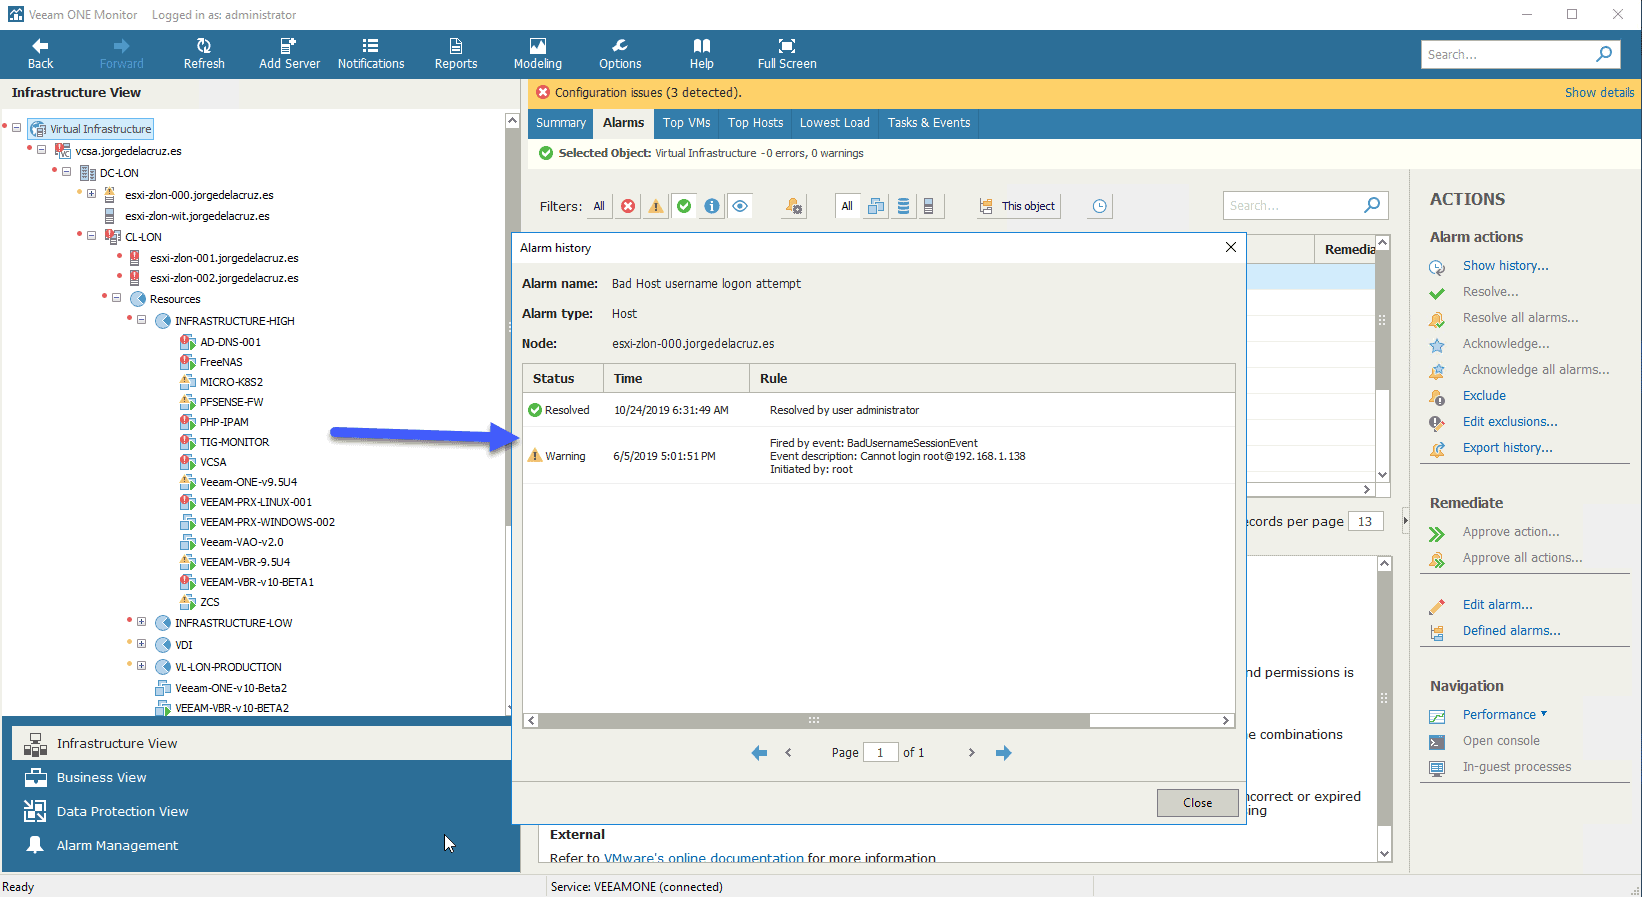 Also, of course, I recommend you to create a report of the incidences, so that we can make a pursuit of the incidences per day, and see the tendencies:
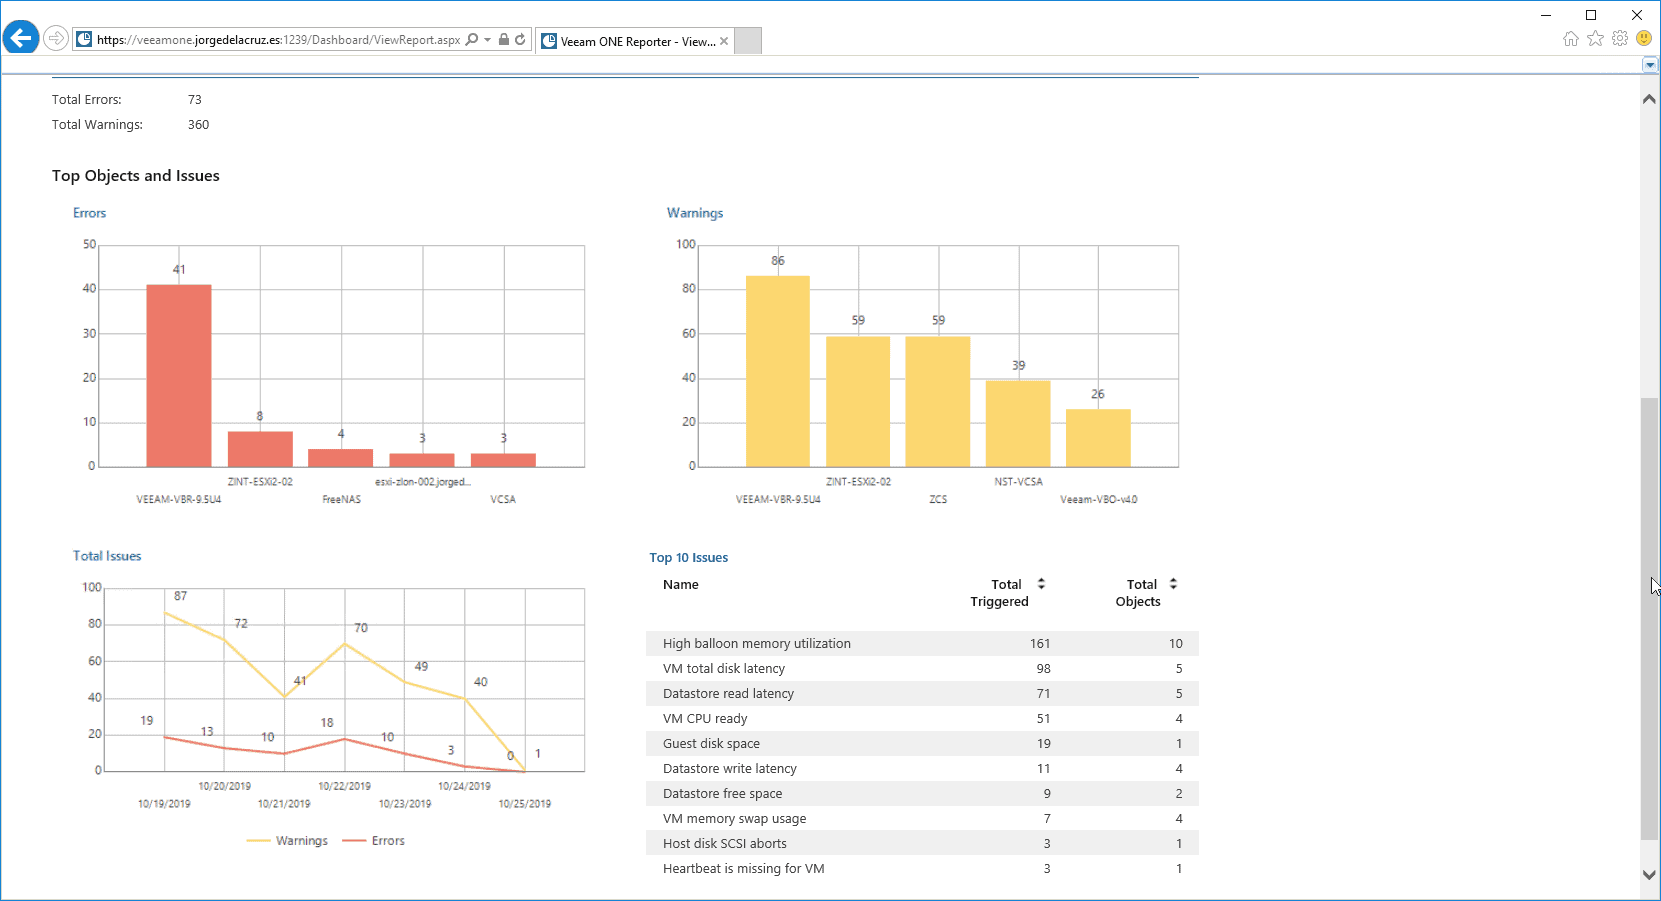
Virtual Machine Troubleshooting
Let’s now see how we can do troubleshooting of a VM, something very common and that usually, we will have to do, I think in this case I will use a Linux VM at 100% CPU: We’ll be able to see that the CPU consumption alert has been triggered as well:
 From the CPU tab, we will be able to see when the VM has started with this CPU alert, which is recent:
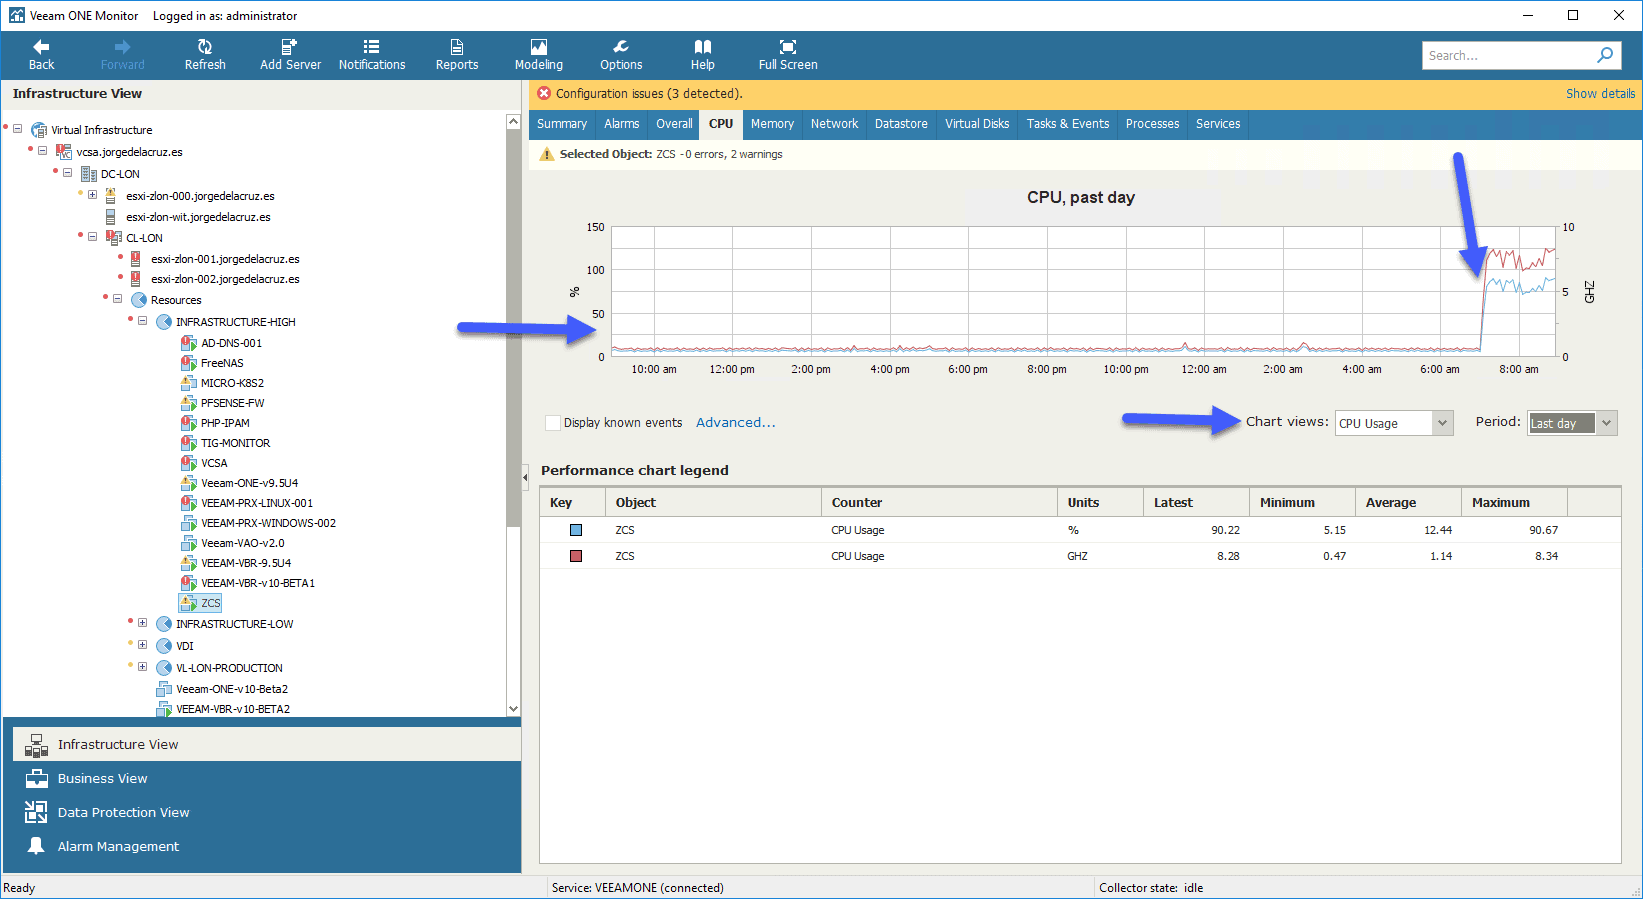 We see that we have a tab called Processes, this is connected through SSH automatically by the port that we indicate, and it will show us in a very simple way the processes, its RAM and CPU consumption, fantastic!
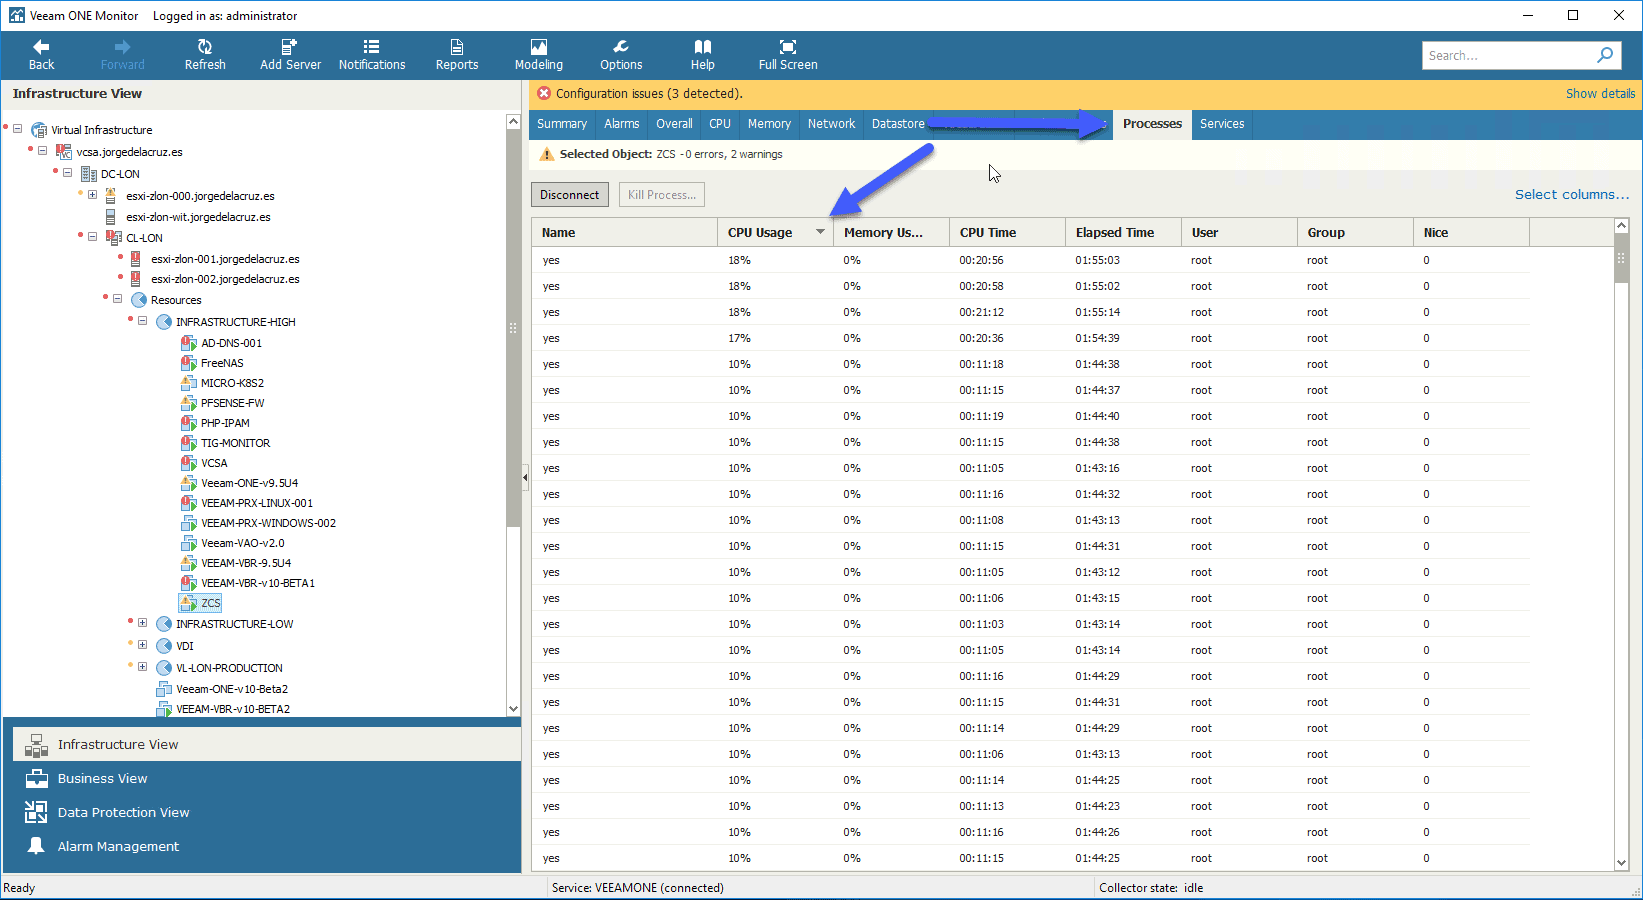 We could now kill the processes from here, in case the user had privileges, if on the contrary, he didn’t have privileges over those processes, we can directly invoke PuttY, first we would have to have it configured in Veeam ONE Client:
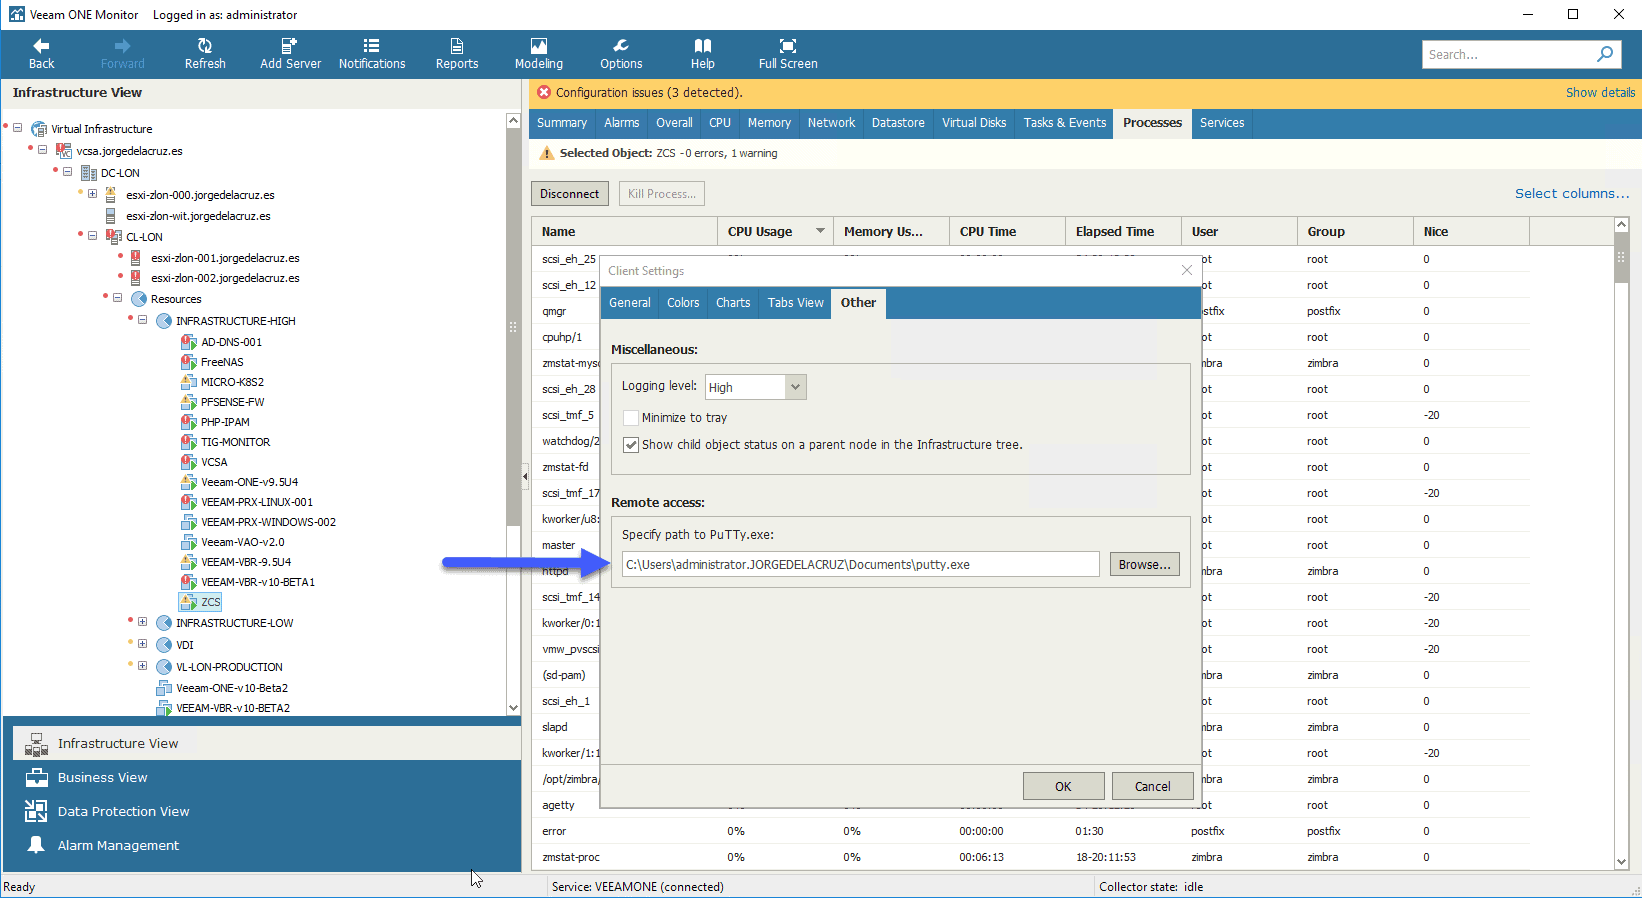 And from the VM menu, we can hit Remote Management – Connect to VM:
 And from the putty, we can elevate to root, and from there kill the processes that we don’t need, or that are new and malicious for example:
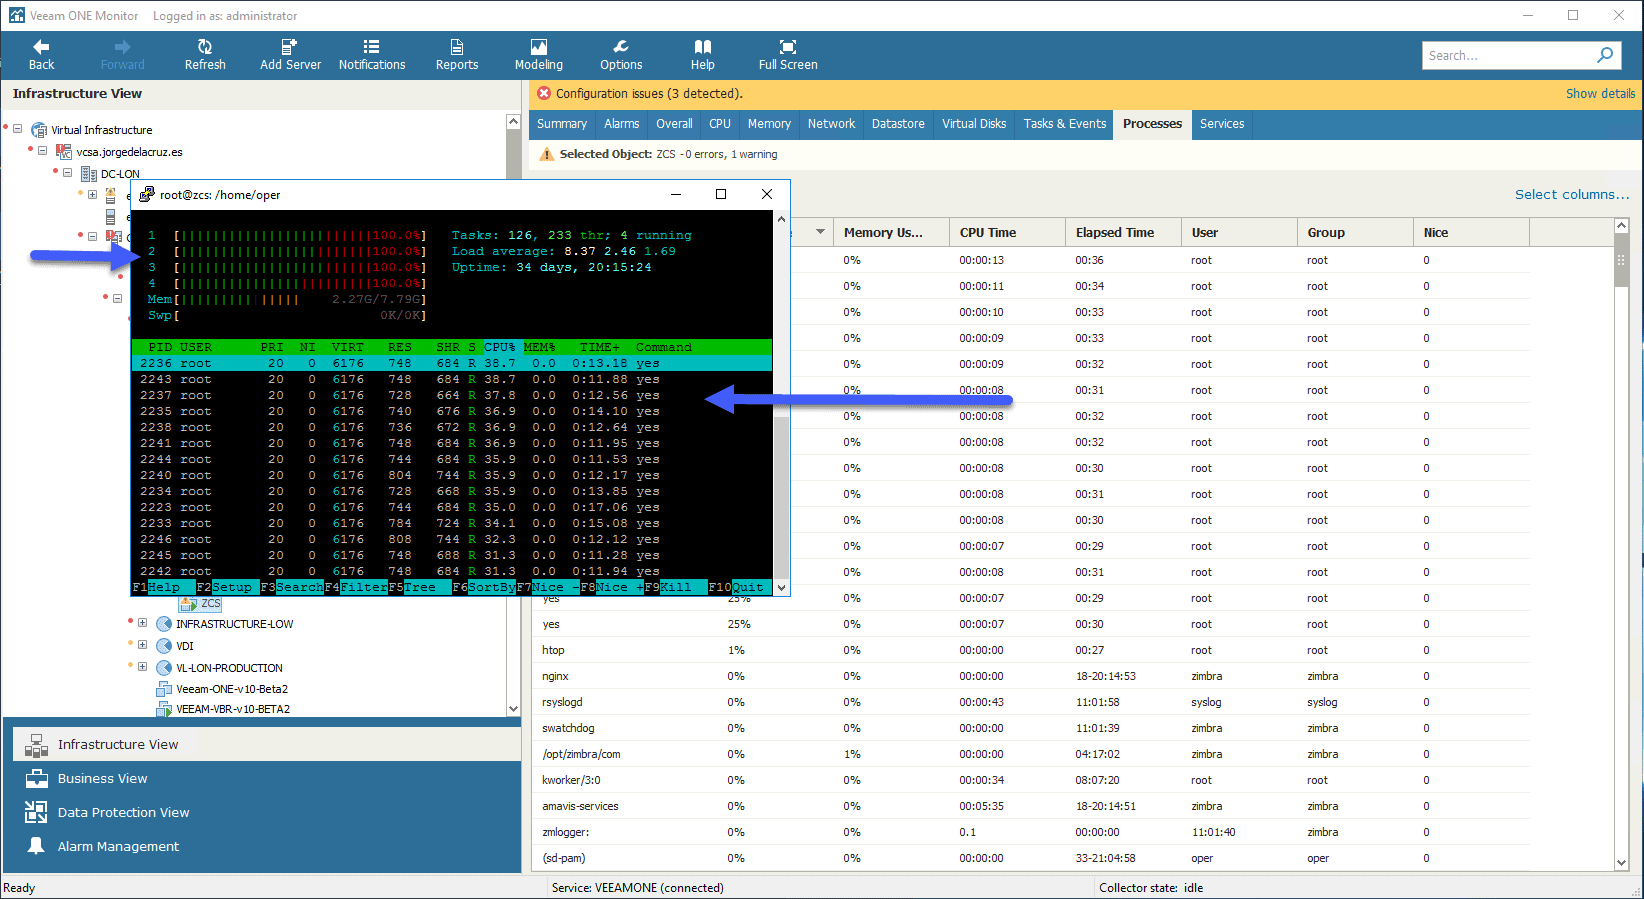 If we wanted to open the VMware console terminal, we could also, with just a right button, and Open Console:
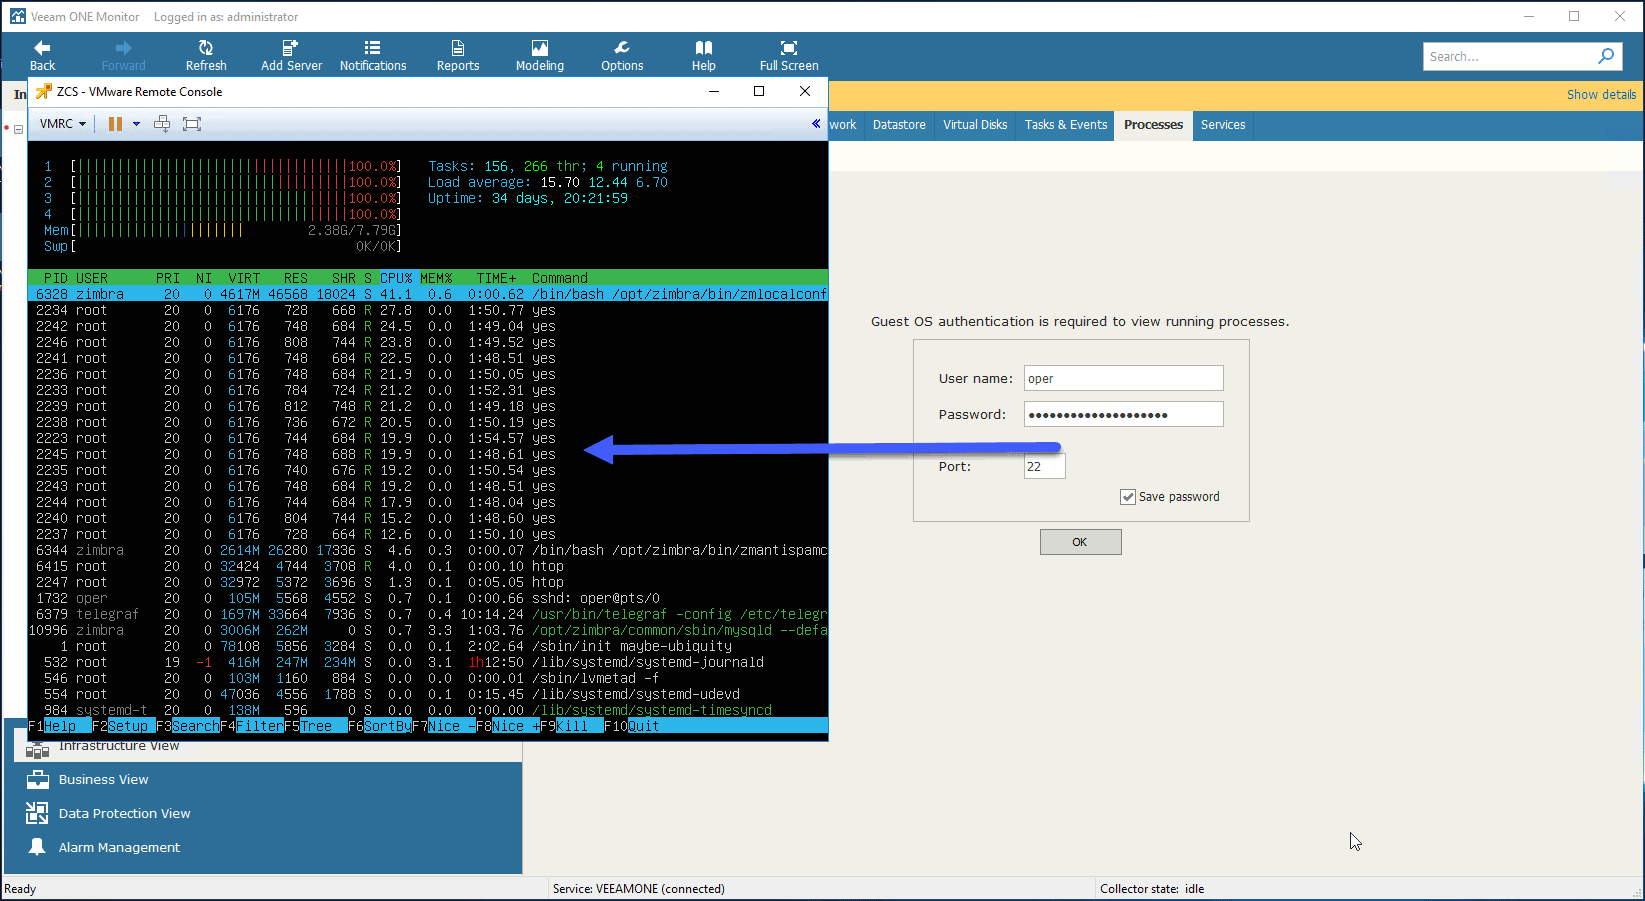 From this VMware console, if we had privileges, we could add or edit hardware, etc.
It’s worth mentioning that these two options to connect to a VM are for Microsoft Windows too but it is more obvious I’ve omitted them in this tutorial.
ESXi Host Troubleshooting
Let’s see how to troubleshoot an ESXi host, as we can imagine the errors or warnings are more due to the hardware, for example: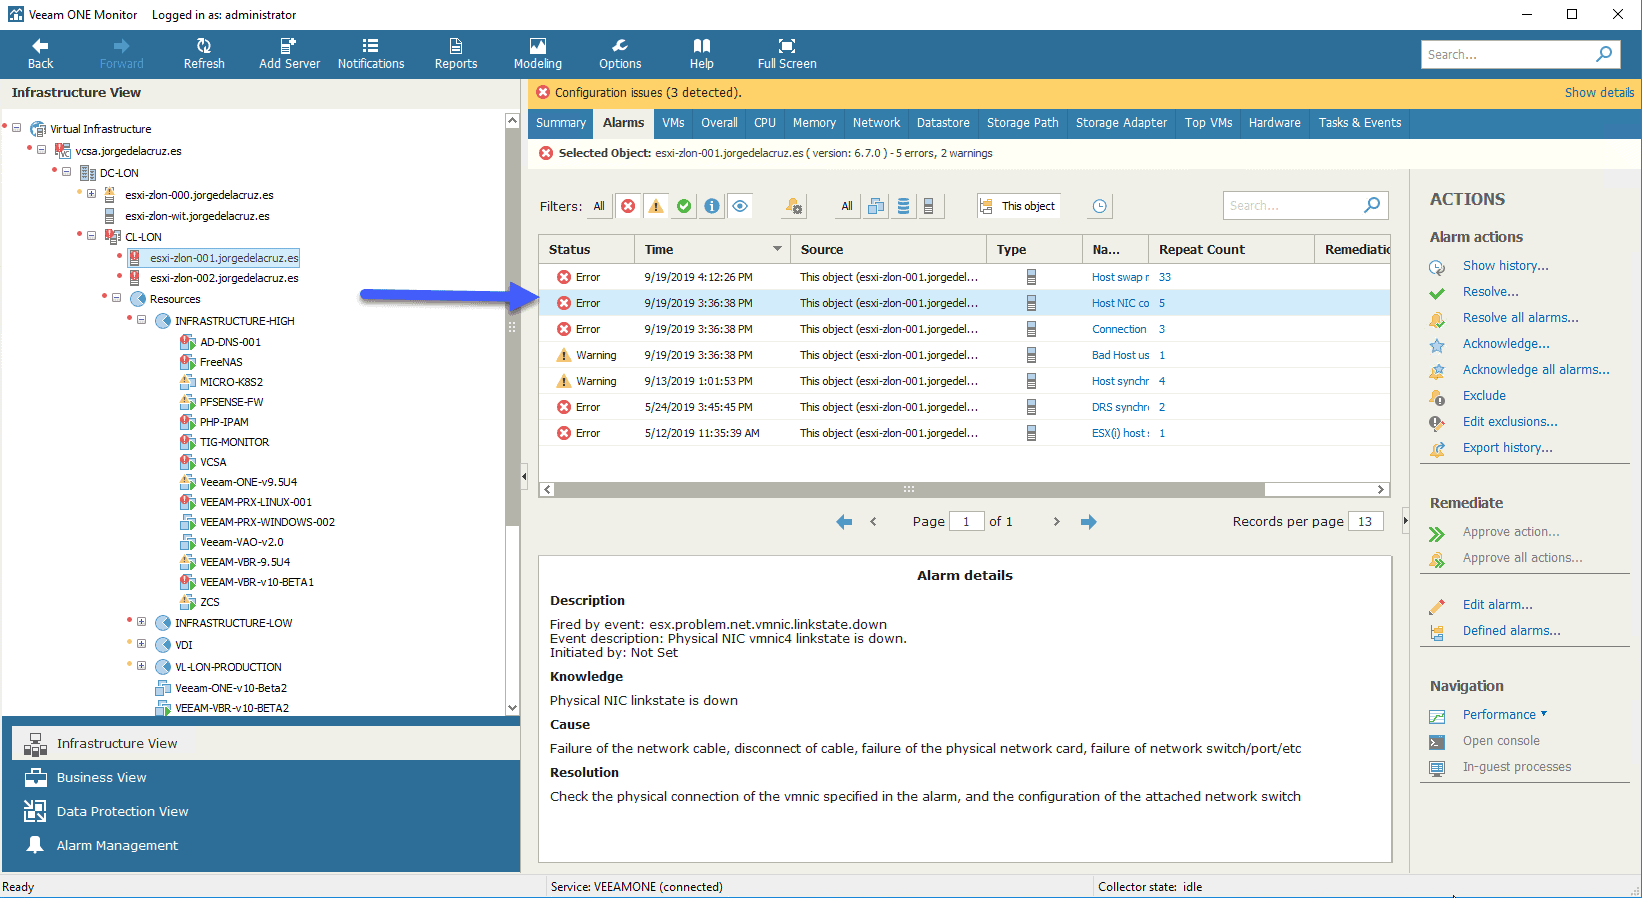 We can, of course, take a quick look at the hardware consumption of the ESXi:
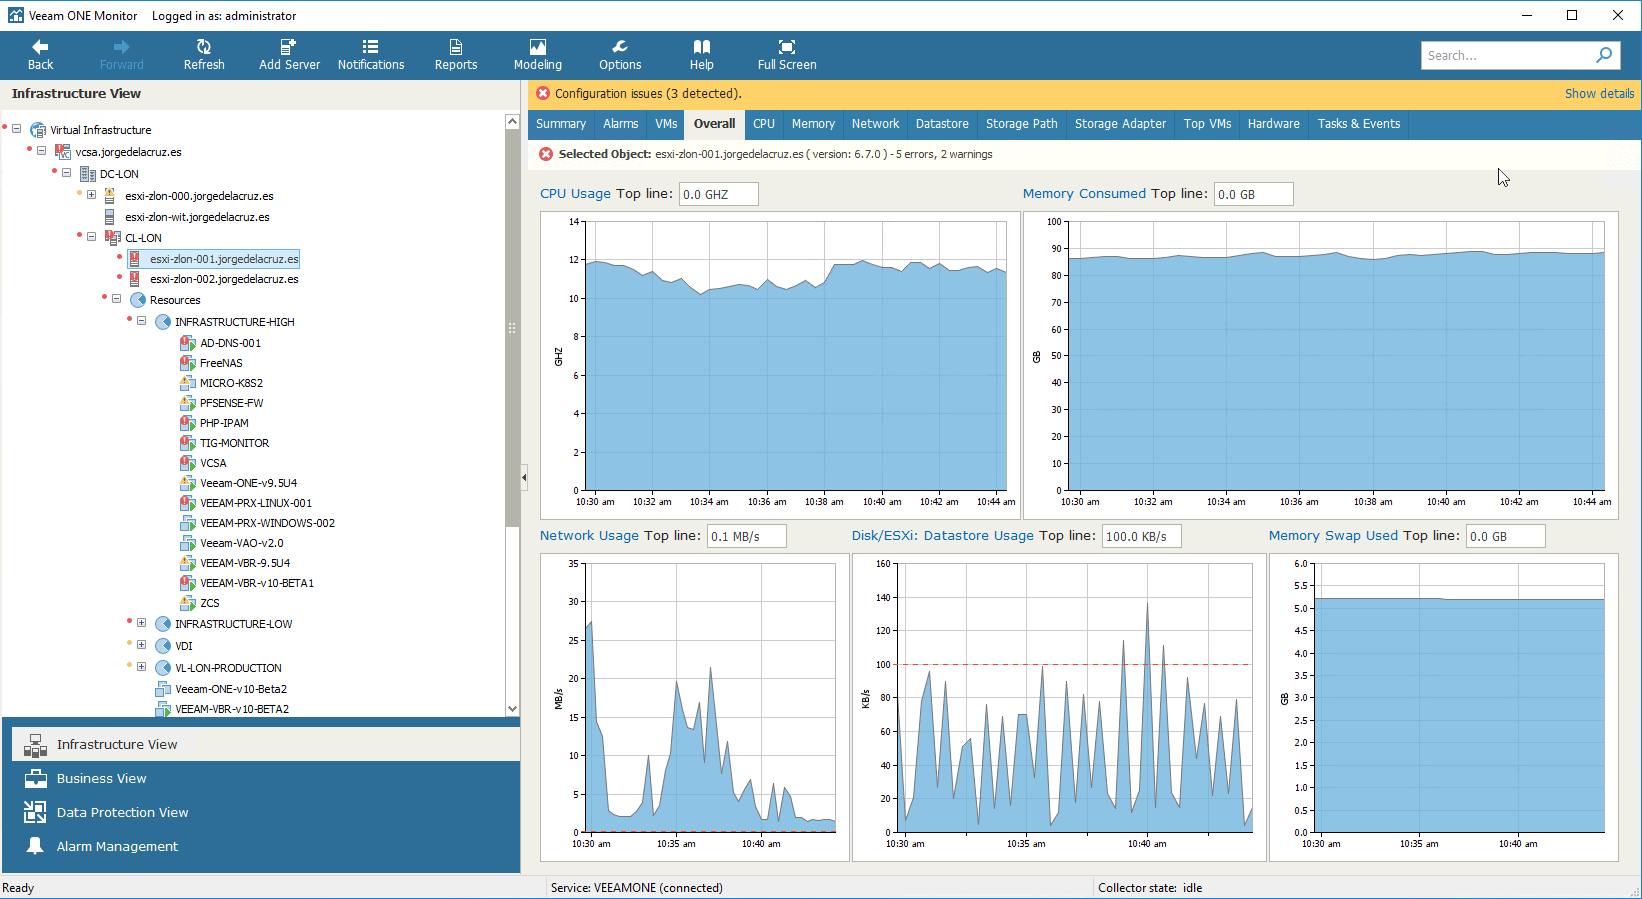 Going tab by tab will give us a much more refined visibility of each resource, in this case, the CPU, which has had a peak due to that rebellious VM we have debugged before:
  At memory level, the same, we can play with the chart views if we want a more detailed look of what is happening and what value of the memory is in worse state or has more consumption, latency, etc:
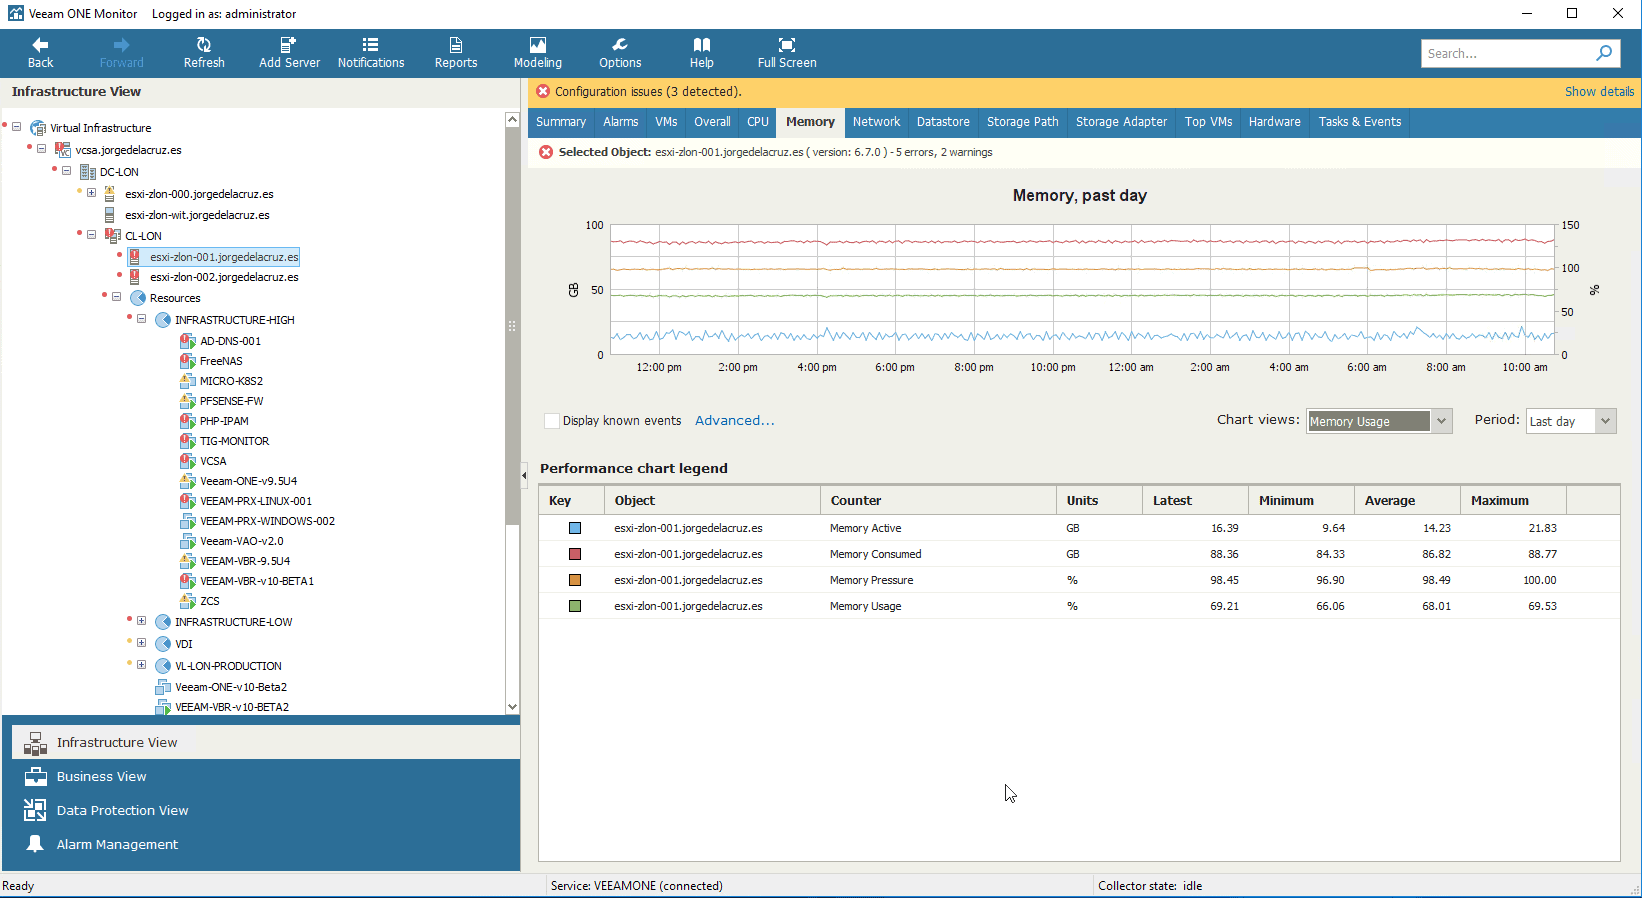 In the Datastore part, is where things get interesting, we can make a very detailed debug about the performance and performance of our datastores, going through latency, against lower, better:
 We can go to the Storage Path to give a more granular look at the resource consumption by each HBA:
 As in the Storage Adaper tab, we can see all the storage adapters and organize by those that have more latency, etc:
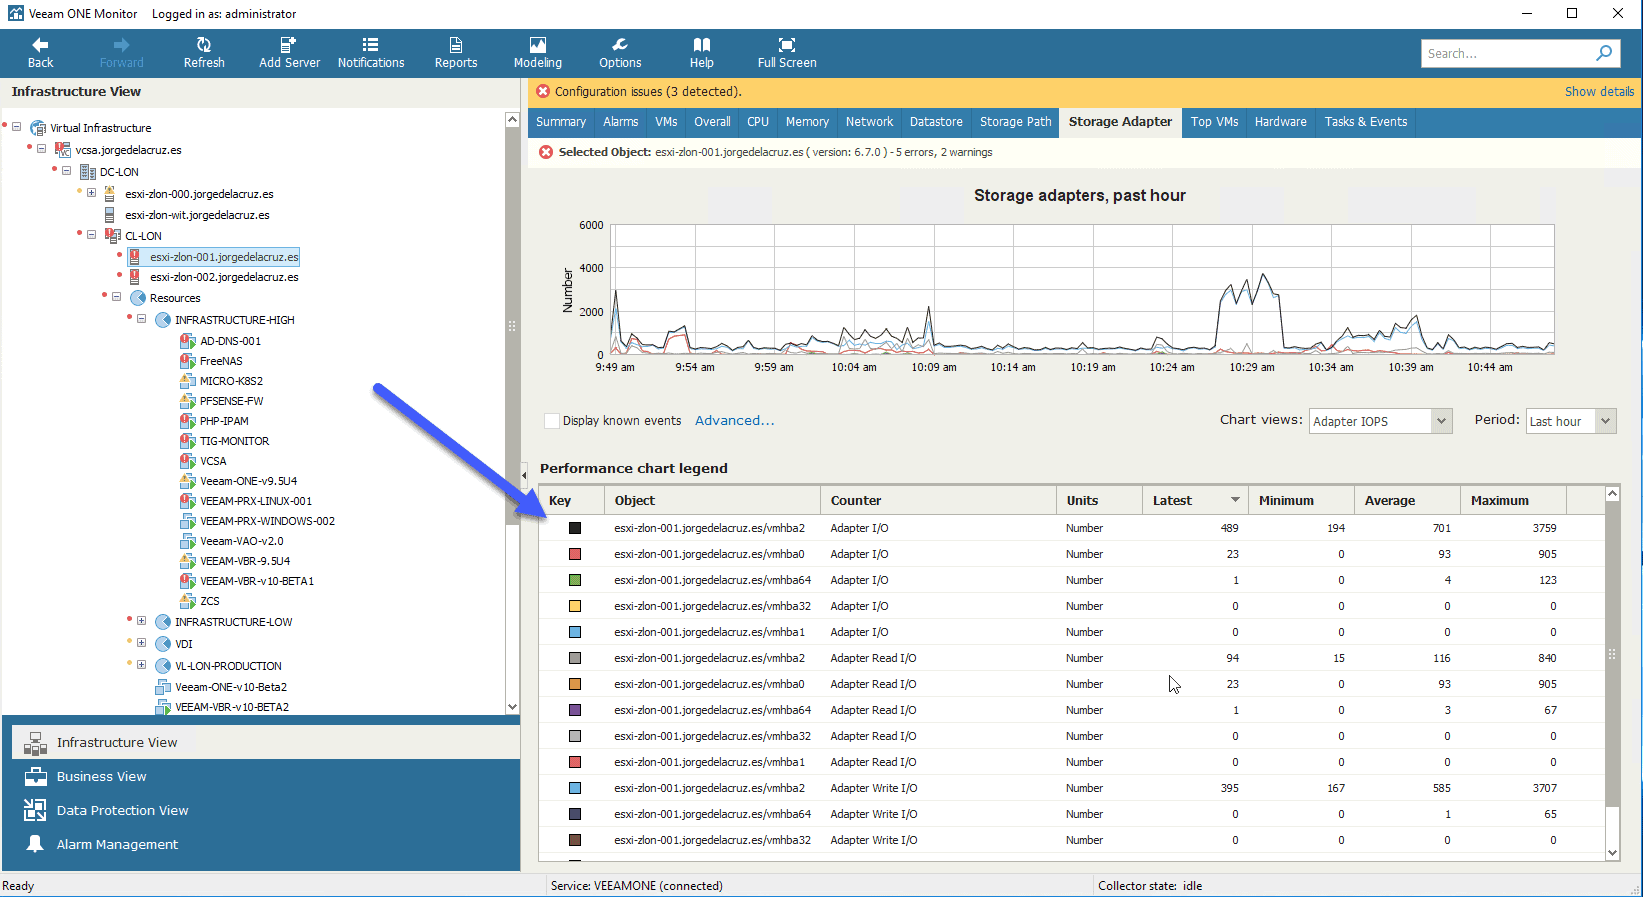 Finally, we can go to Hardware to check values such as ESXi servers temperature, voltage, and in general all critical values of the system and its environment:
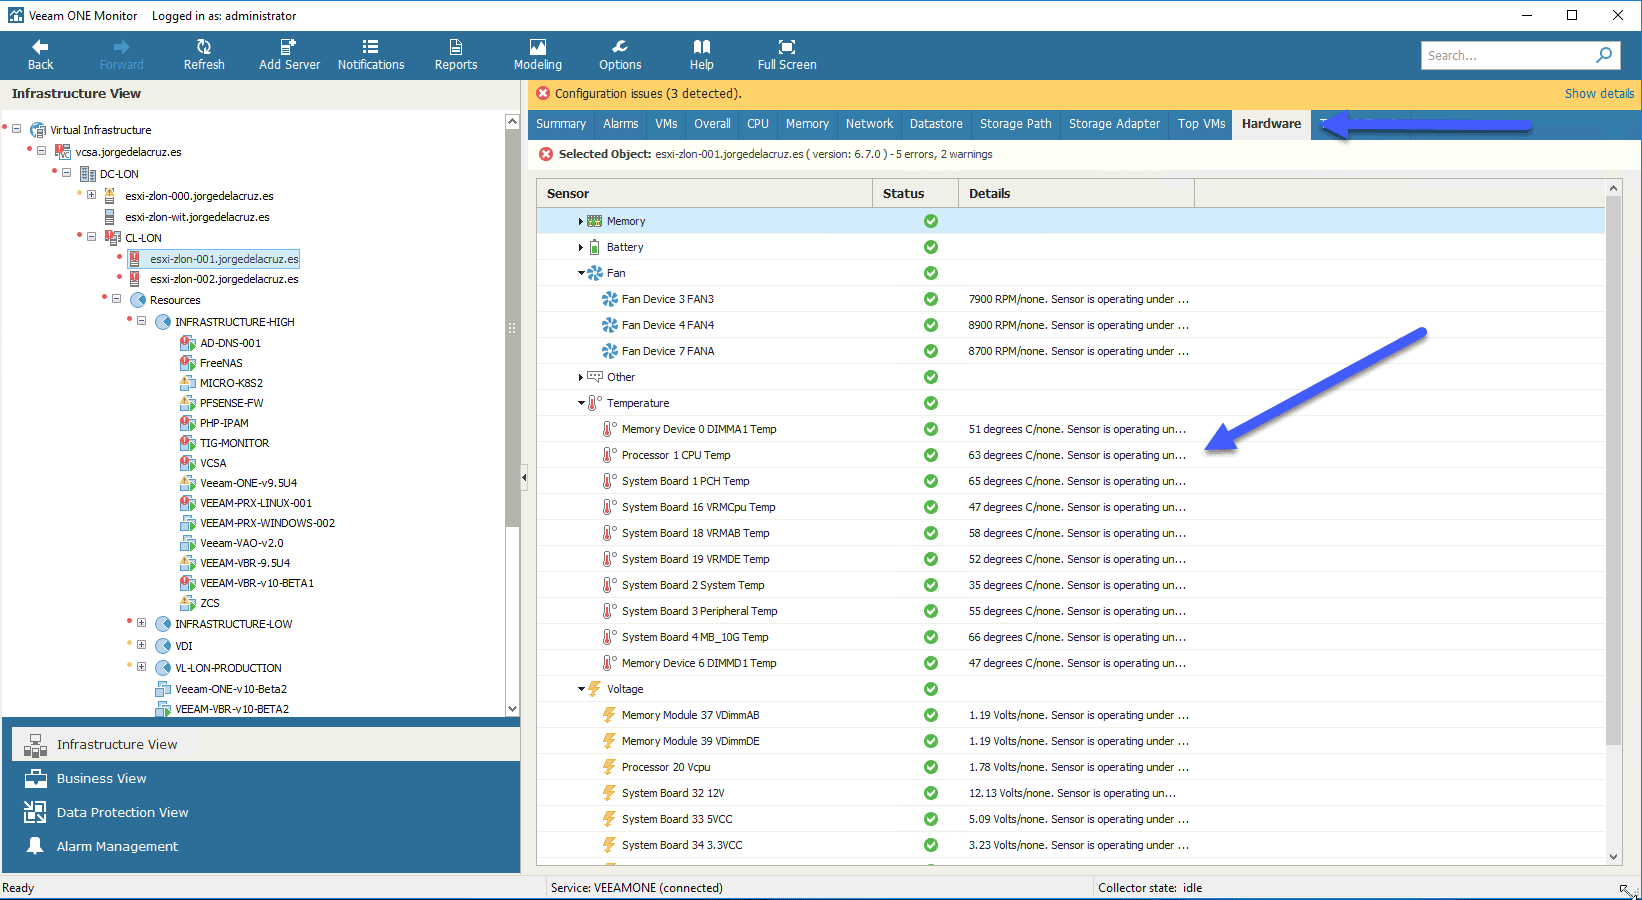 With all this debugging of the ESXi, let’s move on to debugging
Troubleshooting by Datastore
At the Datastore level, the truth is that there are not many options beyond the most important ones, such as this look at the disk used in the Datastore: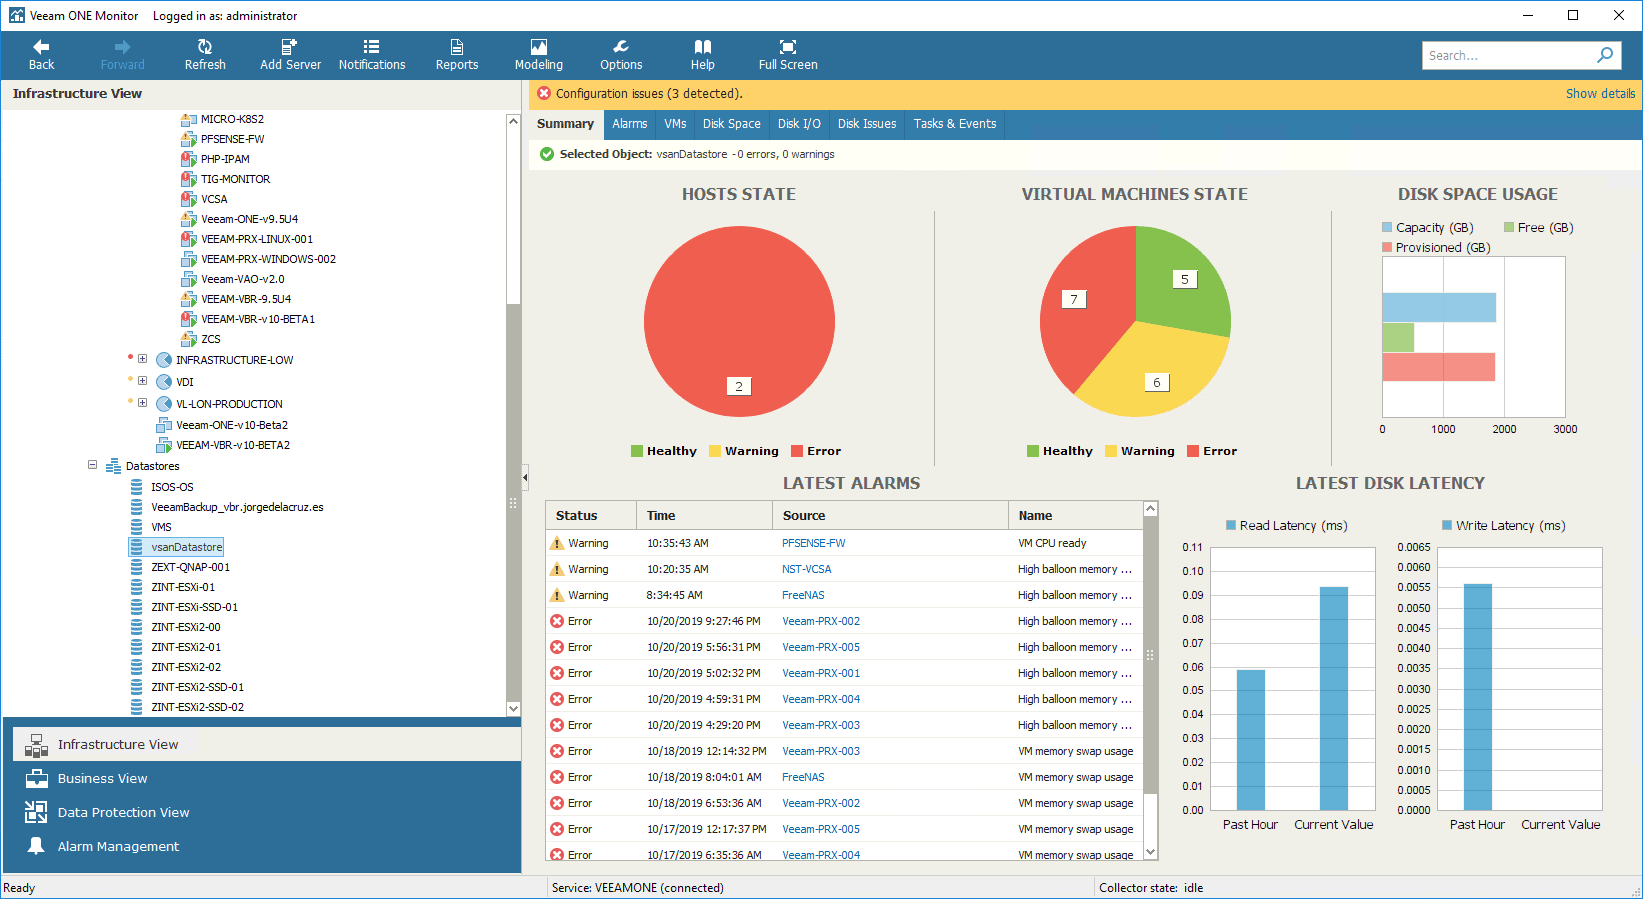 As well as the Disk I/O tab, which is where we can play with the graph and order by VM, or many more values that we can stack, very interesting:
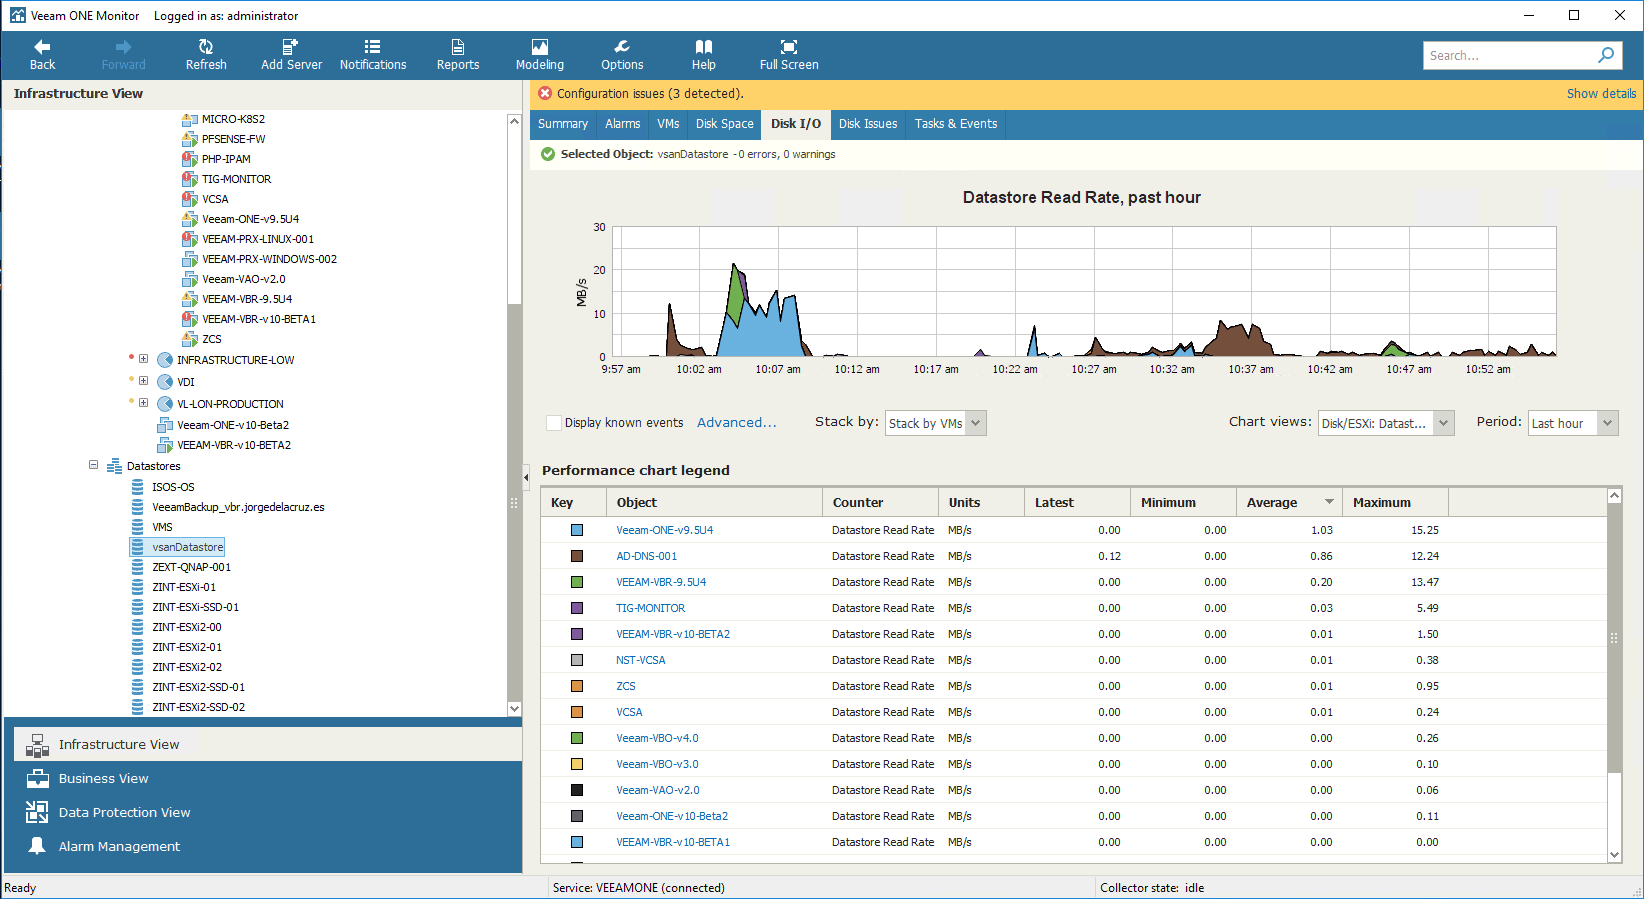 I leave you the list of all the articles that correspond to this interesting series about Veeam ONE as our monitoring and reporting system:
- Looking for the Perfect Dashboard: Veeam ONE – Part I – Introduction to Veeam ONE
- Looking for the Perfect Dashboard: Veeam ONE – Part II – Download and Install Veeam ONE
- Looking for the Perfect Dashboard: Veeam ONE – Part III – Adding a VMware vSphere Infrastructure to Veeam ONE
- Looking for the Perfect Dashboard: Veeam ONE – Part IV – Adding a Veeam Backup and Replication Infrastructure to Veeam ONE
- Looking for the Perfect Dashboard: Veeam ONE – Part V – Troubleshooting vSphere using Veeam ONE Monitor
- Looking for the Perfect Dashboard: Veeam ONE – Part VI – Troubleshooting Veeam Backup and Replication using Veeam ONE Monitor
- Looking for the Perfect Dashboard: Veeam ONE – Part VII – Dashboards at a Glance in the Veeam ONE Reporter
- Looking for the Perfect Dashboard: Veeam ONE – Part VIII – In-depth look at Reports in Veeam ONE Reporter
- Looking for the Perfect Dashboard: Veeam ONE – Part IX – Chargeback to create cost reports of our Infrastructure
Leave a Reply