
 Greetings friends, today we are going to see in detail, how the Backup Infrastructure Administrators do not get their fingers caught in the resources, and how to create reports that help them understand which environment is busiest.
Veeam ONE Heatmap – A quick look at how busy our environment is
One of the best bird’s eye views we have is the one called HEATMAP, which can be found in Veeam ONE Reports, in the Dashboards section. With a simple glance we can see that it is in amber or red, besides being able to see it by each component of the Infrastructure: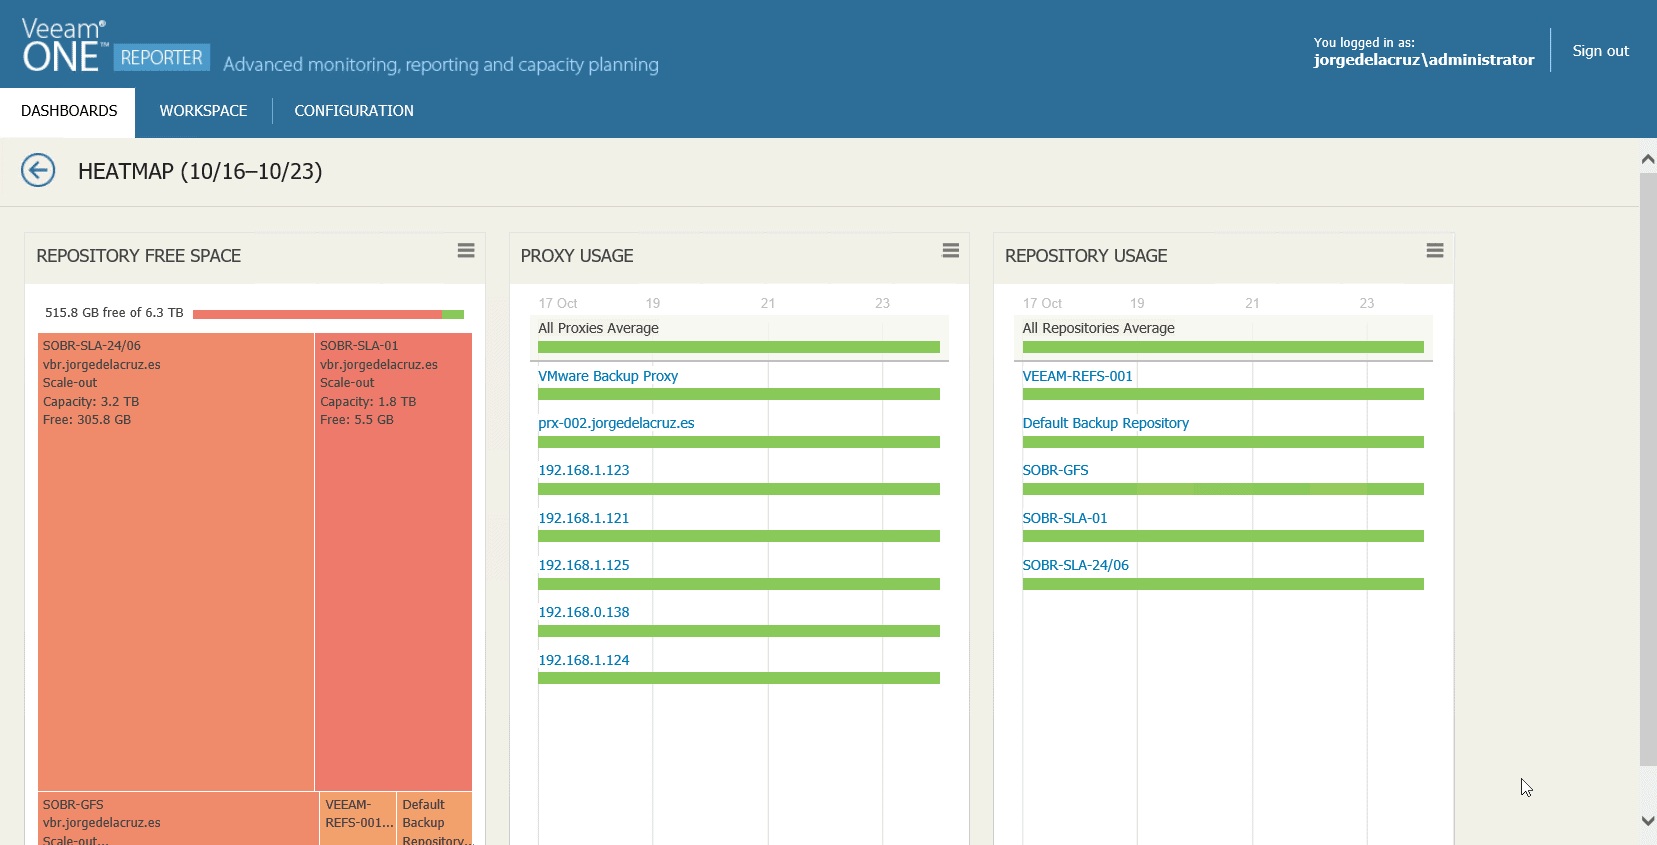 For example, here I have expanded all my Proxies, to check with surprise that they are all in green, which means that we don’t have any node more loaded than another one.
 In this view, I have expanded a Proxy, where we see the exact load level for each hour, with the concurrent jobs it has, and the name of them, and also I have expanded a Repository to check that sometimes it is starting to be used a little more because the color differs from green:
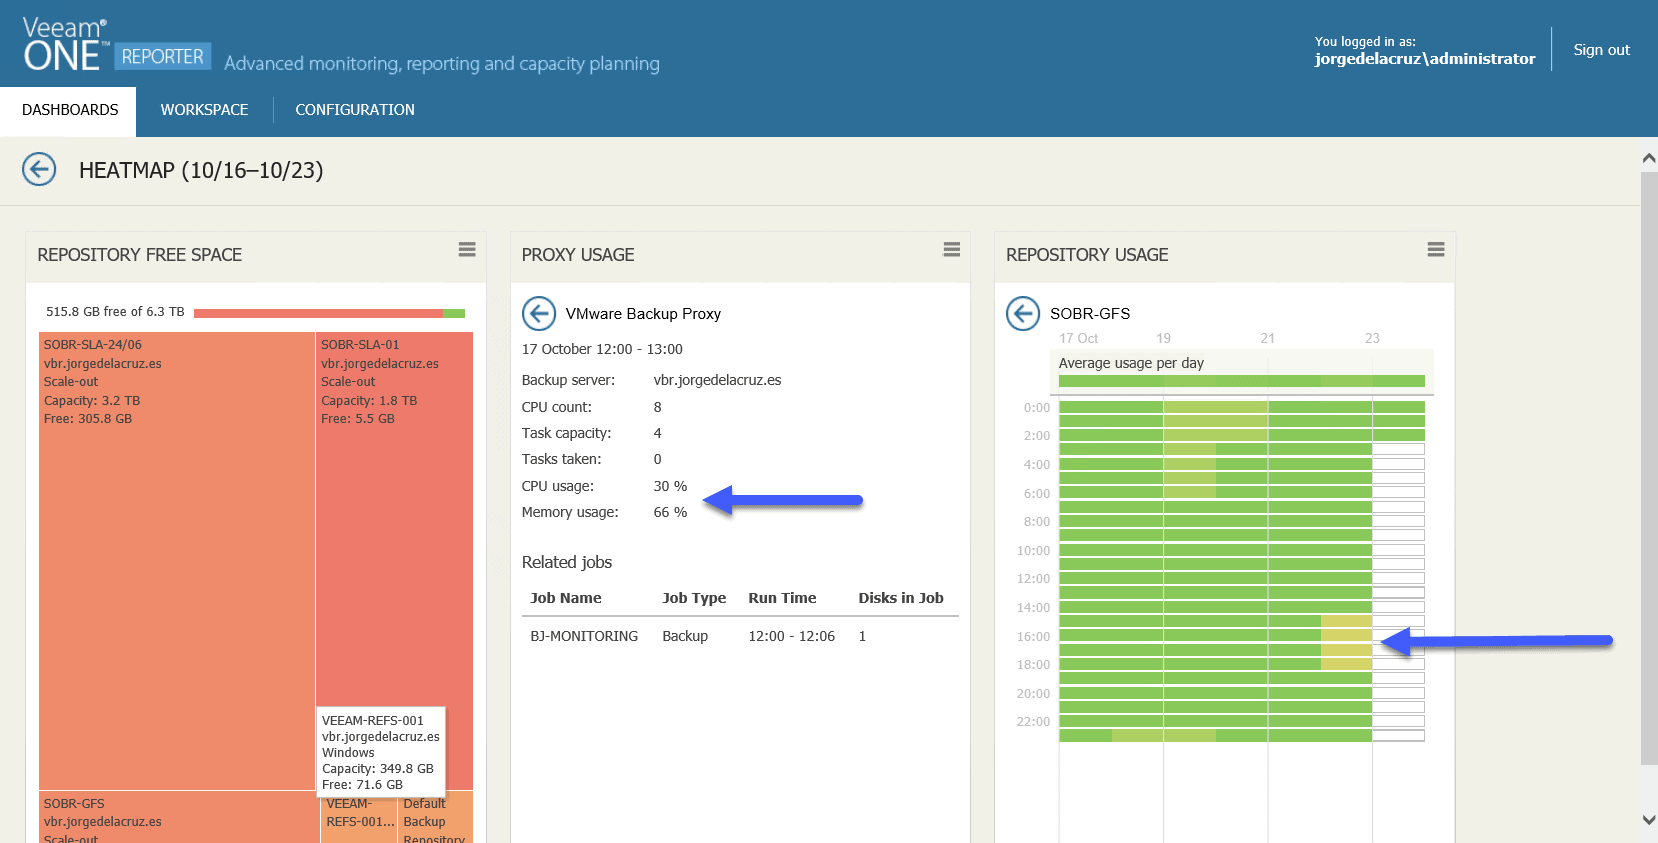
Veeam ONE Monitor – Data Protection View
Another way to check the status of both Proxies and Repositories and have Capacity Planning is using Veeam ONE Monitor, in the Data Protection View section, for example, let’s start with the Proxies, we can see the number of processor disks per week, per day, GB transferred, and Backup Window:
The same thing but if we move to the monthly summary tab, we will be able to see all the details gathered in a whole month: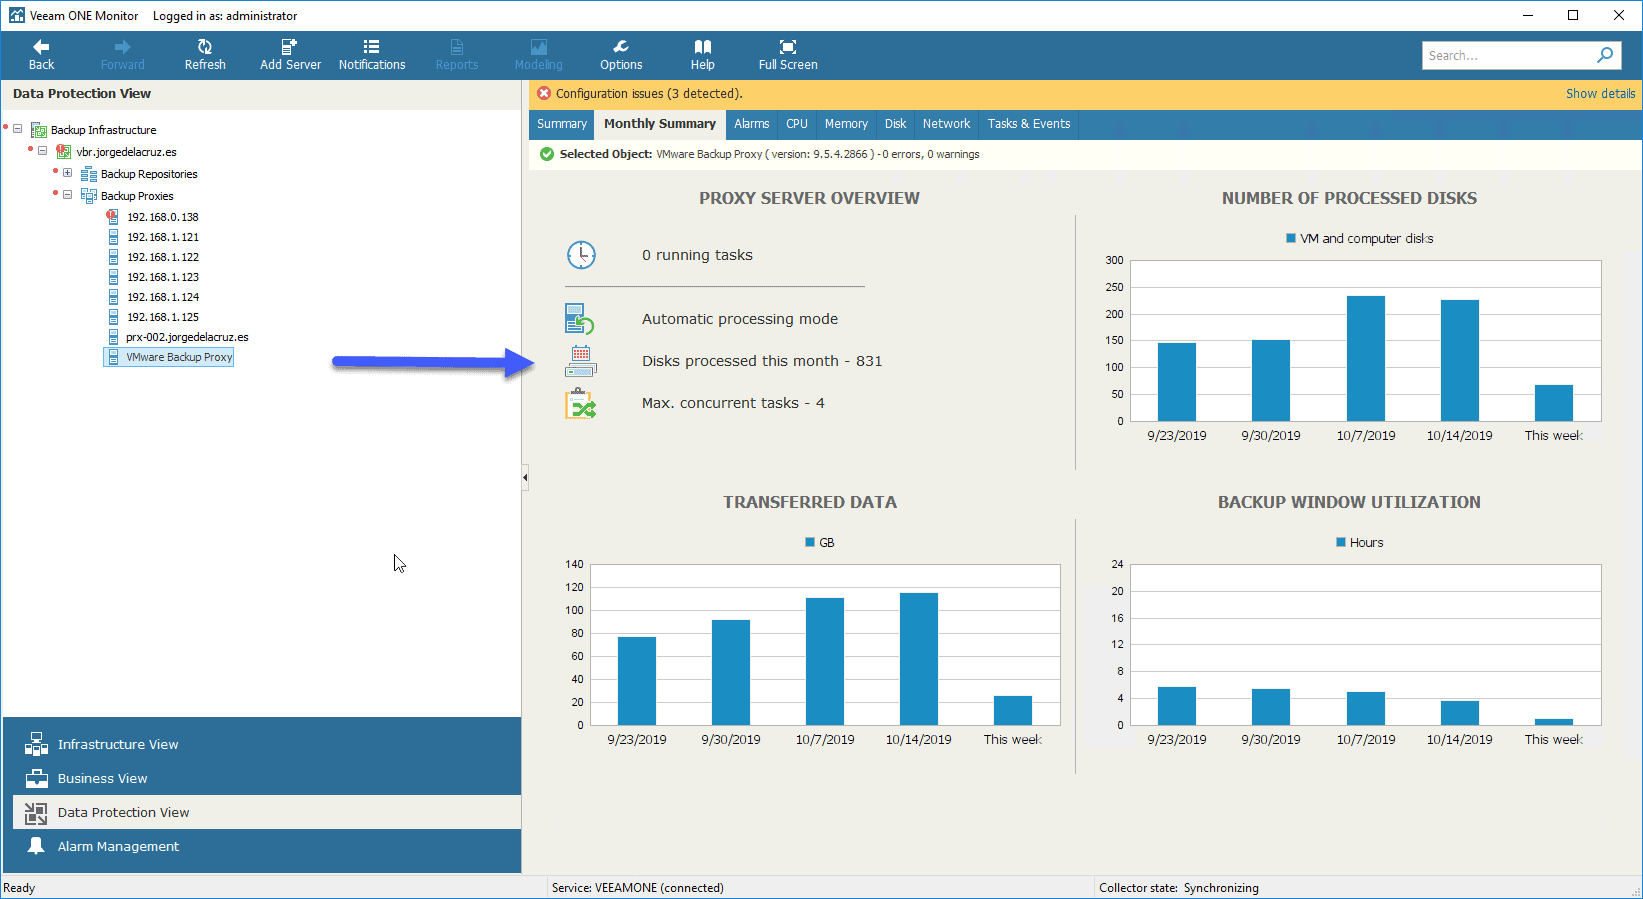 Finally, we should highlight the quick look we can give to the CPU and RAM by the Proxies, very useful to detect bottlenecks:
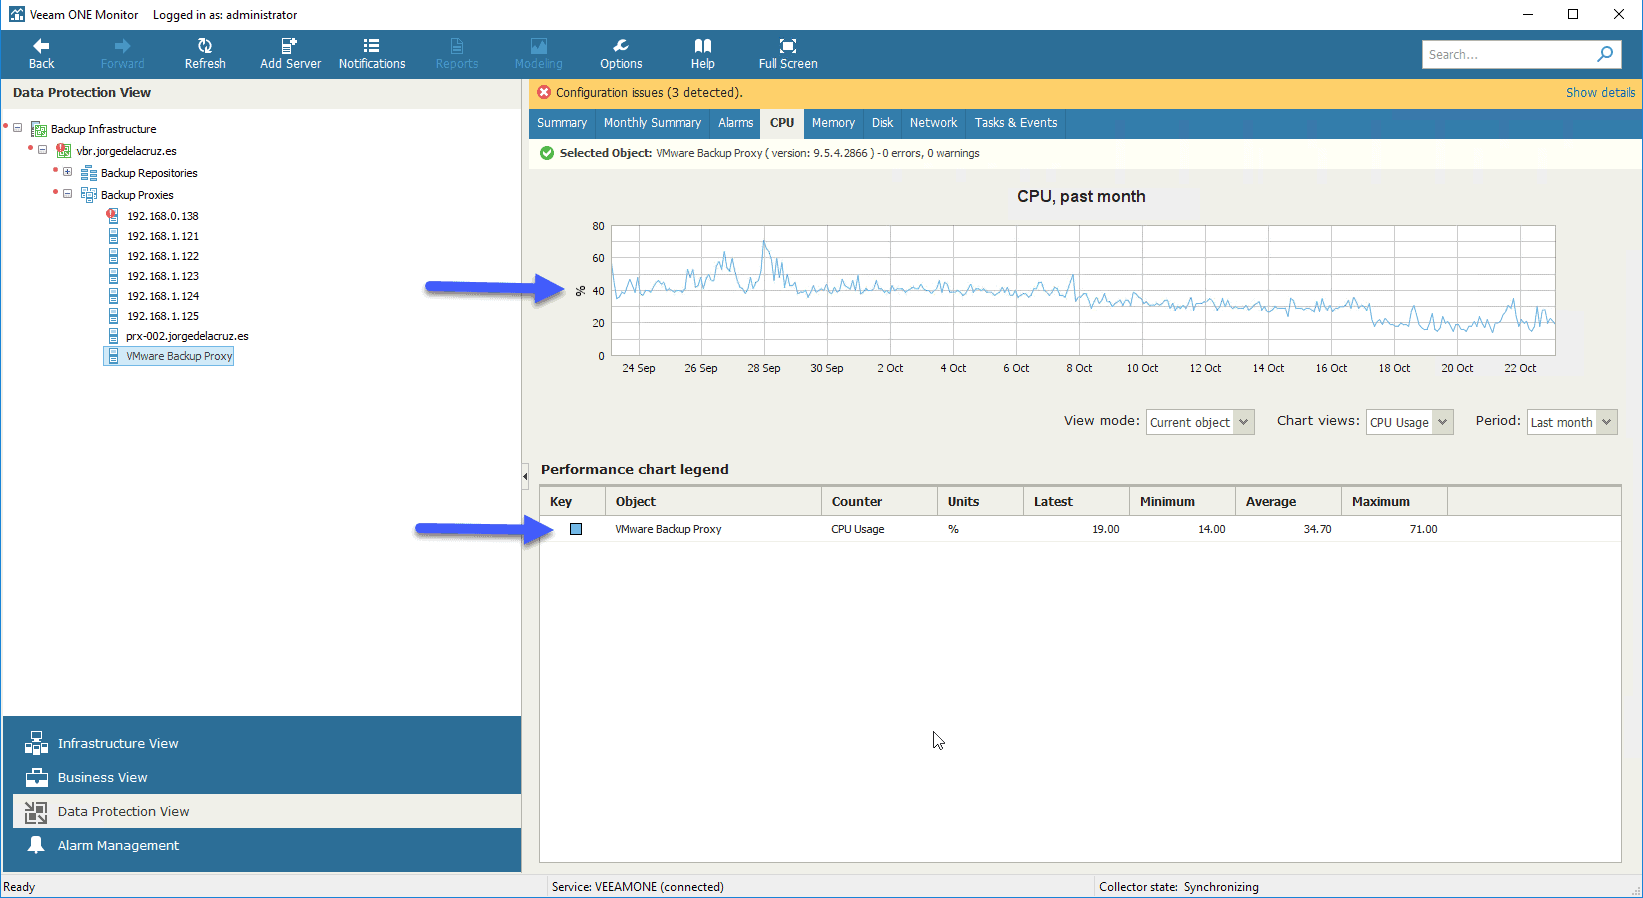 All this is perfect and will help us to know the status of the Proxies.
If we are going to take a look at the Backup Repositories, we will find the following, a look at the SOBR, or for each repository, will show us the total full and incremental space they have, besides the SOBR policy, and a Capacity Planning that will help us a lot to add more disk in case we need it: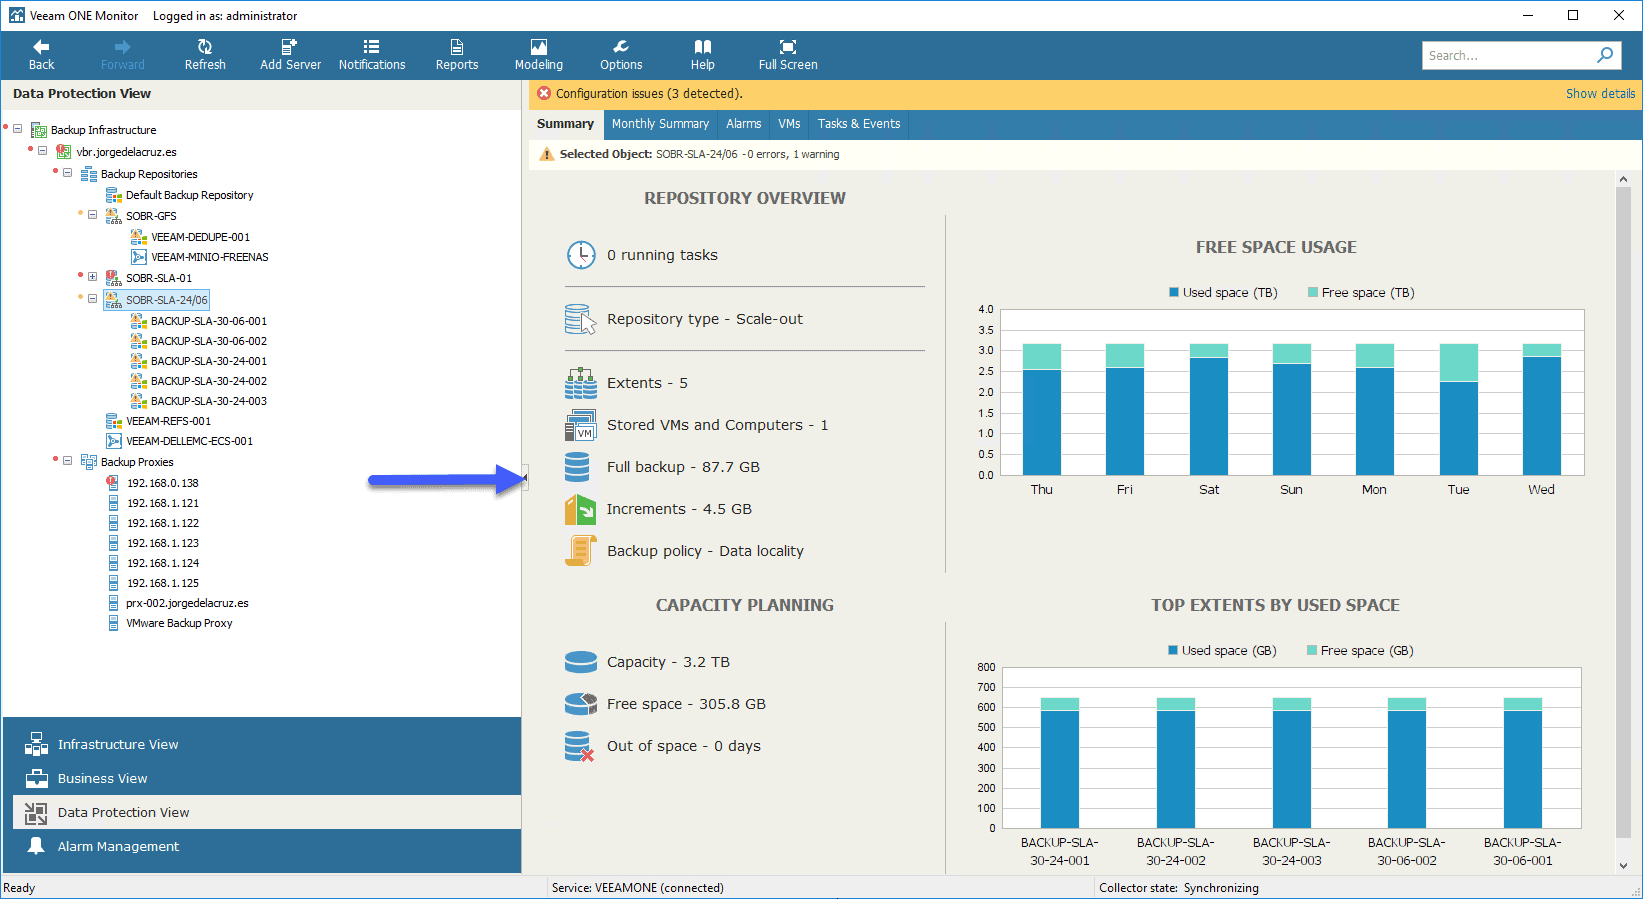 In addition, we will be able to see which VMs are inside each Repository, and how many restore points they have, and to which job they are associated:
 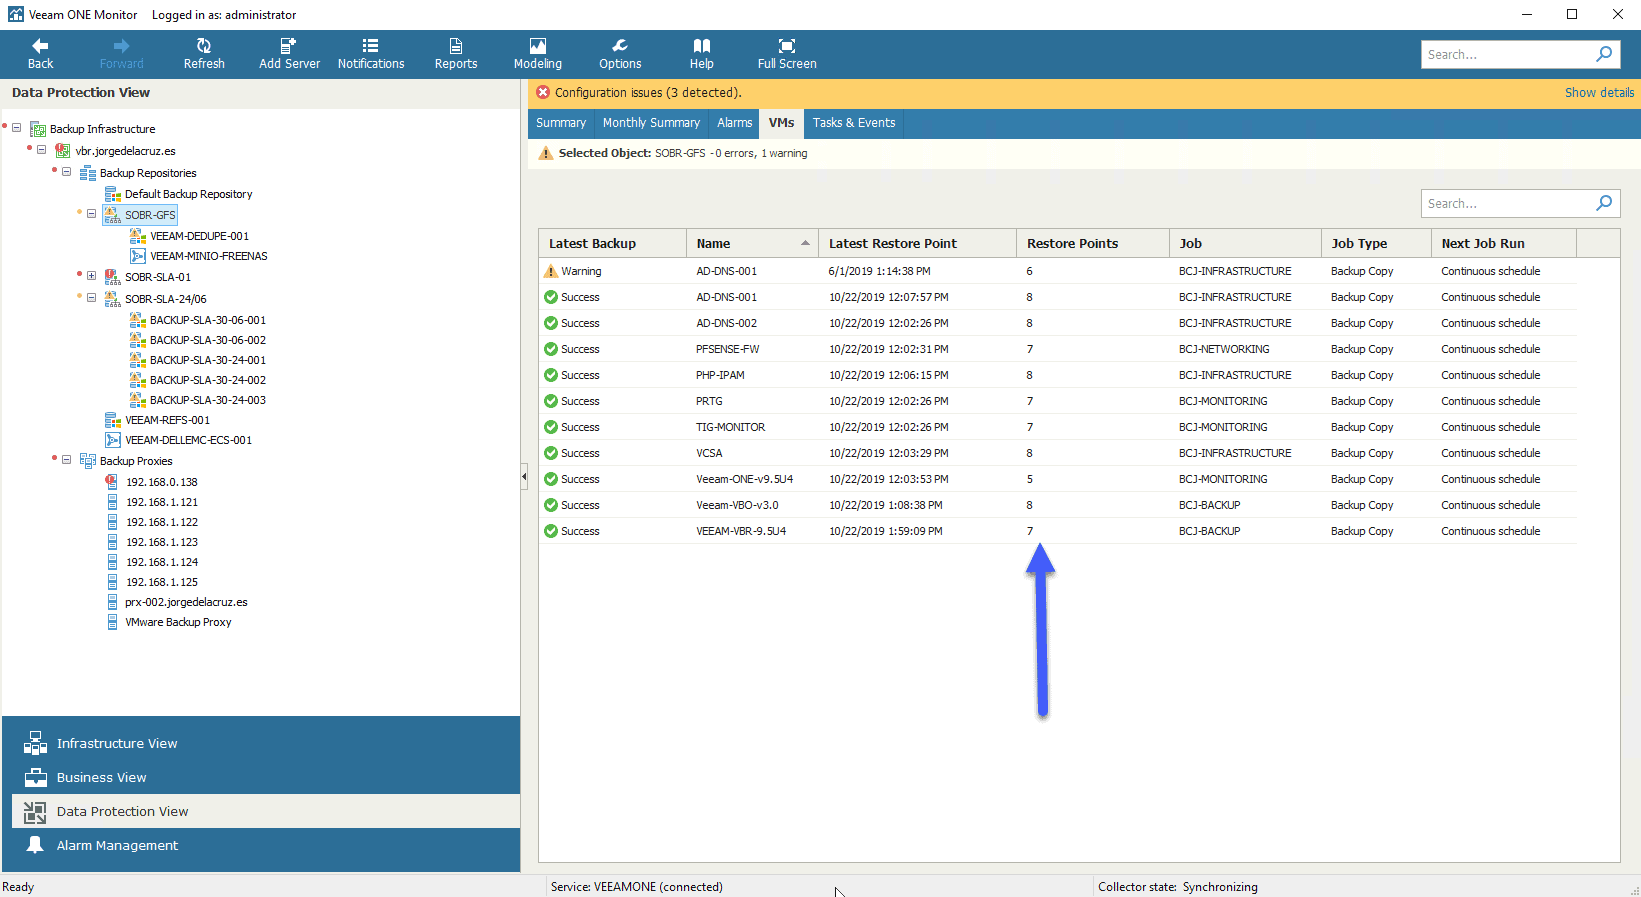 Finally, mention that Veeam ONE also shows us the consumption of the Capacity Tier Veeam Backup Repositories:
 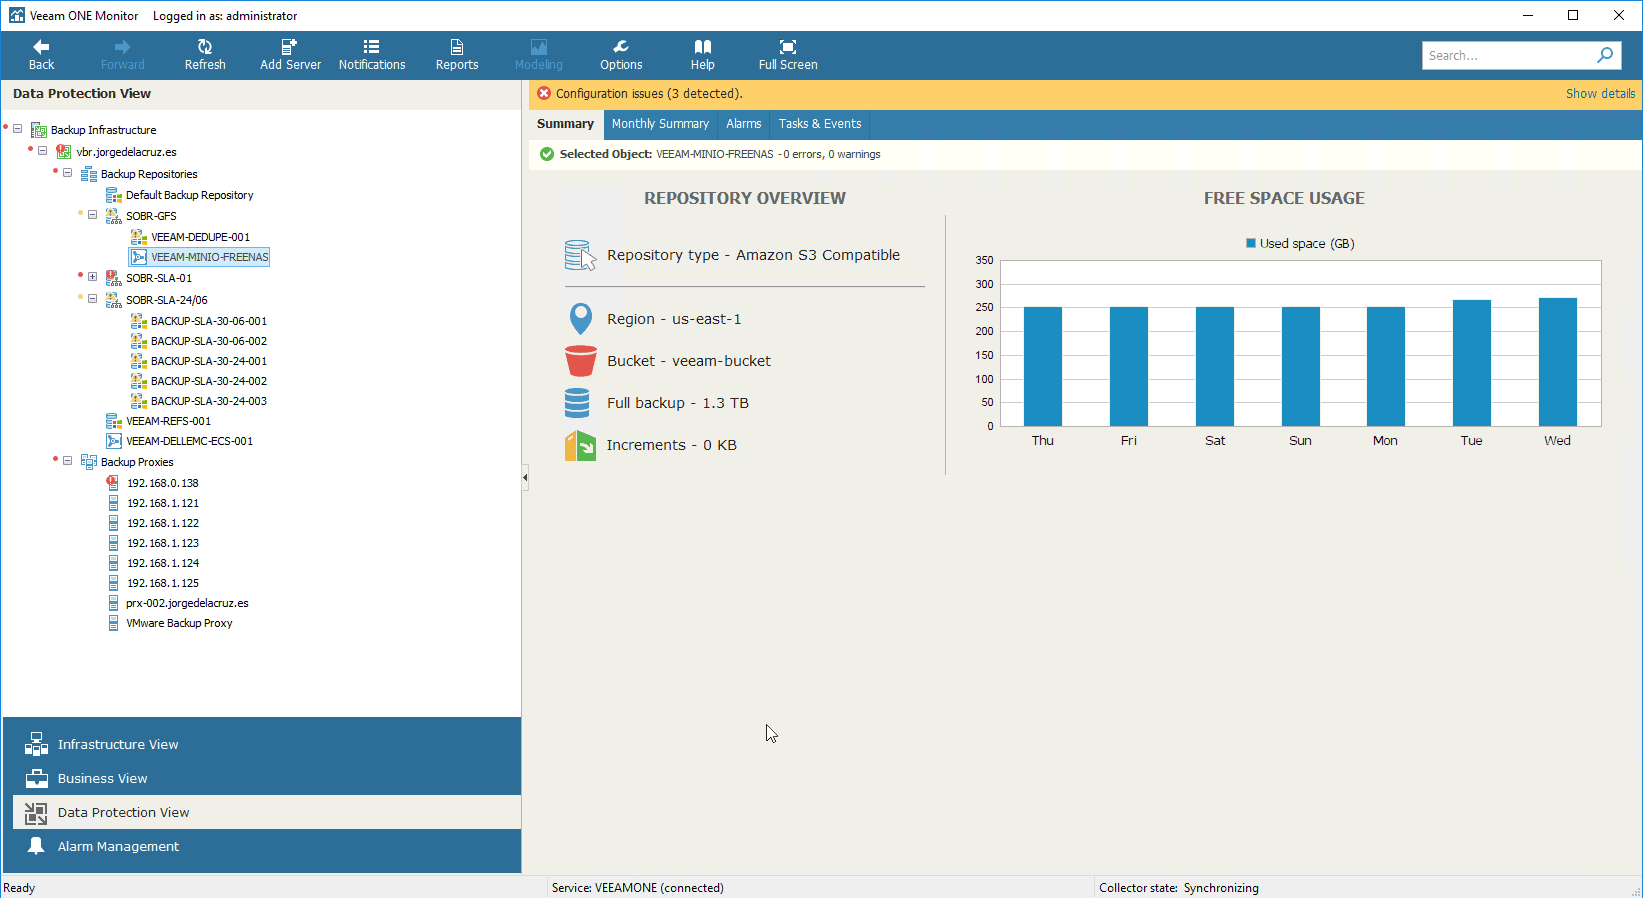 With all this, Veeam ONE Monitor becomes a great ally to help us with the monitoring of Veeam Backup & Replication.
Veeam ONE Custom Report – Backup Infrastructure Custom Data
Let’s take another look at the Reports part, this time using the custom reports, which I like so much from Veeam ONE, we’ll go to Custom Reports, and select Backup Infrastructure Custom Data: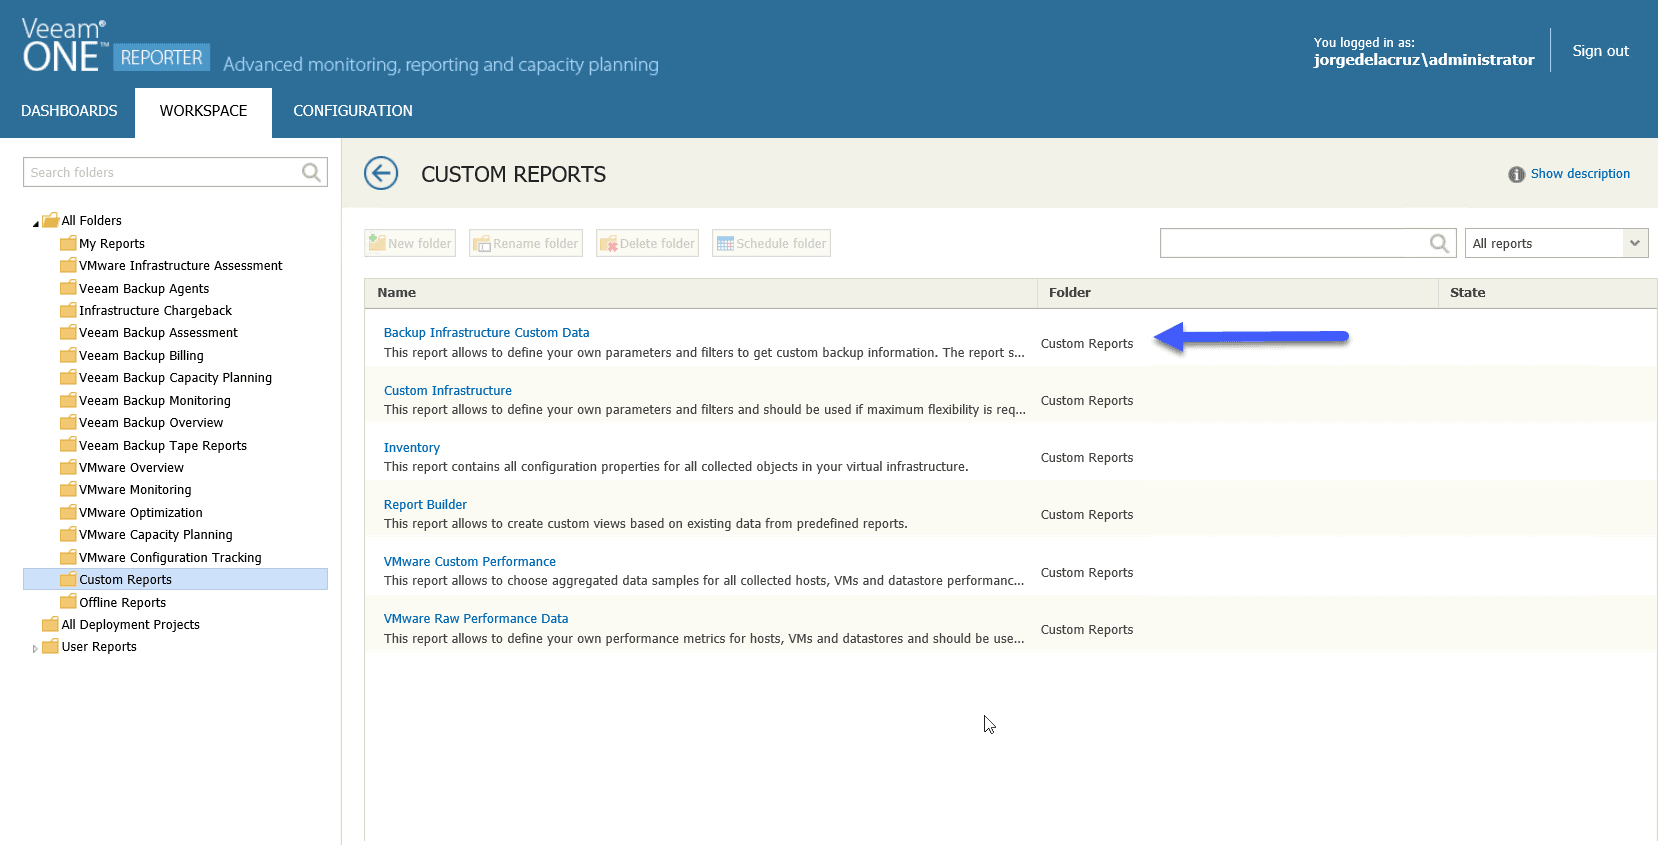
We’ll select that we want the Backup Jobs report, and we’ll click on Columns: 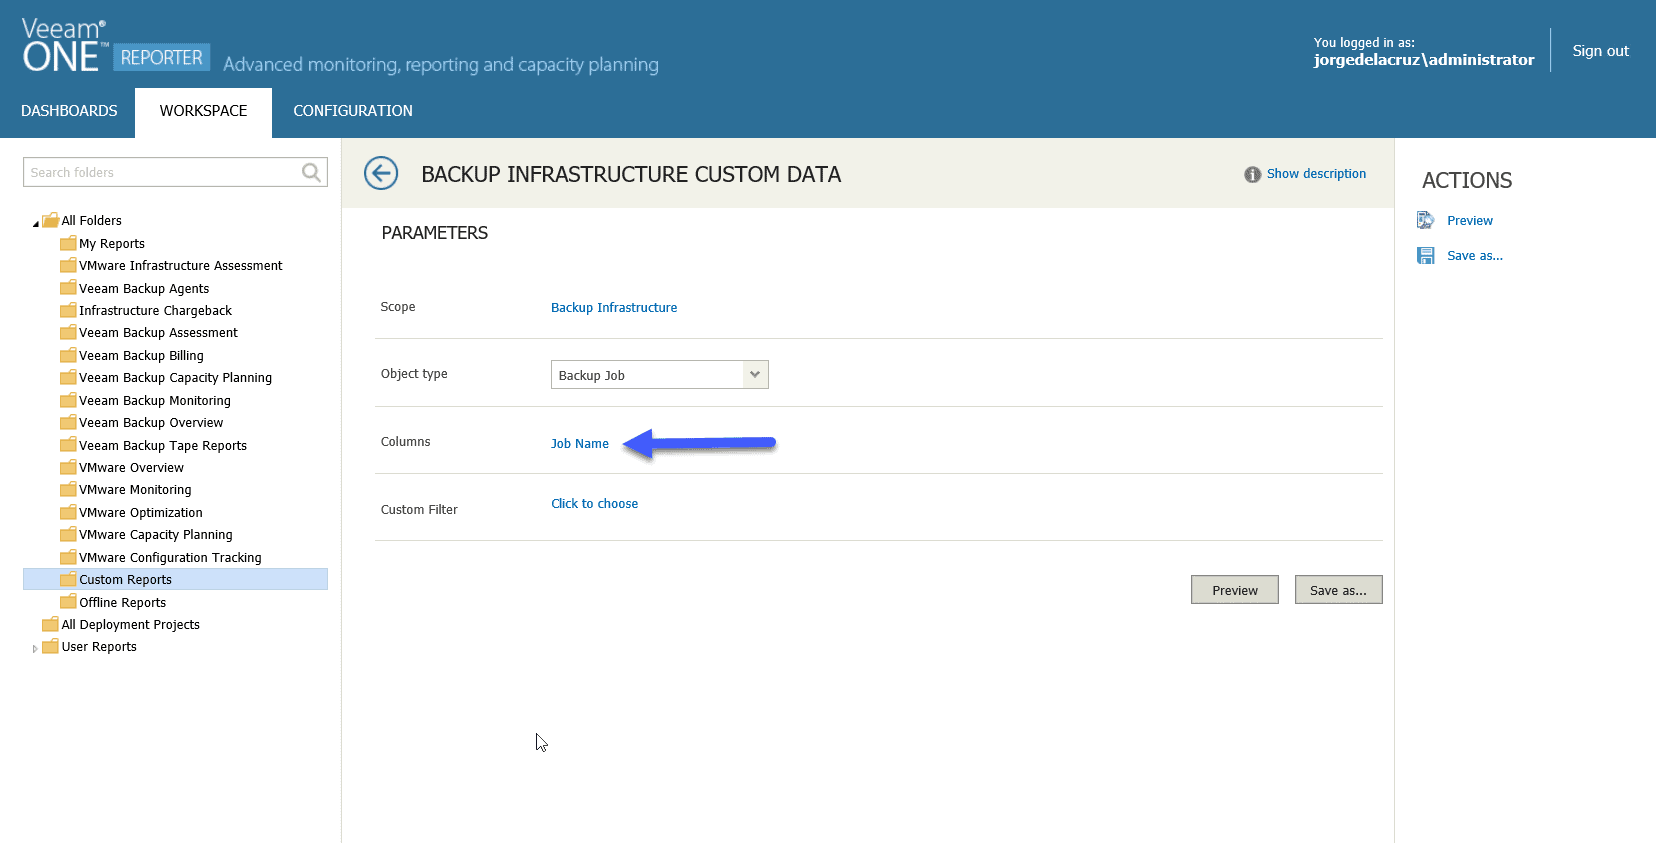 Apart from the Job Name, I’ve indicated that I want extra columns, you can see them in the image:
 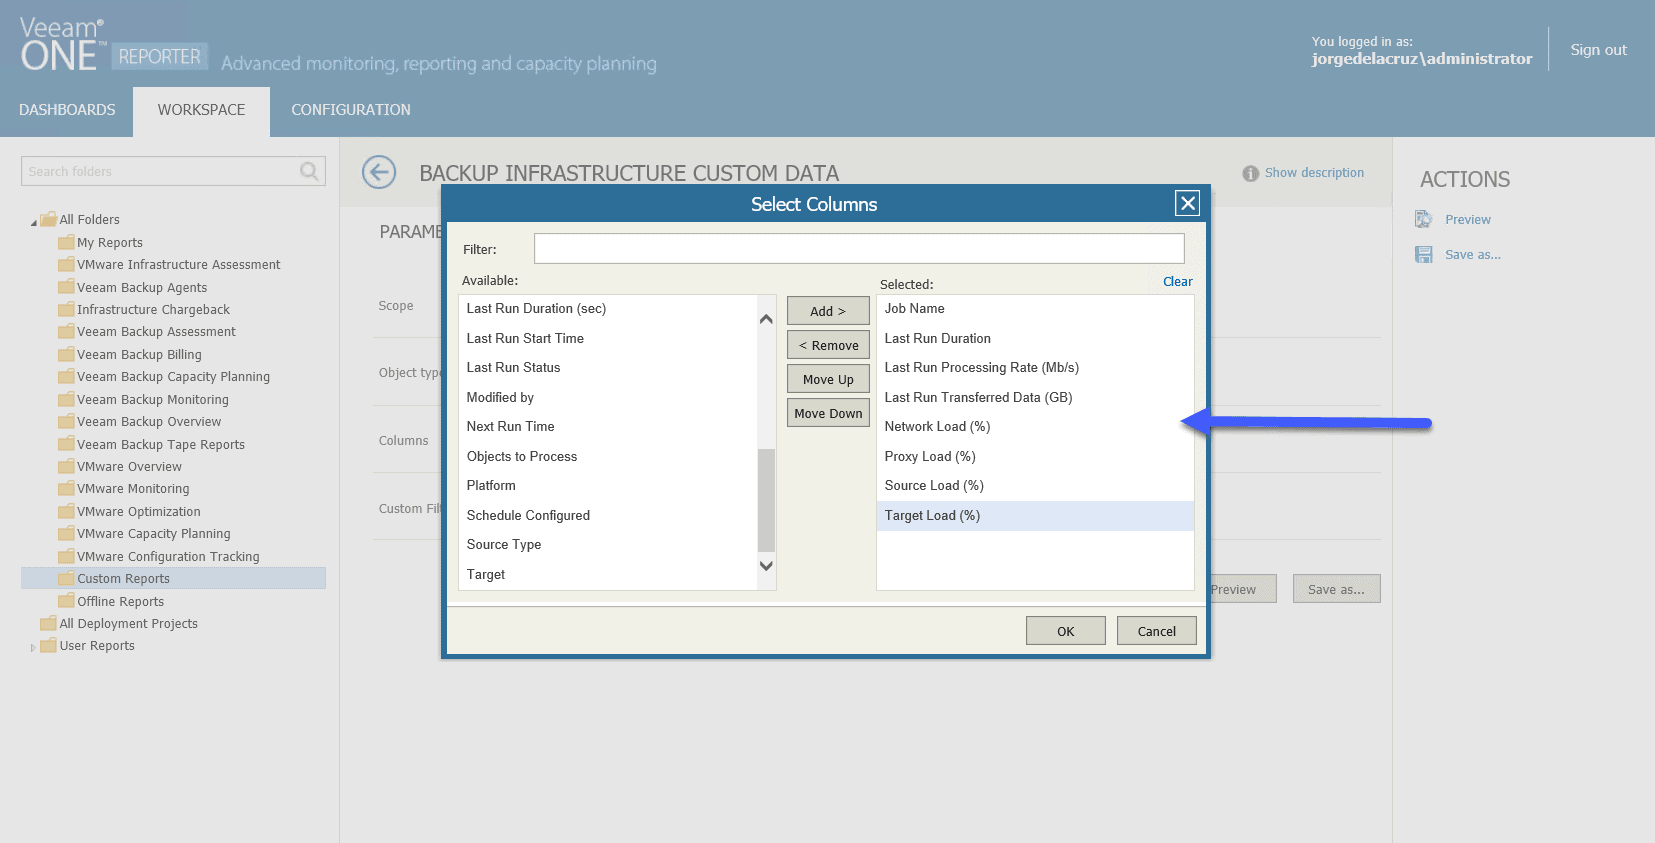 This has generated a very elegant report about each Job, where I can see at a bird’s eye view which jobs are having bottlenecks and in which component they have it, so I can solve it later:
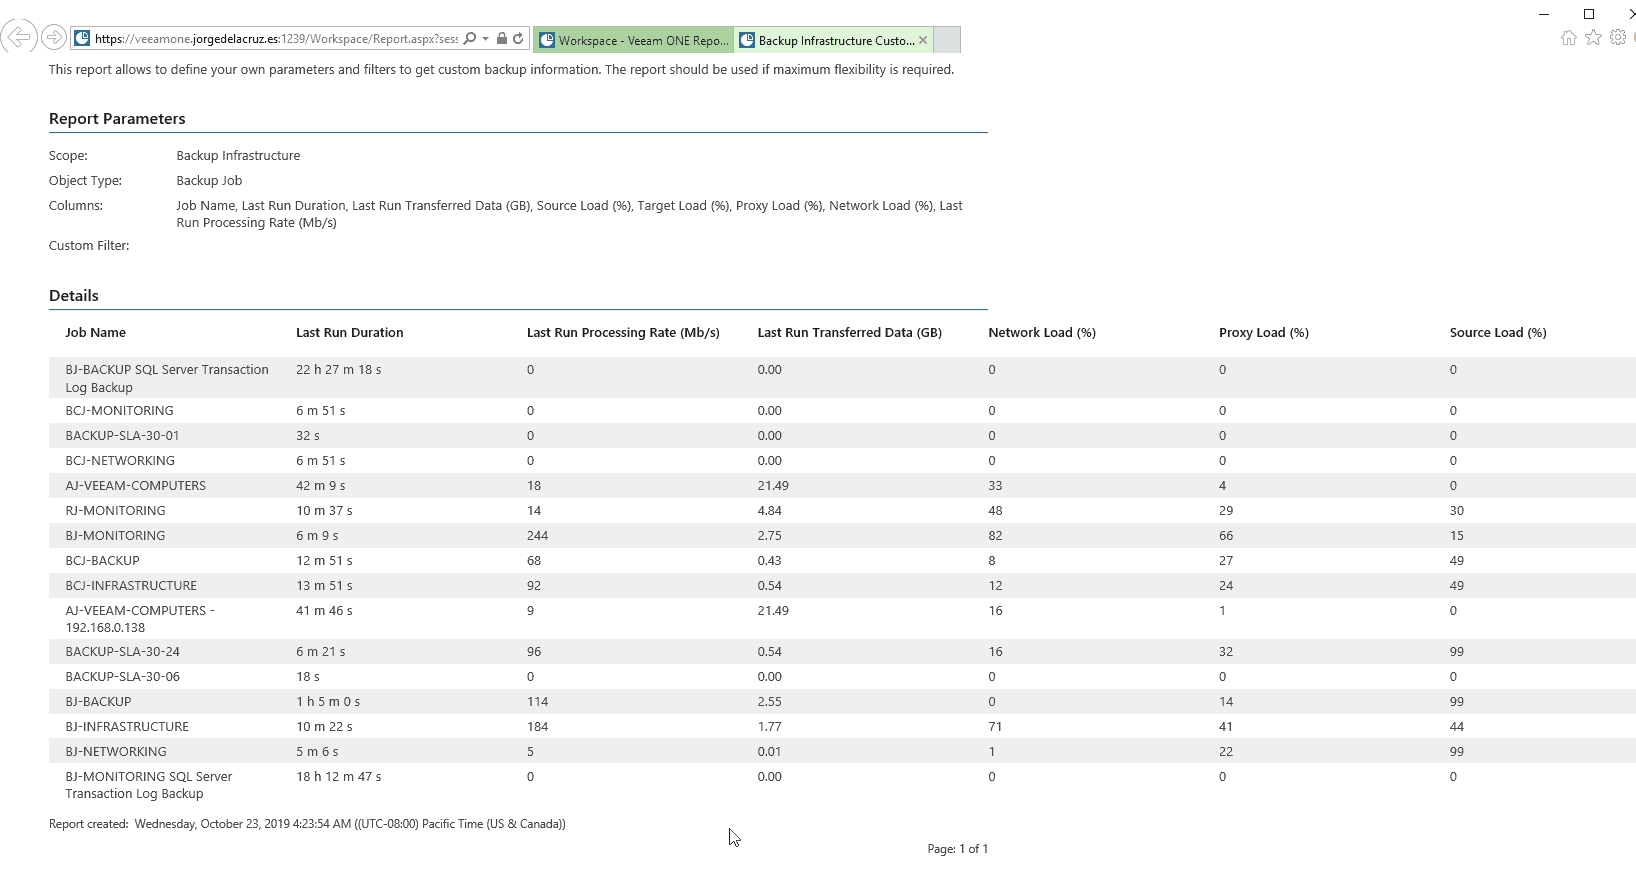 I leave you the list of all the articles that correspond to this interesting series about Veeam ONE as our monitoring and reporting system:
- Looking for the Perfect Dashboard: Veeam ONE – Part I – Introduction to Veeam ONE
- Looking for the Perfect Dashboard: Veeam ONE – Part II – Download and Install Veeam ONE
- Looking for the Perfect Dashboard: Veeam ONE – Part III – Adding a VMware vSphere Infrastructure to Veeam ONE
- Looking for the Perfect Dashboard: Veeam ONE – Part IV – Adding a Veeam Backup and Replication Infrastructure to Veeam ONE
- Looking for the Perfect Dashboard: Veeam ONE – Part V – Troubleshooting vSphere using Veeam ONE Monitor
- Looking for the Perfect Dashboard: Veeam ONE – Part VI – Troubleshooting Veeam Backup and Replication using Veeam ONE Monitor
- Looking for the Perfect Dashboard: Veeam ONE – Part VII – Dashboards at a Glance in the Veeam ONE Reporter
- Looking for the Perfect Dashboard: Veeam ONE – Part VIII – In-depth look at Reports in Veeam ONE Reporter
- Looking for the Perfect Dashboard: Veeam ONE – Part IX – Chargeback to create cost reports of our Infrastructure
Leave a Reply