
 Greetings friends, today we are going to see in detail, how the Backup Infrastructure Administrators do not get their fingers caught in the resources, and how to create reports that help them understand which environment is busiest.
Veeam ONE Reporter – Dashboards give you a deep insight into your environment
You know that I have a certain passion for Dashboards, I have told you many times how to use other products to visualize your information in a simple and fast way.
In this series about Veeam ONE we have seen many important points about how to monitor your VMware vSphere and Veeam environment, and today comes the day to see the Dashboards in detail.
To access Veeam ONE Reporter from any modern browser, you can go to https://YOURVONEFQDN:1239 and enter your credentials: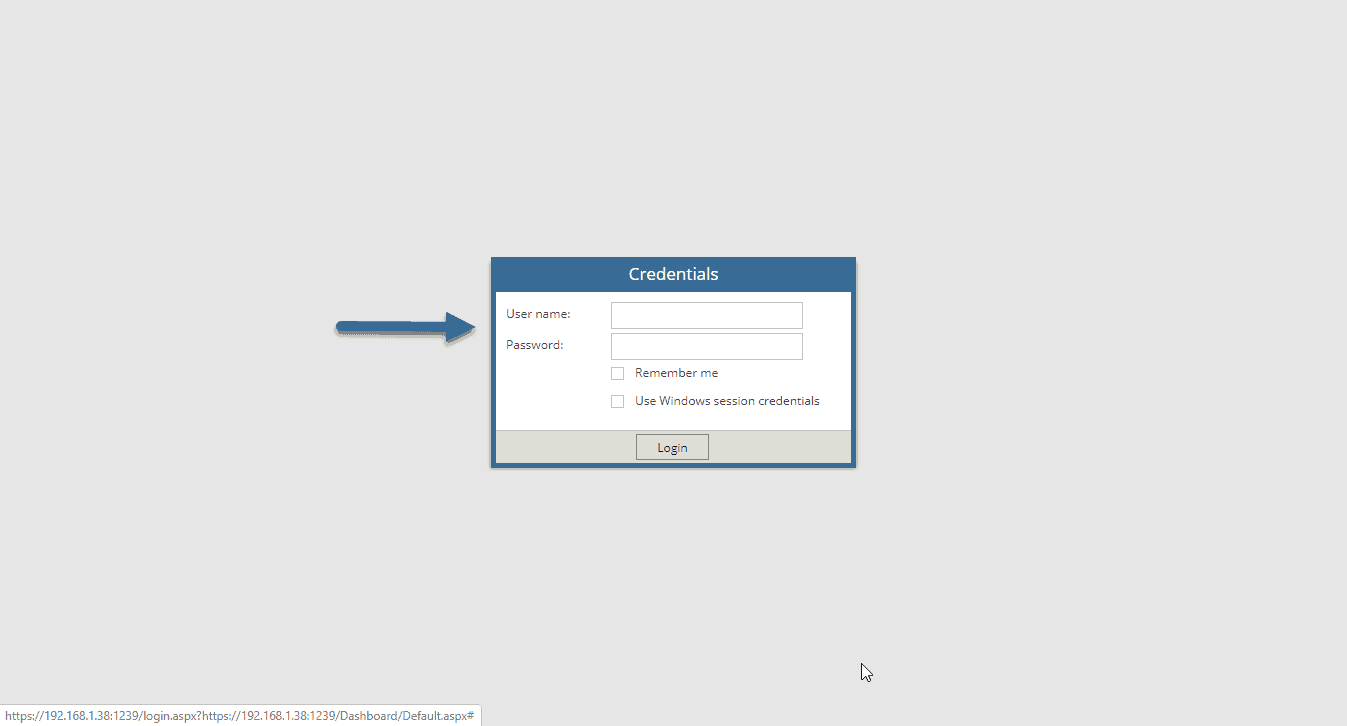 In an environment with vSphere together with Veeam Backup & Replication we’ll find nine default Dashboards, we’ll see some more if we had Hyper-V too:
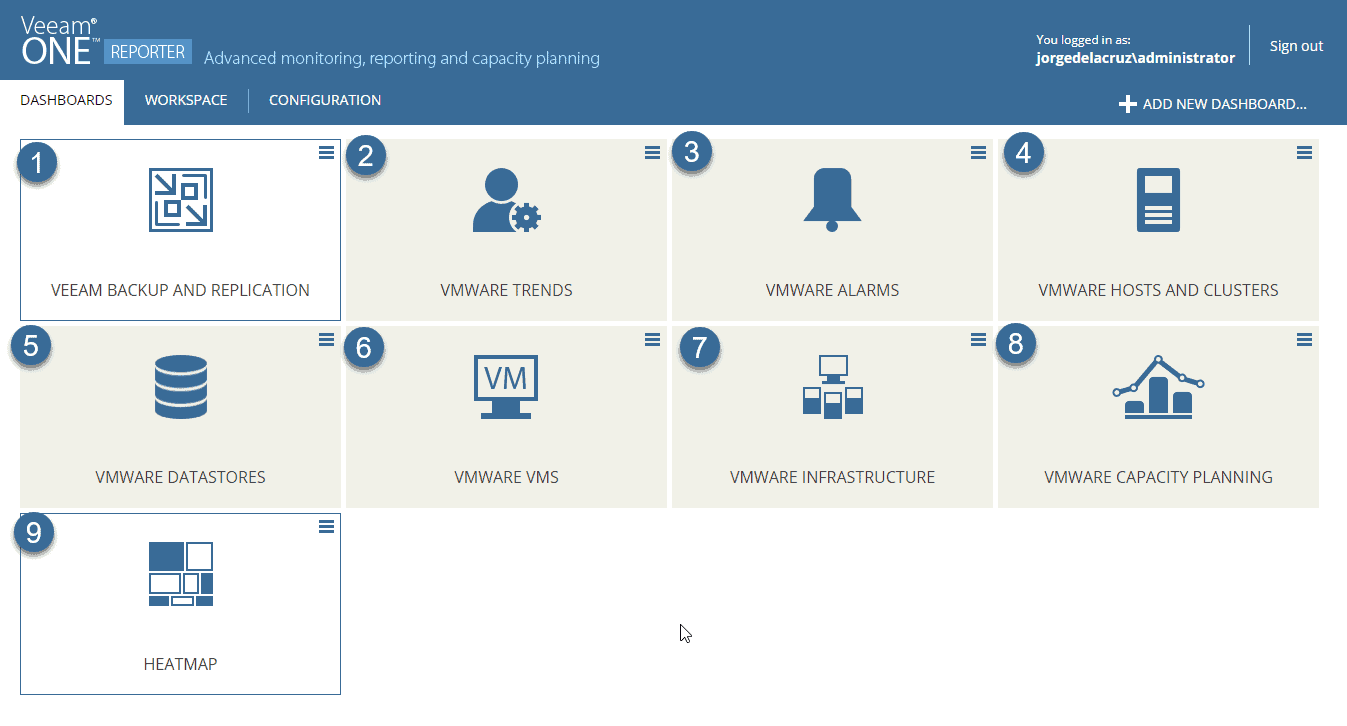 We’ll see them one by one in this interesting blog post.
1- Veeam Backup and Replication – Quick visualization about our Veeam Backup & Replication environment
The first Dashboard is one of the most interesting in my opinion, since it shows us very important information about our Veeam environment, among this very useful information, we find the backup window that the jobs are taking, besides seeing if all the jobs have been executed correctly, the section called Jobs Status, also shows us the status of the components of the Infrastructure.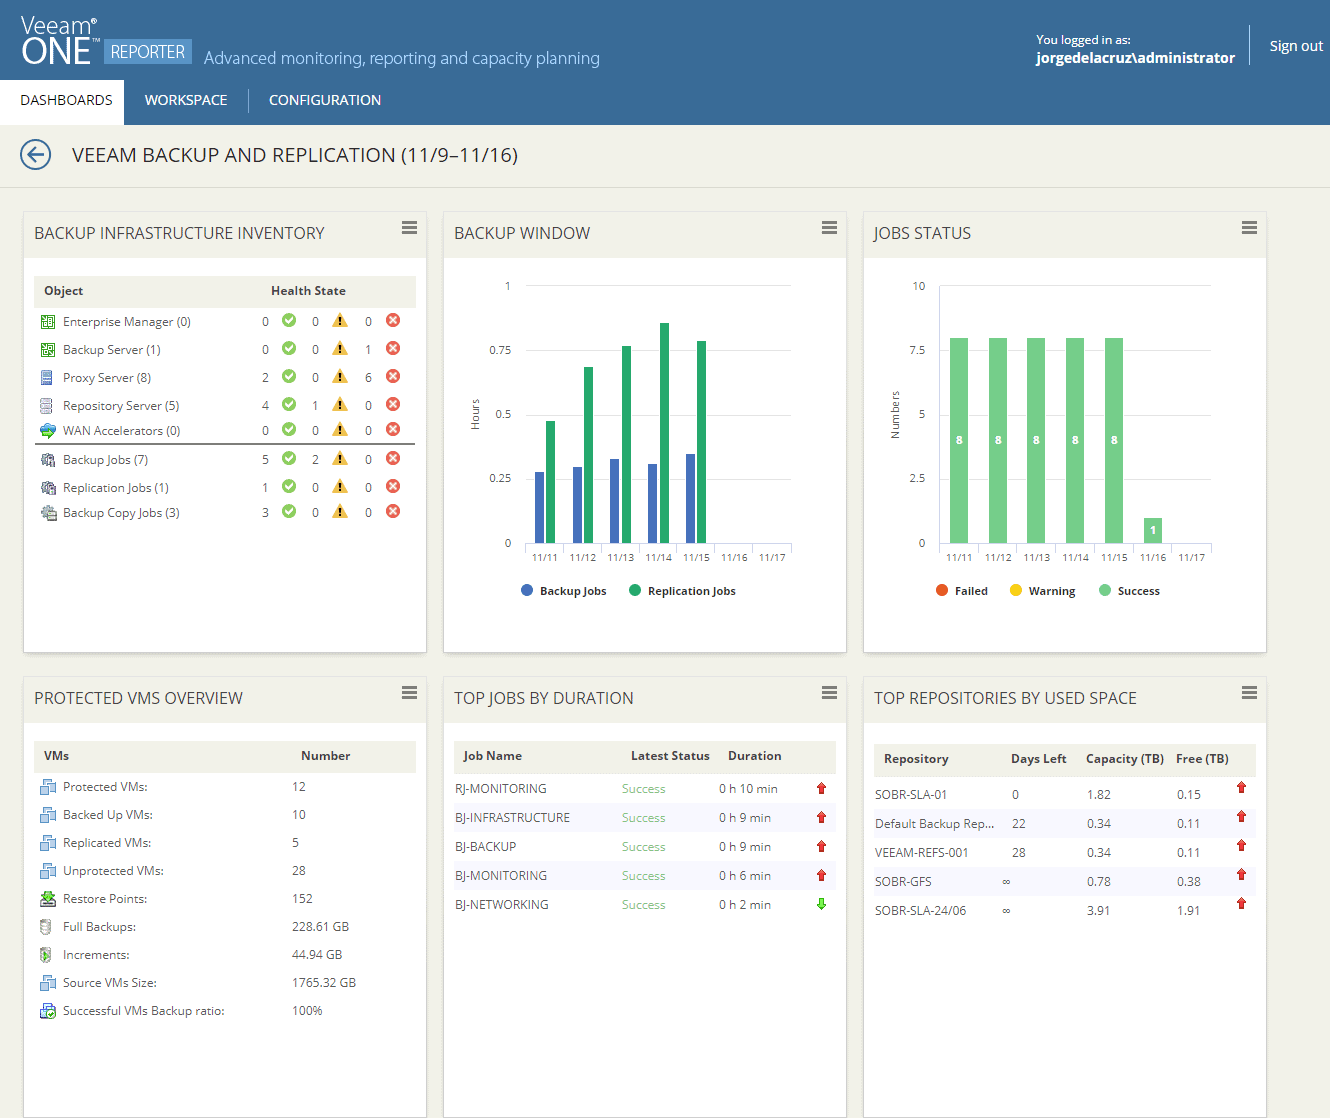 We will be able to see the total number of protected VMs, VMs with Backups, replicated VMs, restore points, size of the Full Backup and the incremental ones, besides knowing the total size of the VMs source, very important to know. You can also see the duration of each job in time, and the space consumed in each repository.
2- VMware Trends – Quick visualization of consumption trends in our vSphere environment
In this Dashboard, we will be able to observe the trends of consumption by different resources, for example, the trend of consumption of CPU by cluster per day, or RAM memory, and storage, besides seeing the growth in the number of VMs, and the uptime in %: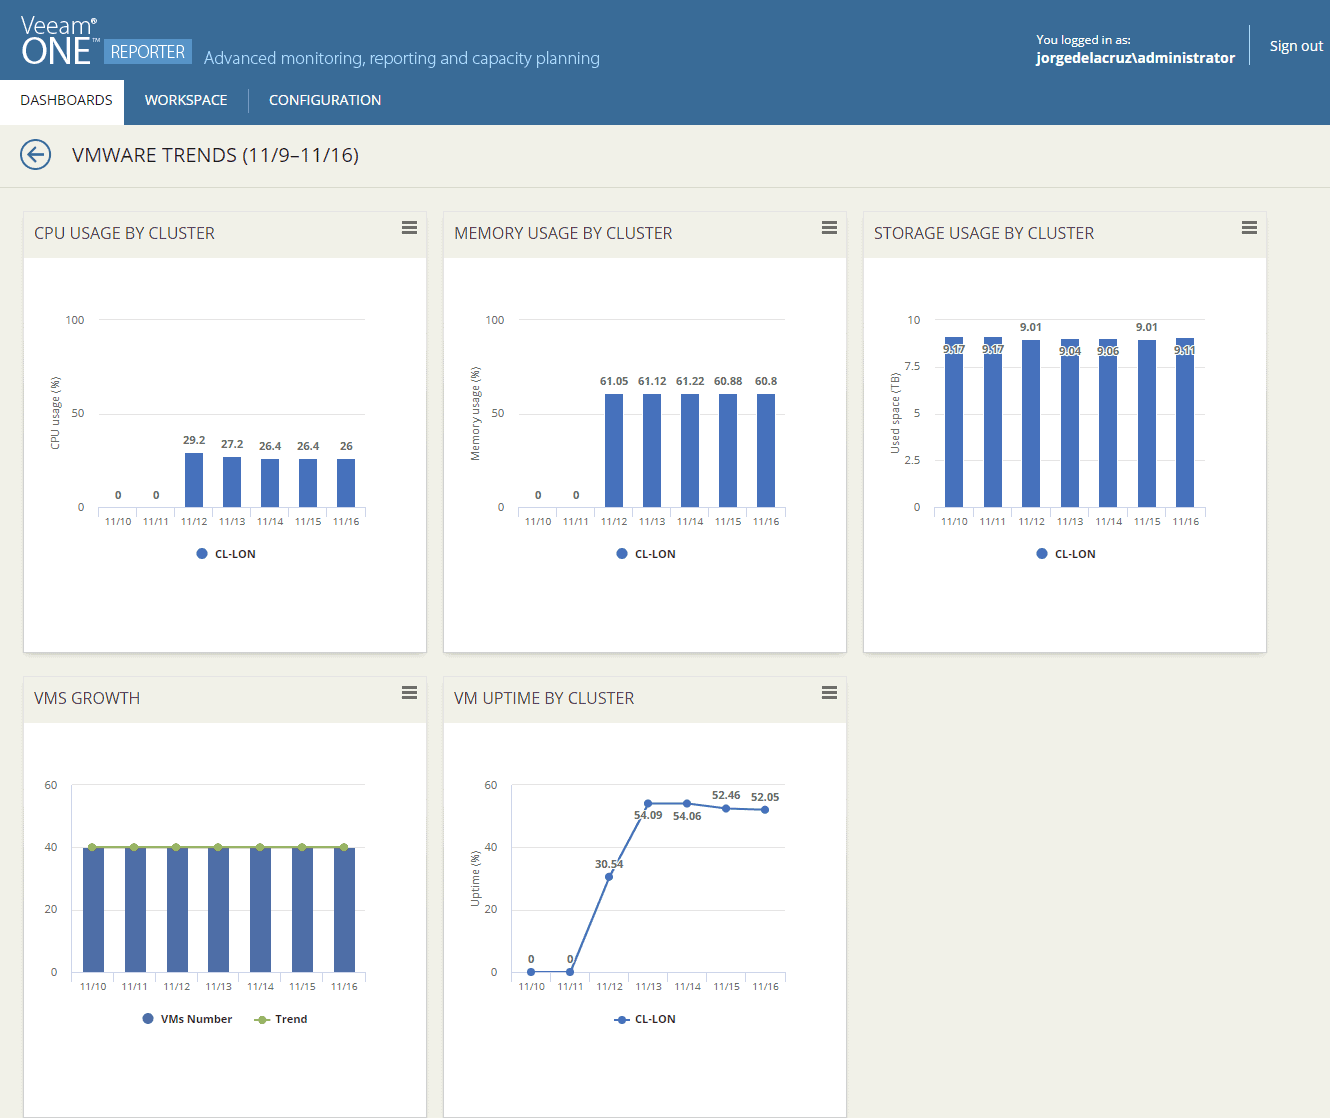
3- VMware Alarms – Quick overview of VMware vSphere alerts
In this Dashboard, we can observe the alarms generated in VMware on the different resources, besides seeing them by warning or error, and per day, very interesting without a doubt to see the resources “more affected” by alarms in the three inferior panels. I have to check without any doubt those VMs with 51 warnings and 38 in the other one: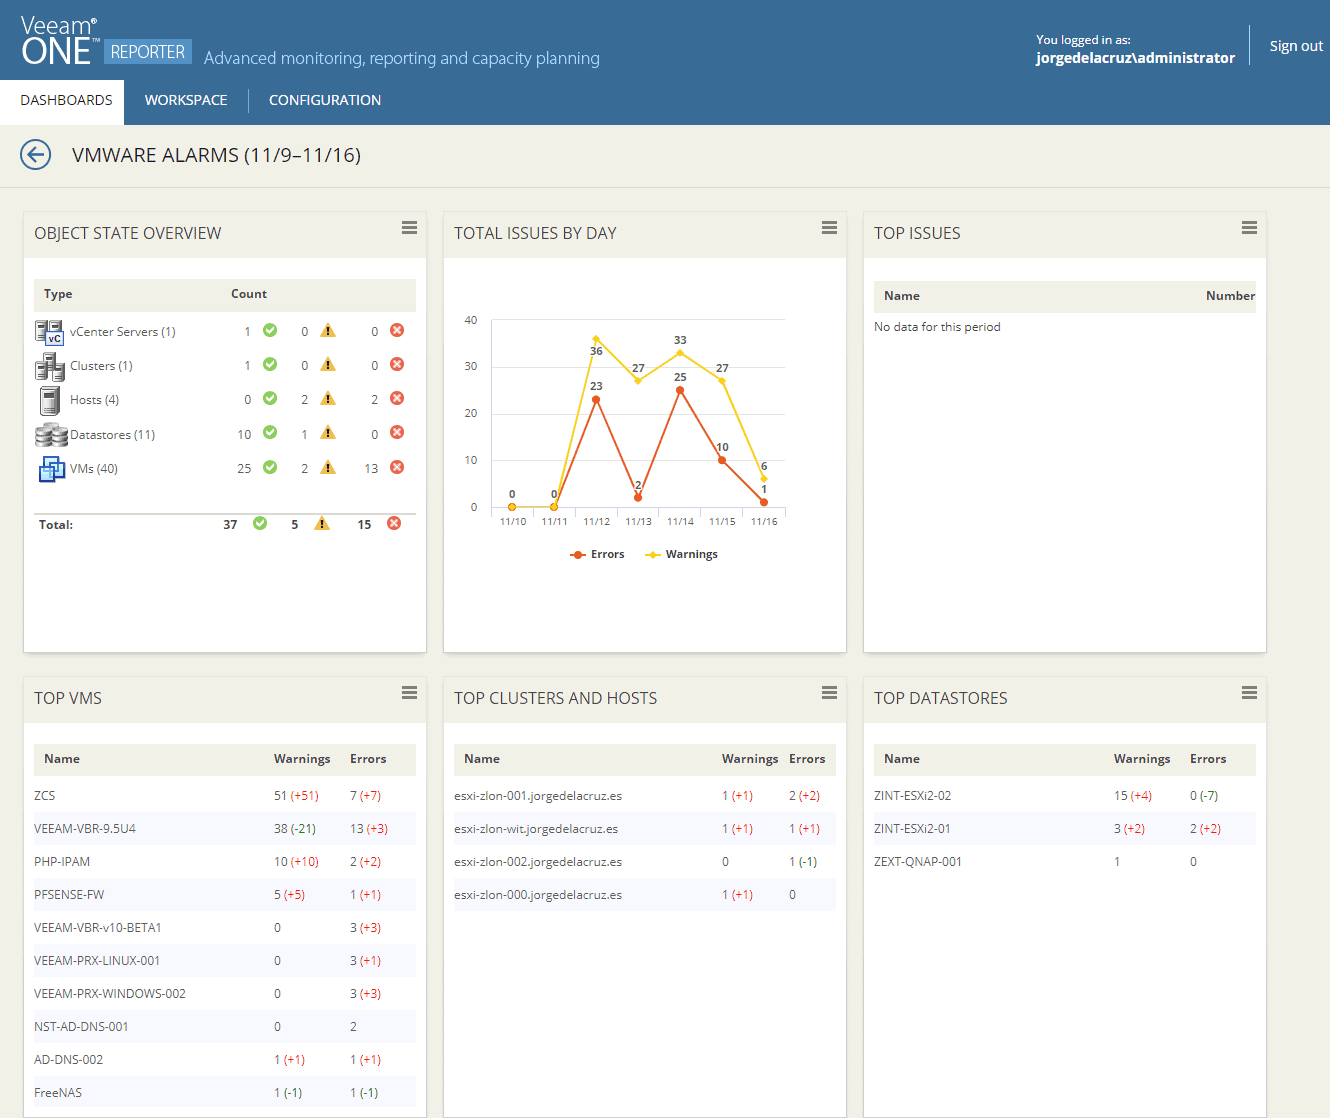
4- VMware Host and Clusters – Quick visualization on the components that consume more resources
This Dashboard is one of the easiest to consume, since with a simple glance it will show us the busiest resources of our vSphere environment, such as the TOP Hosts, VMs, and Datastores, in addition, it shows us the always interesting CPU Ready in our Cluster: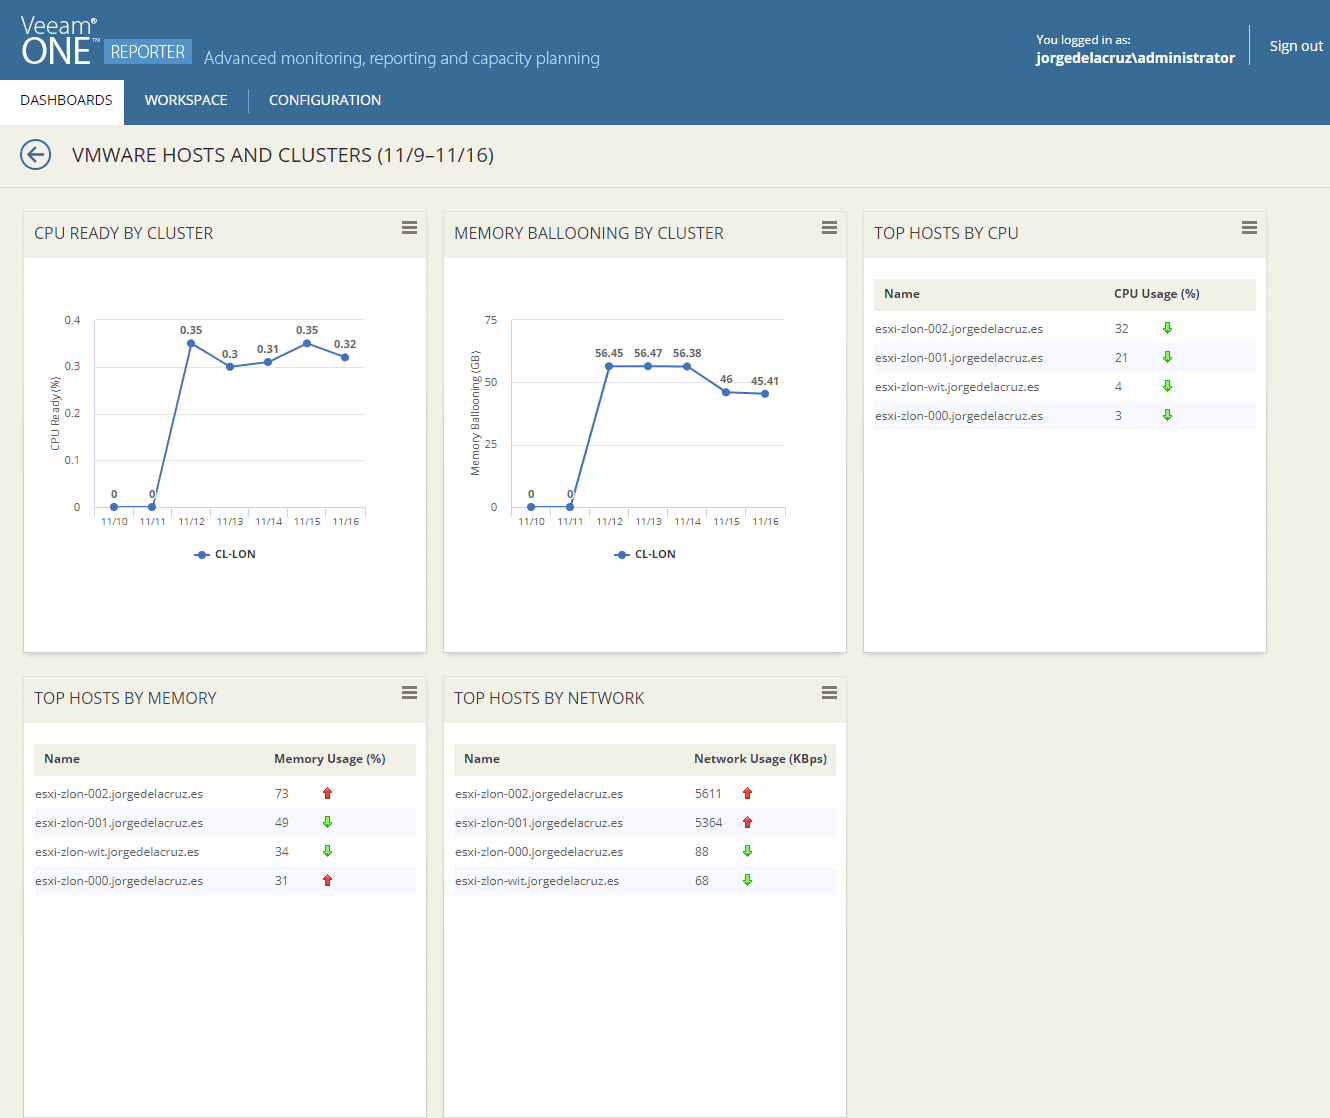
5- Veeam Datastores – Quick overview of our vSphere storage
This Dashboard will help us to understand the state of our Infrastructure at a storage level, not only the most consumed space per datastore but also the VMs and how their different partitions or mount points grow, the latency per datastore, the consumption of IOPS, if there are VMs with Snapshots and of course the latency when writing to the datastore:
6- VMware VMs – Quick visualization of the consumption of our VMs in vSphere
This view is very useful to control the whole environment, especially the VMs, which are the last passenger in this virtualization train. This dashboard shows us the CPU and RAM consumption by VMs, as well as networking, read and write latency and of course by IOPS, very useful to do troubleshooting: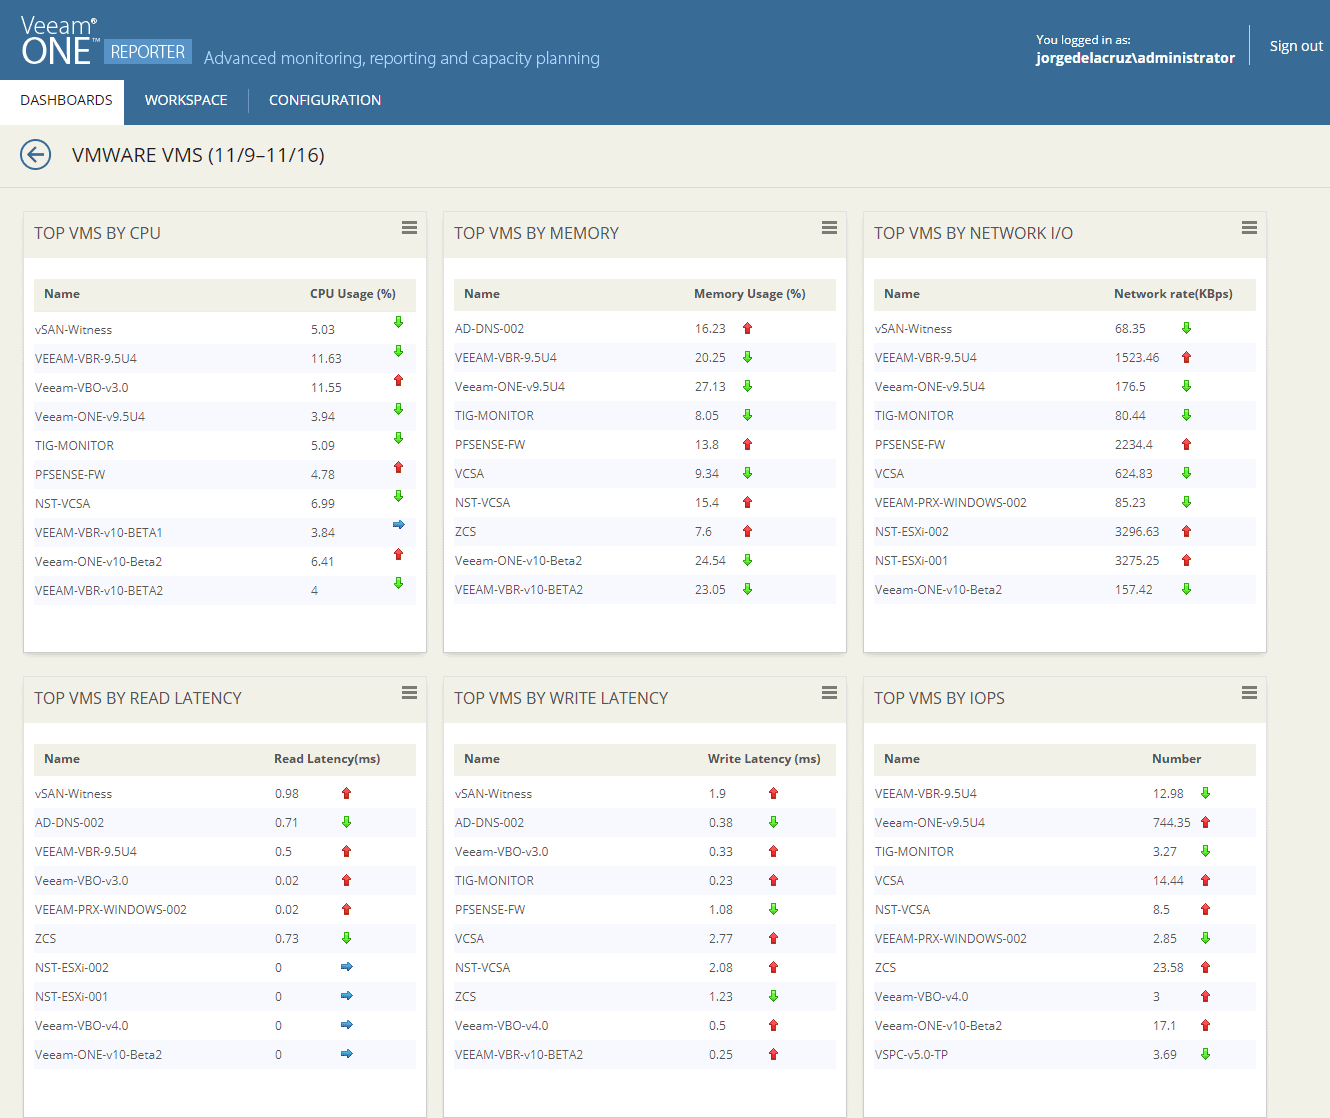
7- VMware Infrastructure – Quick visualization about our Infrastructure in vSphere in a logical way
In this Dashboard we will be able to know the logical total number that we have of each resource of our datacenter, very useful to make fast inventories of our environment, without losing time or opening giant Excels:
8- VMware Capacity Planning – A Look into the Future from a VMware vSphere Perspective
This Dashboard will give us the opportunity to have a look to the future and how our resources can grow depending on if we talk about Datastore, how many VMs we can add, etc: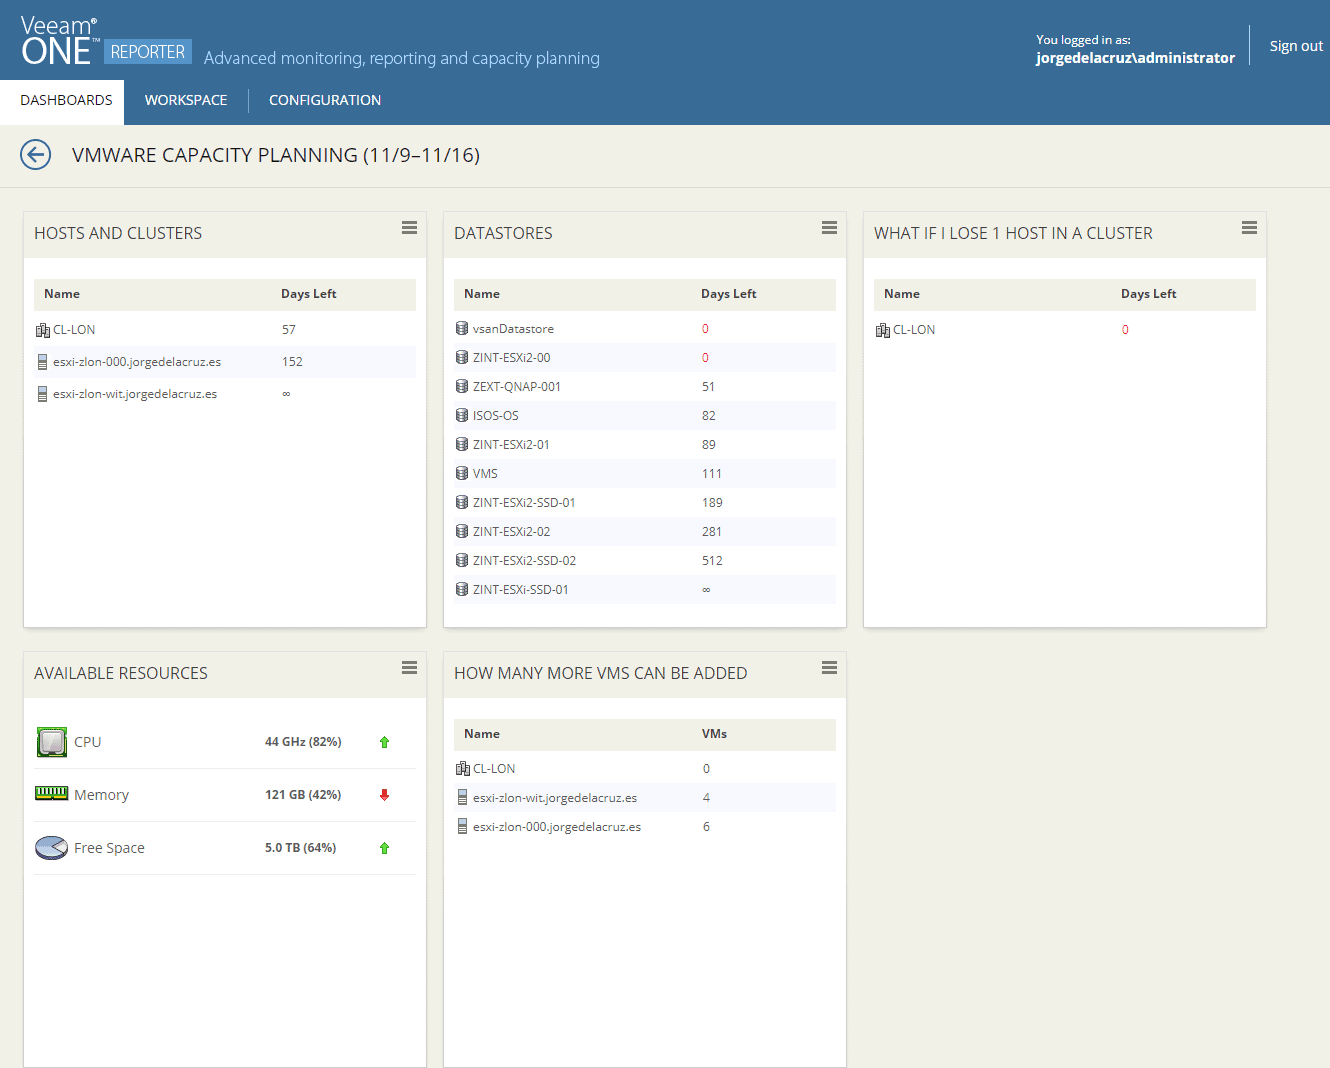
9- Veeam ONE Heatmap – Quick visualization of how busy our Veeam Backup & Replication environment is
One of the best bird’s eye views we have is the one called HEATMAP, which can be found in Veeam ONE Reports, in the Dashboards section. With a simple glance we can see that it is in amber or red, besides being able to see it by each component of the Infrastructure: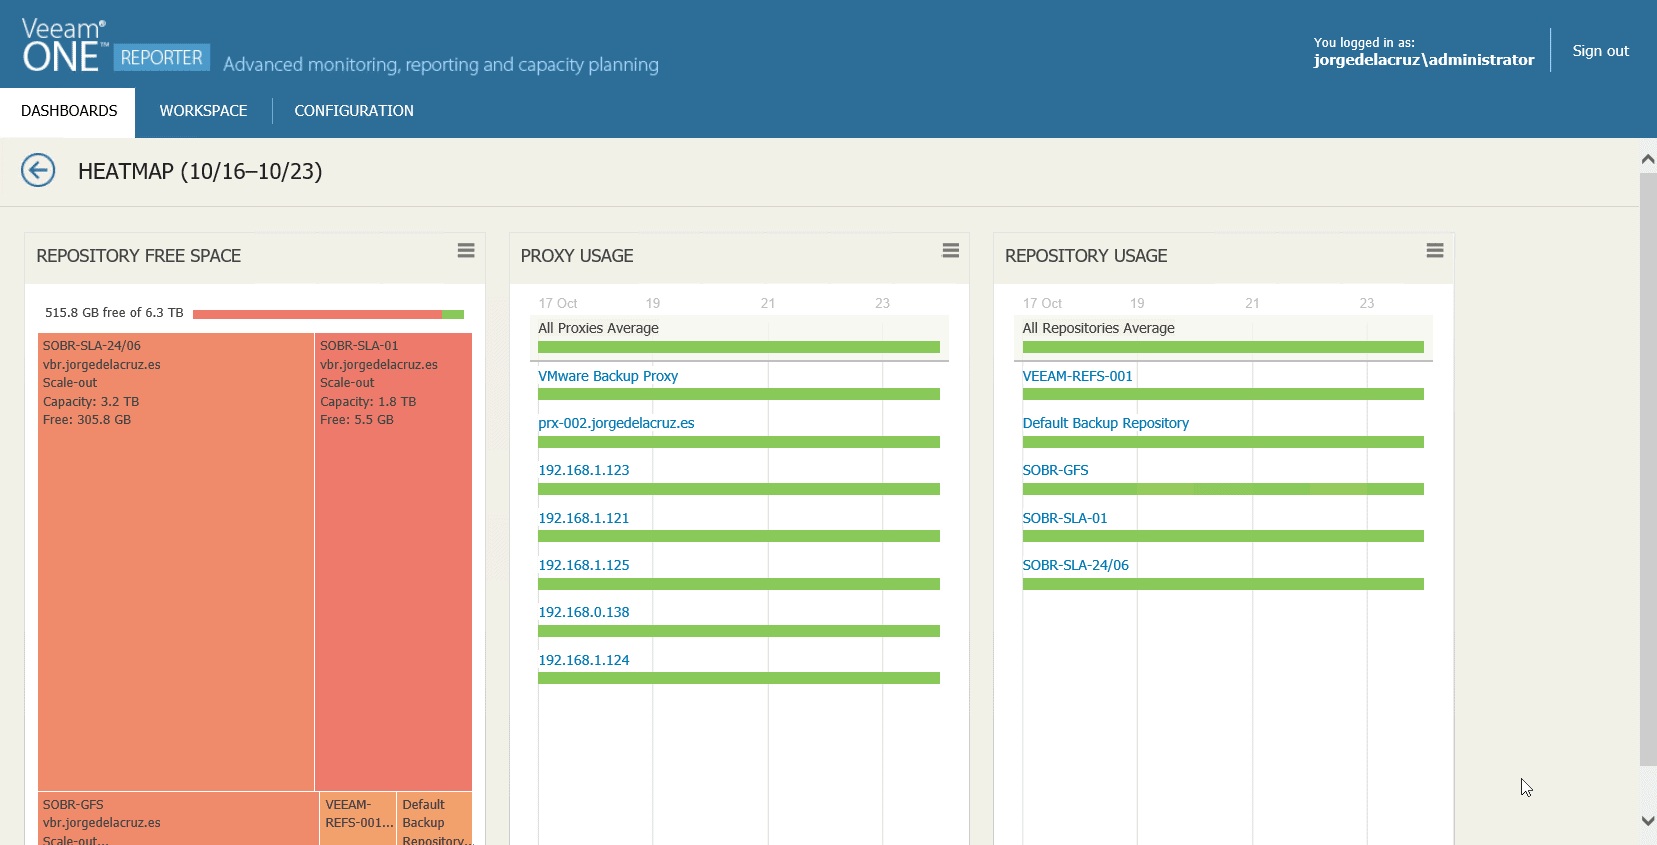 For example, here I have expanded all my Proxies, to check with surprise that they are all in green, which means that we don’t have any node more loaded than another one.
  In this view, I have expanded a Proxy, where we can see the exact load level for each hour, with the concurrent jobs it has, and the name of them, and also I have expanded a Repository to check that sometimes it is starting to be used a little more because the color differs from green:
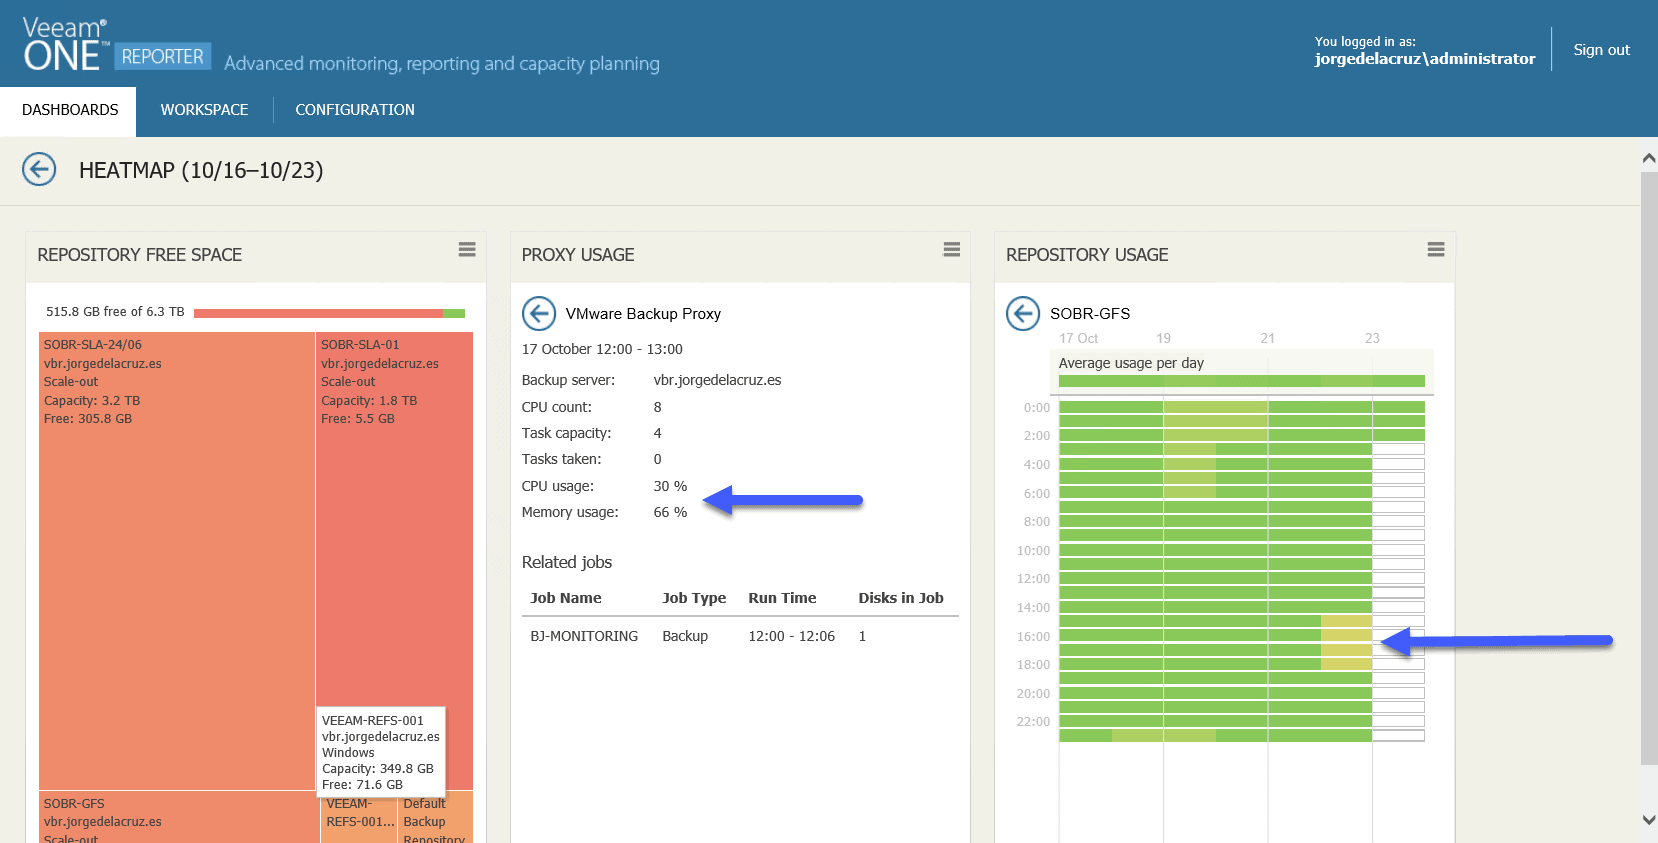 I leave you the list of all the articles that correspond to this interesting series about Veeam ONE as our monitoring and reporting system:
- Looking for the Perfect Dashboard: Veeam ONE – Part I – Introduction to Veeam ONE
- Looking for the Perfect Dashboard: Veeam ONE – Part II – Download and Install Veeam ONE
- Looking for the Perfect Dashboard: Veeam ONE – Part III – Adding a VMware vSphere Infrastructure to Veeam ONE
- Looking for the Perfect Dashboard: Veeam ONE – Part IV – Adding a Veeam Backup and Replication Infrastructure to Veeam ONE
- Looking for the Perfect Dashboard: Veeam ONE – Part V – Troubleshooting vSphere using Veeam ONE Monitor
- Looking for the Perfect Dashboard: Veeam ONE – Part VI – Troubleshooting Veeam Backup and Replication using Veeam ONE Monitor
- Looking for the Perfect Dashboard: Veeam ONE – Part VII – Dashboards at a Glance in the Veeam ONE Reporter
- Looking for the Perfect Dashboard: Veeam ONE – Part VIII – In-depth look at Reports in Veeam ONE Reporter
- Looking for the Perfect Dashboard: Veeam ONE – Part IX – Chargeback to create cost reports of our Infrastructure
Leave a Reply