
 Greetings friends, for some time now I have been thinking and thinking about how I could monitor all the electricity consumption in my house, I have found many different ways, and in the end, I have opted for the cheapest and simplest.
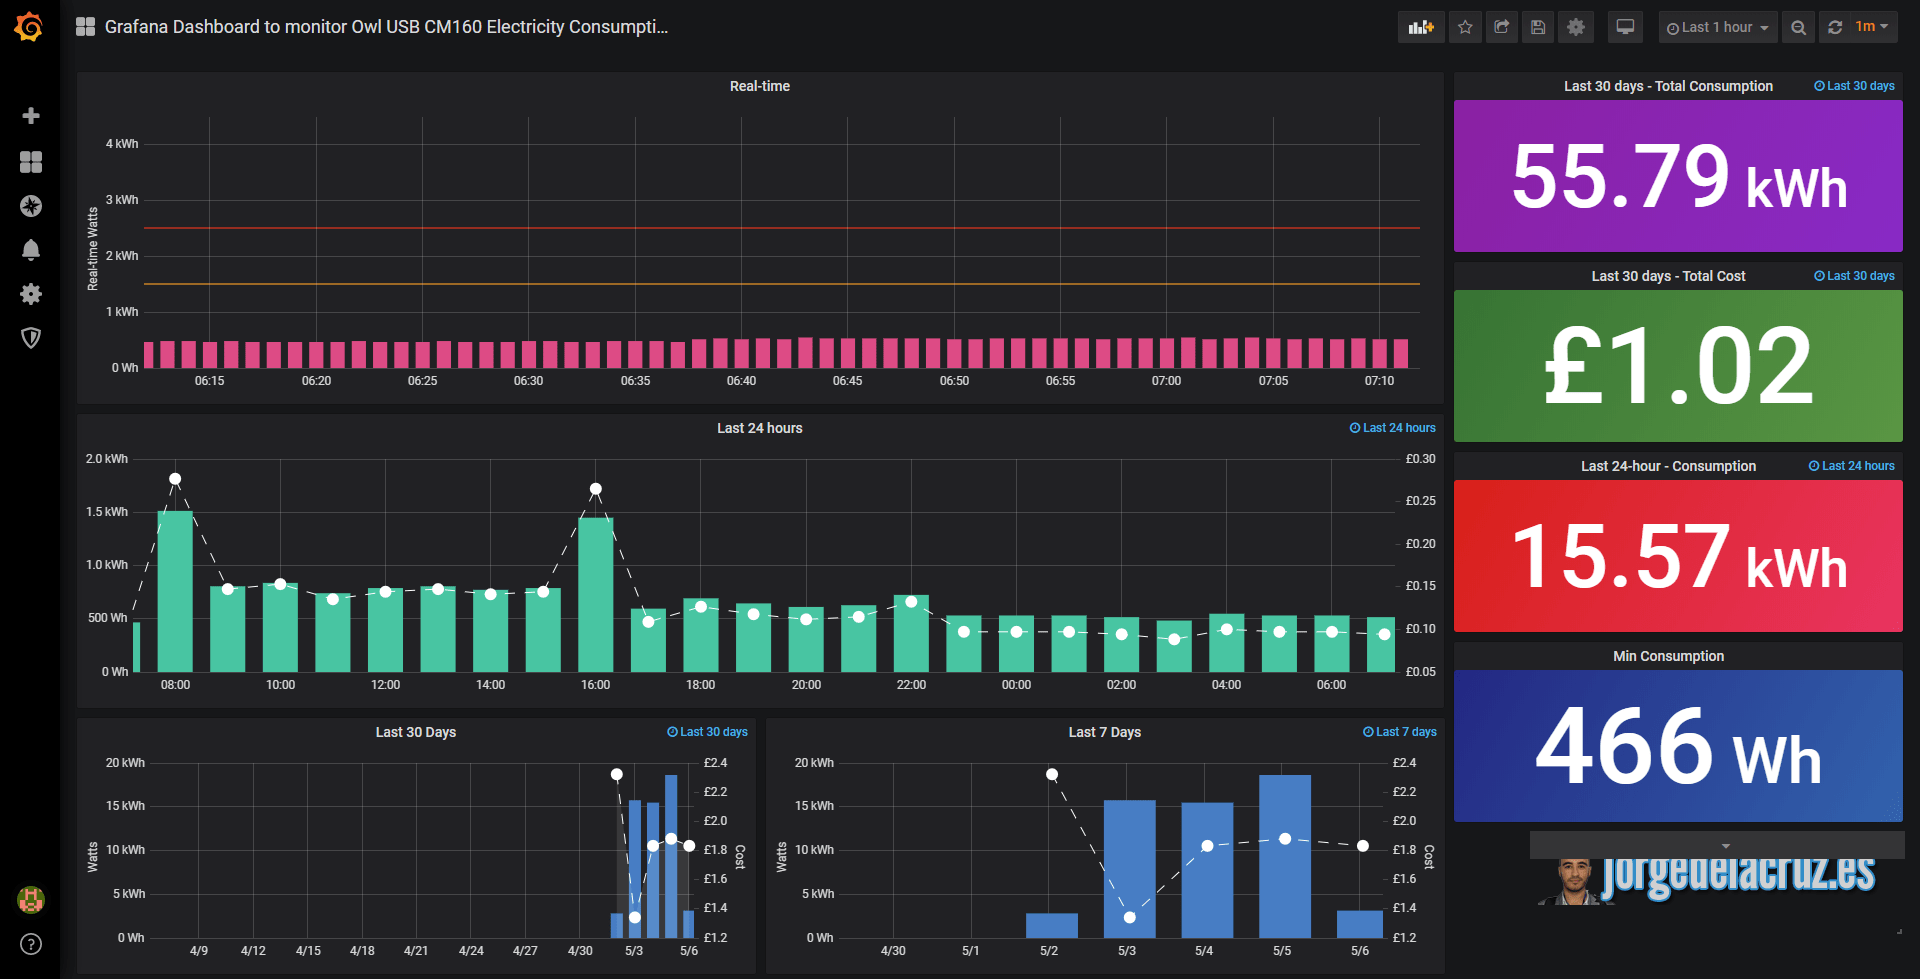
Once you have finished this tutorial, you will have something similar to this, it is better to give it several days or weeks to see the full potential: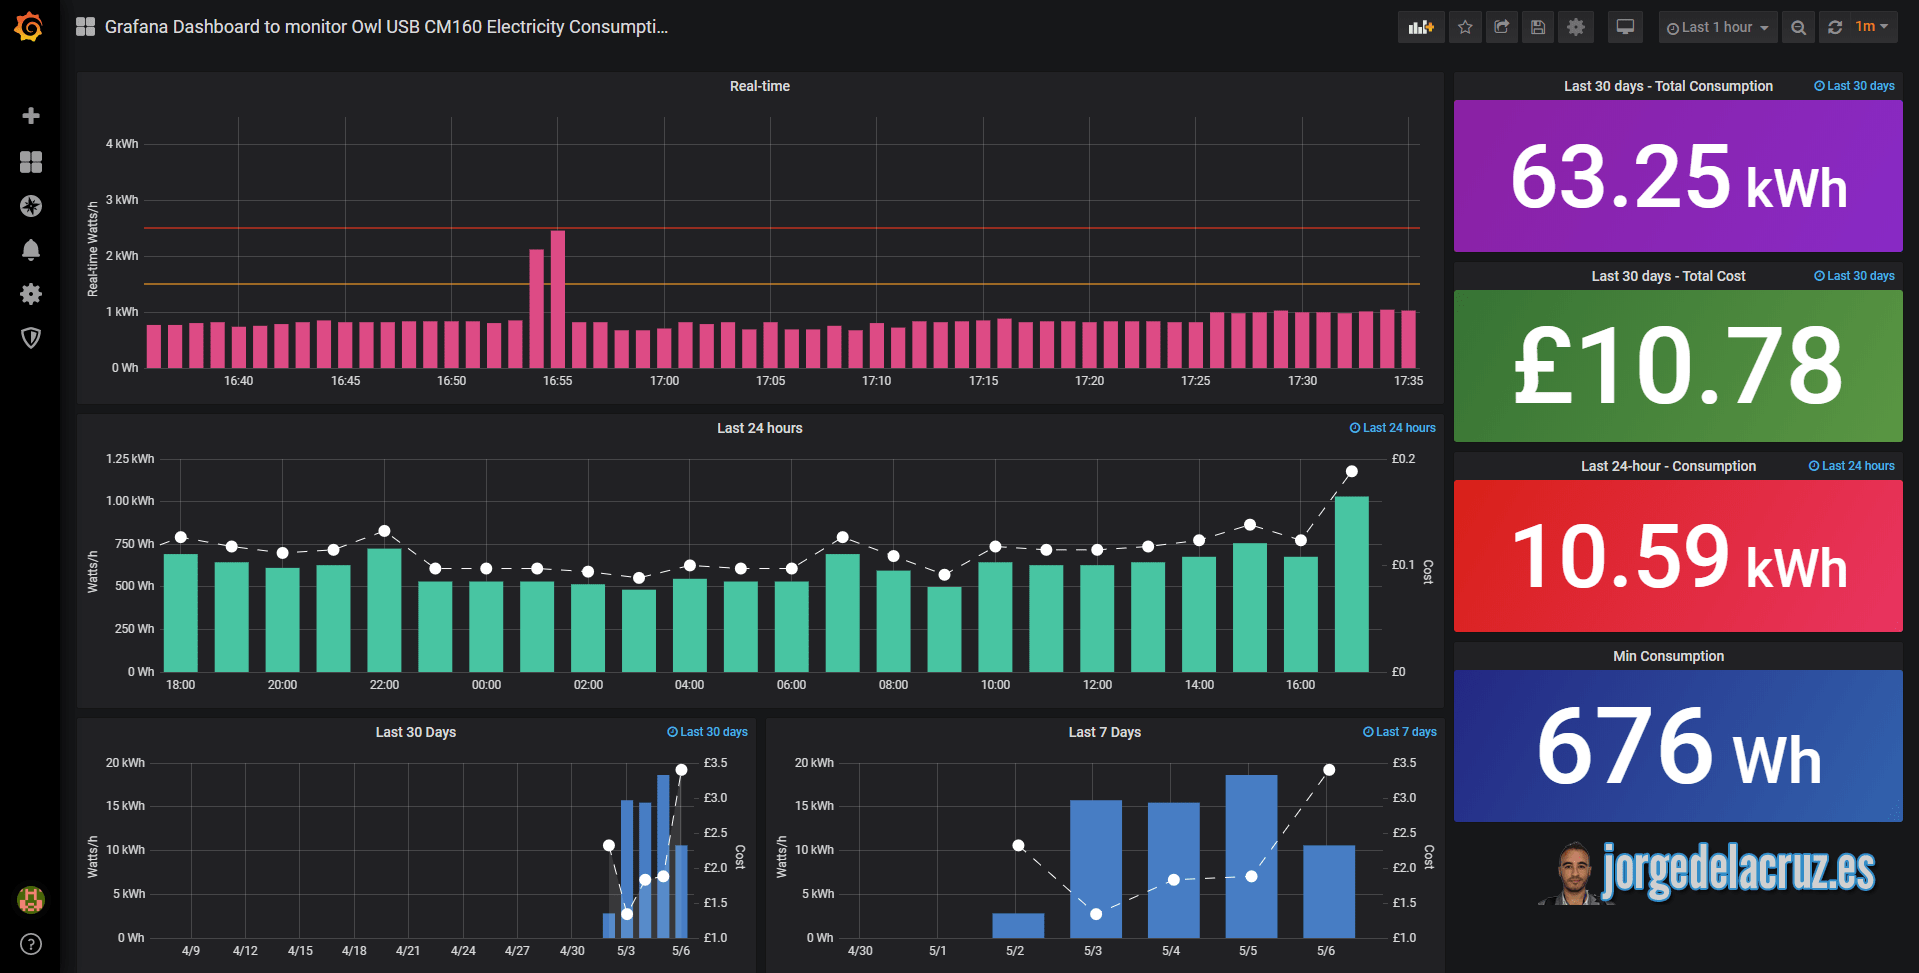
Owl USB CM160 Electricity Monitor Compatible with Windows 10
As I was telling you, the cheapest thing I found, which works in my case, is the magnificent Owl USB CM160, which you can find here:
- https://www.amazon.co.uk/dp/B004BDNR84/ref=pe_3187911_189395841_TE_3p_dp_1
This device is composed of several parts:
The meter that is connected by a clamp to the electricity output of our home.
The base where all the information is collected wirelessly, which we can easily configure, which also gives us a USB connection.
This simple device works as follows:
- The meter collects in real-time the electricity consumption that is passing through the cable and sends it to the base.
- This base stores the information every minute and presents this information through the display, every minute, cumulative of the day, month, cost, etc.
The advantage of this base is that it can be connected via USB to our PC, or server, etc. And already there to install the software so that the information is saved in an SQLite 🙂
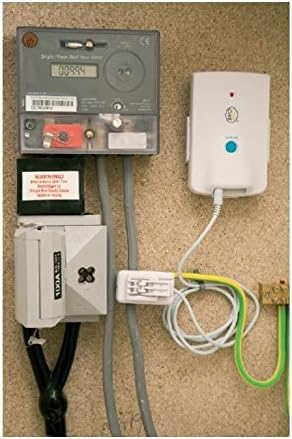 Before buying it, make sure you have access to your lightbox, and that you have something similar to this image since it will be here where we will have to connect the clamp.
This clamp connects in just a minute and does not require you to make any holes or anything. The base, if you want to hold it, you can put a little nail on the wall and that’s it.
Telegraf, InfluxDB, and Grafana topology monitoring an SQLite
Although I have already shown you in some occasions the diagram of how would be the monitoring using Telegraf, Grafana, and InfluxDB, I leave you again the diagram, this time monitoring an SQLite: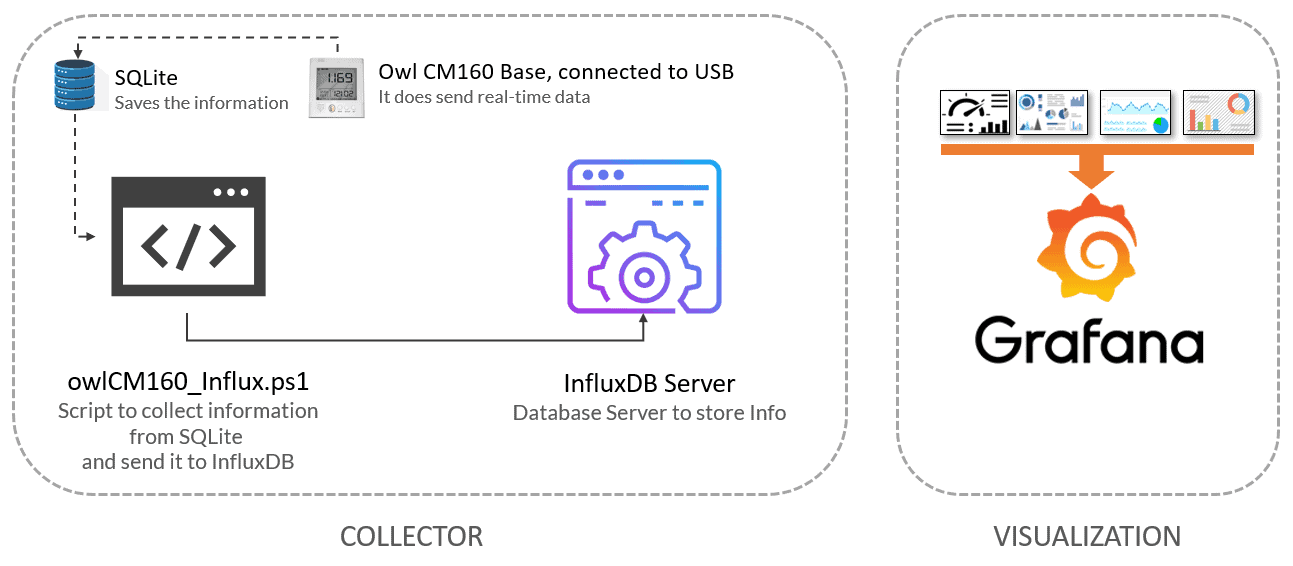
Requirements we will need to make everything work
To get everything working we’re going to need several components, I’ll leave the list:
- Buy, and configure the Owl USB CM160 Electricity Monitor
- A physical, or virtual machine, with Microsoft Windows 10 or Microsoft Windows Server 2016+ directly connected to the USB unit:
- Last Owl CM160 software update – http://thermalimage.idl.owlintuition.com/downloads/OWL+USB%20Software.msi
- SQLite assemblies to be able to use Powershell (please download the one that corresponds to your .NET Framework) – https://system.data.sqlite.org/index.html/doc/trunk/www/downloads.wiki
- Extra Drivers for the Owl USB CM160 Electricity Monitor – https://www.silabs.com/products/development-tools/software/usb-to-uart-bridge-vcp-drivers
Once we have everything set up, next-next. We’re ready for the next step.
Fine Configuration for Owl CM160 – Wireless USB Power Consumption Meter
This device when connected by USB, should show us a new COM in our Device Manager, if not, you have the drivers above, download and fly, we will have to see something similar to this: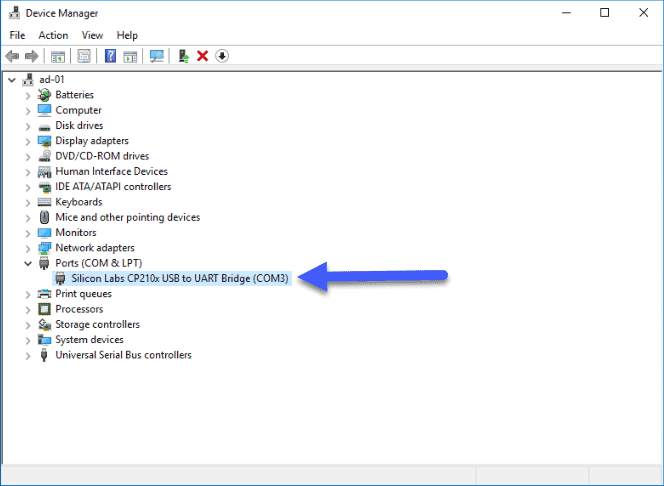 To leave the fine configuration, I have chosen to change it to COM1, in the following way, right button – Properties – Port Settings – Advanced Settings:
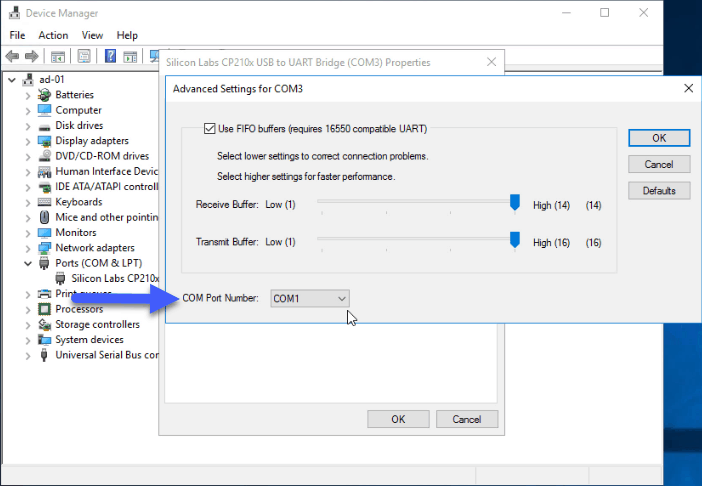
A quick check that we are receiving information via USB
We will execute our Owl software, and it will have to appear to us that it is connected, and in addition, if we move between the tabs we will be able to see historical information.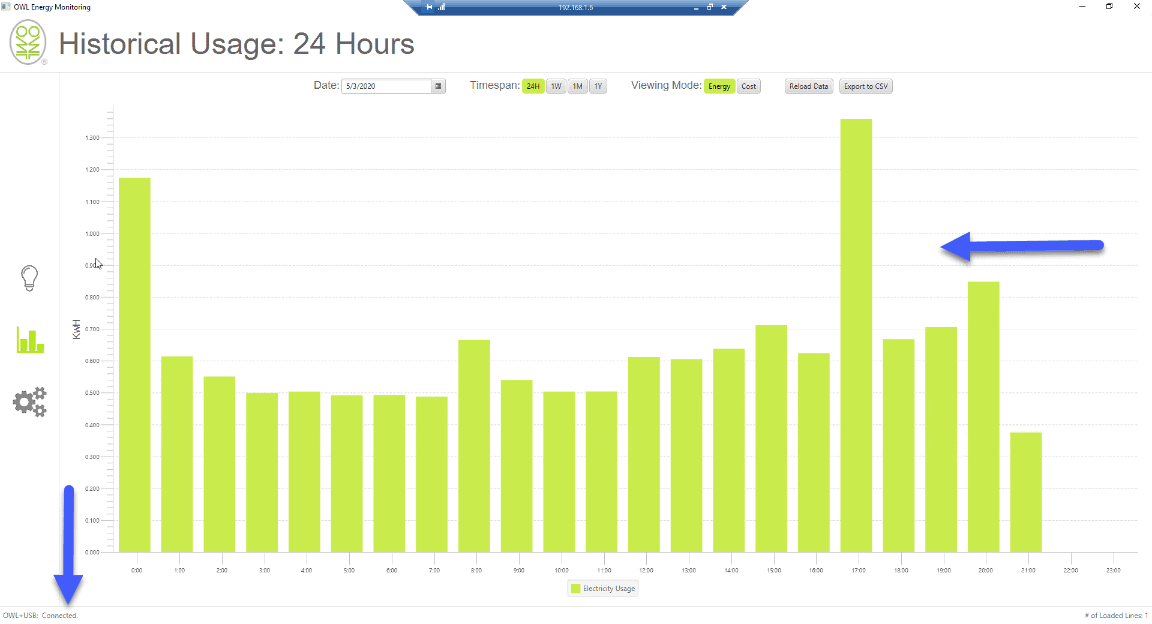 If we have everything right, we can go to the next step. Important! We don’t have to close the program ever if we want the information to be stored in the SQLite, so USB and program always connected.
Use a Windows VM for this purpose
In my case, I have done the easiest for me, which VM do I always have turned on? My Domain Controller! So I have connected the base of the Owl to my ESXi, and in the selected VM I have added a USB Host: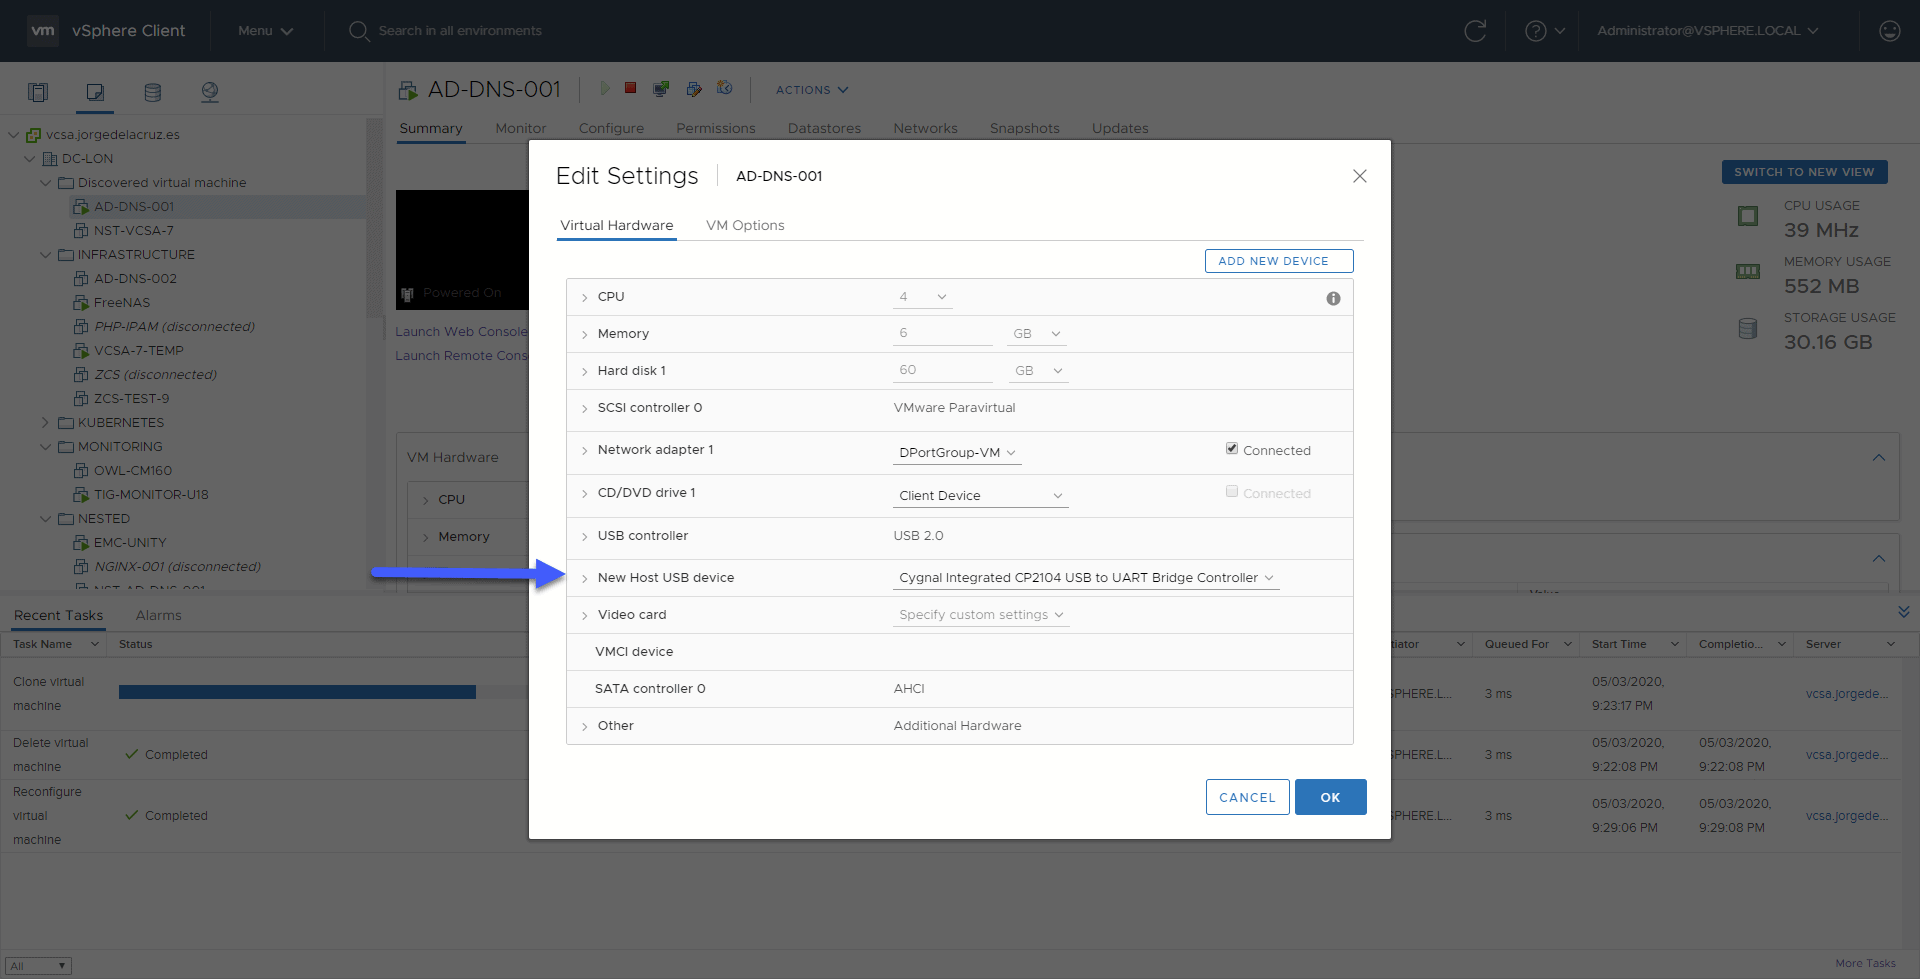
Already in this VM, I have installed the software mentioned above and left everything fine, and the software running.
Download and configure the owlCM160_Influx.ps1 script
Let’s download the script that will make all this work, we will download the latest version from the Github repository:
This PowerShell, will download and run from this VM, or computer, with the USB connected and all the software. We’ll need to edit the configuration settings:
# System variables, on here you need to replace the next ones with your own paths, IPs, pass, etc.
#By default the SystemDataSQLLitePath on mi case was C:\Program Files\System.Data.SQLite\2015\bin\System.Data.SQLite.dll
$SystemDataSQLLitePath="YOURPATHTOTHESQLLITEASSEMBLY"
$NumberArray="THEMINUTESYOUWANTTORETRIEVE"
$InfluxDBURL="https://YOURINFLUXDBSERVER"
$InfluxDBPort="8086"
$InfluxDBDB="YOURINFLUXDB"
$InfluxDBUser='YOURINFLUXUSER'
$InfluxDBPass='YOURINFLUXPASS' | ConvertTo-SecureString -asPlainText -Force
Pay attention to the variable NumberArray, this value depends on how often you are going to program the script that is launched, for example, if we put it every 5 minutes, here we put 5.
If it is something sporadic that you want to do every day, put 1440 or some higher value.
Scheduling the PowerShell script every 5 minutes
I suppose you want to know every five minutes that have passed during the last 4, to have practical real-time monitoring of your electricity, so I’m going to show you how to create a scheduled task every 5 minutes: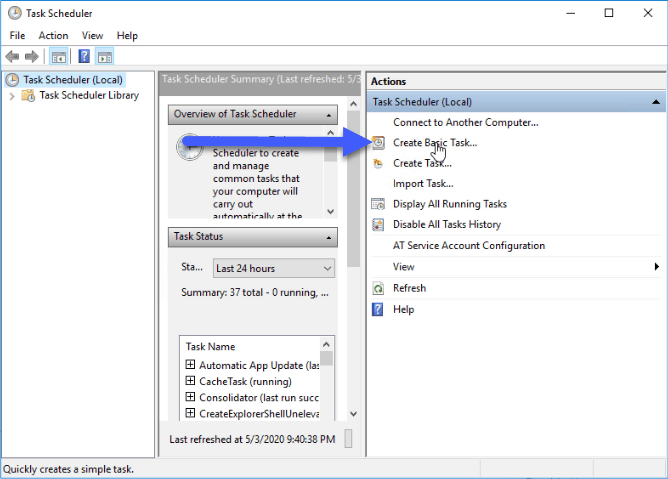 In the name of the task program, the one you like best, this is mine:
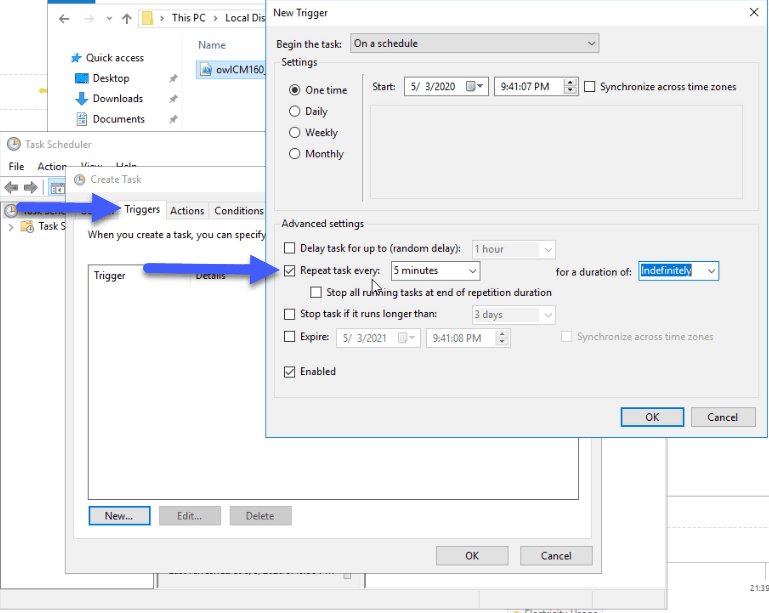
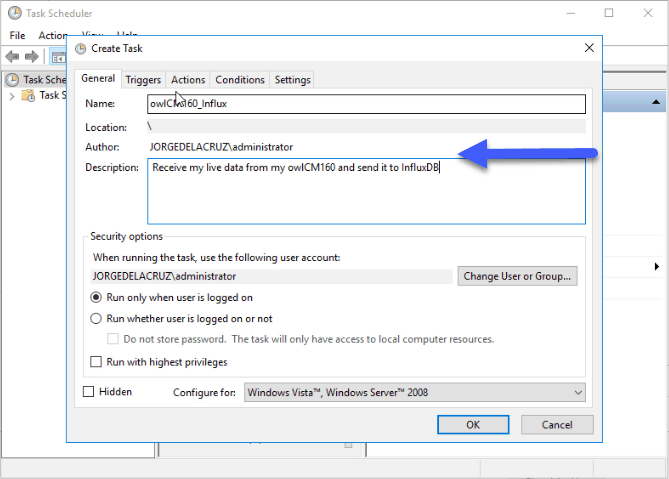 In the triggers, we’ll select that we want to run it every five minutes:
 In the actions, in program/script, we will select where we have Powershell, by default you can see the folder here, also in arguments, we will select the path with the script included, and finally, in start in, we will select the folder:
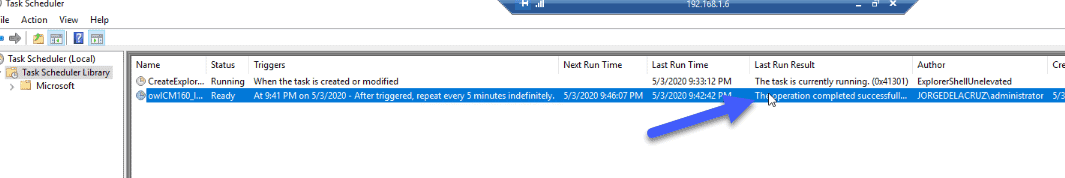
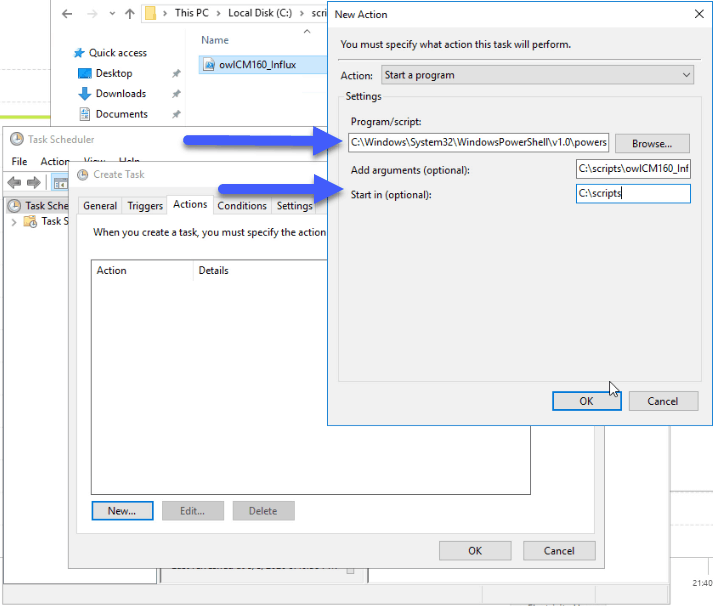 Let’s run it now to see the result:
 If we want to check very quickly that we have information already in InfluxDB, we can go to Grafana Explore and search within the owl_grafana table:
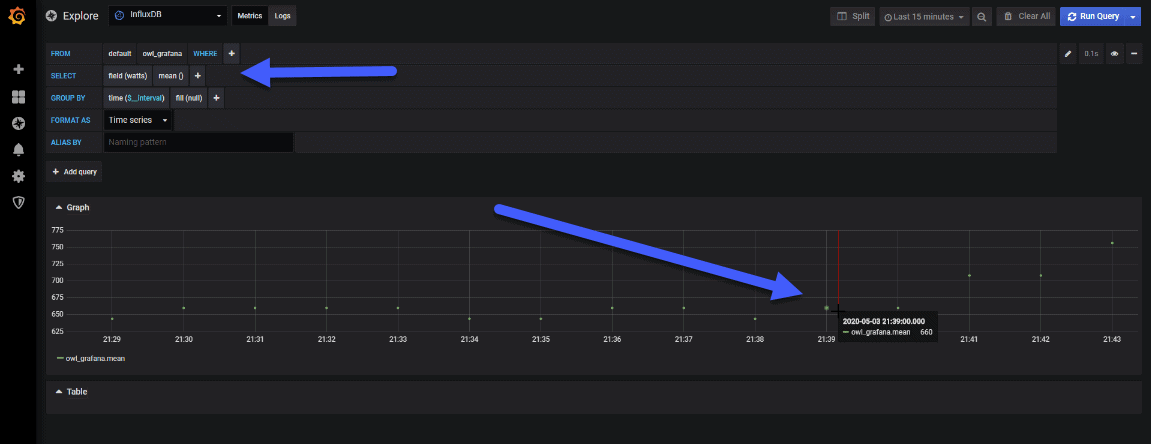
Grafana Dashboards
I created a Dashboard from scratch by selecting the best requests to the database, finishing off colors, thinking about graphics, and how to display them, and everything is automated so that it fits our environment without any problem and without having to edit anything manually. The Dashboard can be found here, once imported, you can see all the graphics:
Import Grafana Dashboards easily
So that you don’t have to waste hours configuring a new Dashboard, and ingesting and debugging you want, I have already a wonderful Dashboard with everything you need to monitor our environment in a very simple way, you will be like the image I showed you above. Select the name you want and enter the ID: 12226, which is the unique ID of the Dashboard, or the URL:
 If everything went as expected, you will have this working without any problem:
I hope you like it, and I would like to leave you the complete series here, so you can start playing with the plugins that I have been telling you about all these years:
- Looking for the Perfect Dashboard: InfluxDB, Telegraf, and Grafana – Part I (Installing InfluxDB, Telegraf, and Grafana on Ubuntu 20.04 LTS)
- En busca del Dashboard perfecto: InfluxDB, Telegraf y Grafana – Parte II (Instalar agente Telegraf en Nodos remotos Linux)
- En busca del Dashboard perfecto: InfluxDB, Telegraf y Grafana – Parte III Integración con PRTG
- En busca del Dashboard perfecto: InfluxDB, Telegraf y Grafana – Parte IV (Instalar agente Telegraf en Nodos remotos Windows)
- En busca del Dashboard perfecto: InfluxDB, Telegraf y Grafana – Parte V (Activar inputs específicos, Red, MySQL/MariaDB, Nginx)
- En busca del Dashboard perfecto: InfluxDB, Telegraf y Grafana – Parte VI (Monitorizando Veeam)
- En busca del Dashboard perfecto: InfluxDB, Telegraf y Grafana – Parte VII (Monitorizar vSphere)
- En busca del Dashboard perfecto: InfluxDB, Telegraf y Grafana – Parte VIII (Monitorizando Veeam con Enterprise Manager)
- En busca del Dashboard perfecto: InfluxDB, Telegraf y Grafana – Parte IX (Monitorizando Zimbra Collaboration)
- En busca del Dashboard perfecto: InfluxDB, Telegraf y Grafana – Parte X (Grafana Plugins)
- En busca del Dashboard perfecto: InfluxDB, Telegraf y Grafana – Parte XI – (Monitorizando URL e IPS con Telegraf y Ping)
- Looking for the Perfect Dashboard: InfluxDB, Telegraf, and Grafana – Part XII (Native Telegraf Plugin for vSphere)
- Looking for the Perfect Dashboard: InfluxDB, Telegraf, and Grafana – Part XIII (Veeam Backup for Microsoft Office 365 v4)
- Looking for the Perfect Dashboard: InfluxDB, Telegraf, and Grafana – Part XIV – Veeam Availability Console
- Looking for the Perfect Dashboard: InfluxDB, Telegraf, and Grafana – Part XV (IPMI Monitoring of our ESXi Hosts)
- Looking for Perfect Dashboard: InfluxDB, Telegraf, and Grafana – Part XVI (Performance and Advanced Security of Veeam Backup for Microsoft Office 365)
- Looking for the Perfect Dashboard: InfluxDB, Telegraf, and Grafana – Part XVII (Showing Dashboards on Two Monitors Using Raspberry Pi 4)
- En busca del Dashboard perfecto: InfluxDB, Telegraf y Grafana – Parte XVIII – Monitorizar temperatura y estado de Raspberry Pi 4
- Looking for the Perfect Dashboard: InfluxDB, Telegraf, and Grafana – Part XIX (Monitoring Veeam with Enterprise Manager) Shell Script
- Looking for the Perfect Dashboard: InfluxDB, Telegraf, and Grafana – Part XXIV (Monitoring Veeam Backup for Microsoft Azure)
- Looking for the Perfect Dashboard: InfluxDB, Telegraf, and Grafana – Part XXV (Monitoring Power Consumption)
- Looking for the Perfect Dashboard: InfluxDB, Telegraf, and Grafana – Part XXVI (Monitoring Veeam Backup for Nutanix)
- Looking for the Perfect Dashboard: InfluxDB, Telegraf, and Grafana – Part XXVII (Monitoring ReFS and XFS (block-cloning and reflink)
- Looking for the Perfect Dashboard: InfluxDB, Telegraf, and Grafana – Part XXVIII (Monitoring HPE StoreOnce)
- Looking for the Perfect Dashboard: InfluxDB, Telegraf, and Grafana – Part XXIX (Monitoring Pi-hole)
- Looking for the Perfect Dashboard: InfluxDB, Telegraf, and Grafana – Part XXIX (Monitoring Veeam Backup for AWS)
- Looking for the Perfect Dashboard: InfluxDB, Telegraf, and Grafana – Part XXXI (Monitoring Unifi Protect)
- Looking for the Perfect Dashboard: InfluxDB, Telegraf, and Grafana – Part XXXII (Monitoring Veeam ONE – experimental)
- Looking for the Perfect Dashboard: InfluxDB, Telegraf, and Grafana – Part XXXIII (Monitoring NetApp ONTAP)
- Looking for the Perfect Dashboard: InfluxDB, Telegraf, and Grafana – Part XXXIV (Monitoring Runecast)
- Looking for the Perfect Dashboard: InfluxDB, Telegraf, and Grafana – Part XXXV (GPU Monitoring)
- Looking for the Perfect Dashboard: InfluxDB, Telegraf, and Grafana – Part XXXVI (Monitoring Goldshell Miners – JSONv2)
- Looking for the Perfect Dashboard: InfluxDB, Telegraf, and Grafana – Part XXXVII (Monitoring Veeam Backup for Google Cloud Platform)
- En Busca del Dashboard perfecto: InfluxDB, Telegraf y Grafana – Parte XXXVIII (Monitorizando Temperatura y Humedad con Xiaomi Mijia)
- Looking for the Perfect Dashboard: InfluxDB, Telegraf, and Grafana – Part XL (Veeam Backup for Microsoft 365 – Restore Audit)
- Looking for the Perfect Dashboard: InfluxDB, Telegraf, and Grafana – Part XLI (Veeam Backup for Salesforce)
- Looking for the Perfect Dashboard: InfluxDB, Telegraf, and Grafana – Part XLII (Veeam ONE v12 Audit Events)
- Looking for the Perfect Dashboard: InfluxDB, Telegraf, and Grafana – Part XLIII (Monitoring QNAP using SNMP v3)
- Looking for the Perfect Dashboard: InfluxDB, Telegraf, and Grafana – Part XLIV (Monitoring Veeam Backup & Replication API)
- Looking for the Perfect Dashboard: InfluxDB, Telegraf, and Grafana – Part XLV (Monitoring Synology using SNMP v3)
- Looking for the Perfect Dashboard: InfluxDB, Telegraf, and Grafana – Part XLVI (Monitoring NVIDIA Jetson Nano)
- Looking for the Perfect Dashboard: InfluxDB, Telegraf, and Grafana – Part XLVII (Monitoring Open WebUI)
- Looking for the Perfect Dashboard: InfluxDB, Telegraf, and Grafana – Part XLVIII (Monitoring Veeam Data Platform Advanced)
Sorry for my previous post.
I don’t know why is shown on a different topic.
Regarding the UOM: on the right is written watts, but units on the axes are wh.
Probably the panel of min consumption would be watts.
There is nothing indicating that bars are referred to left axe and points to right axe.
Thank you Jose, click F5 and check the new dashboard 🙂
Hi,
I have recently started dabbling into Linux having never touched it before and I have to say this is because of you!
If you ever arrive in the UK, I owe you a beer for the amount you have taught me!
One question, I am just about to purchase the OWL USB Meter, however were does Grafana get the stats for cost from? Is this easily changable (of course, different power prices etc.)
Thanks,
Daimian
Hello Daimian,
I am in fact in the UK 🙂 Yes, change the values it is simple, they are just on the queries, I am with British Gas and I pay 0.18 Kwh, and a fixed 0.26/day, take a look
Hey Jorge, I’ve tried to run your script remotely with no success. Could you perhaps do a post on using node-red instead of the powershell script?
Hello Franco, will need to convert it all, could take me some time. You have all the same hardware yes?