
 Greetings friends, today I bring you a new entry about Grafana and Unifi, that I am sure you will like and that I hope you will put in your collection. Yes, I know there is a version called Unifi Poller, which does more or less what I explain here, but the complexity of adding it to my already running environment, and that for now, I do not need so much has made me create this lighter version, only for Unifi Protect (remember, the theme of the cameras).
Today, I am pleased to bring you a complete and finished Dashboard to monitor Unifi Protect, without limit of Cameras, Cloud Key Gen2, or UDM Pro, or NVR.
Dashboard for Unifi Protect
When we finish the post we will have something similar to that Dashboard that will allow you to view it, click on each link to see it live: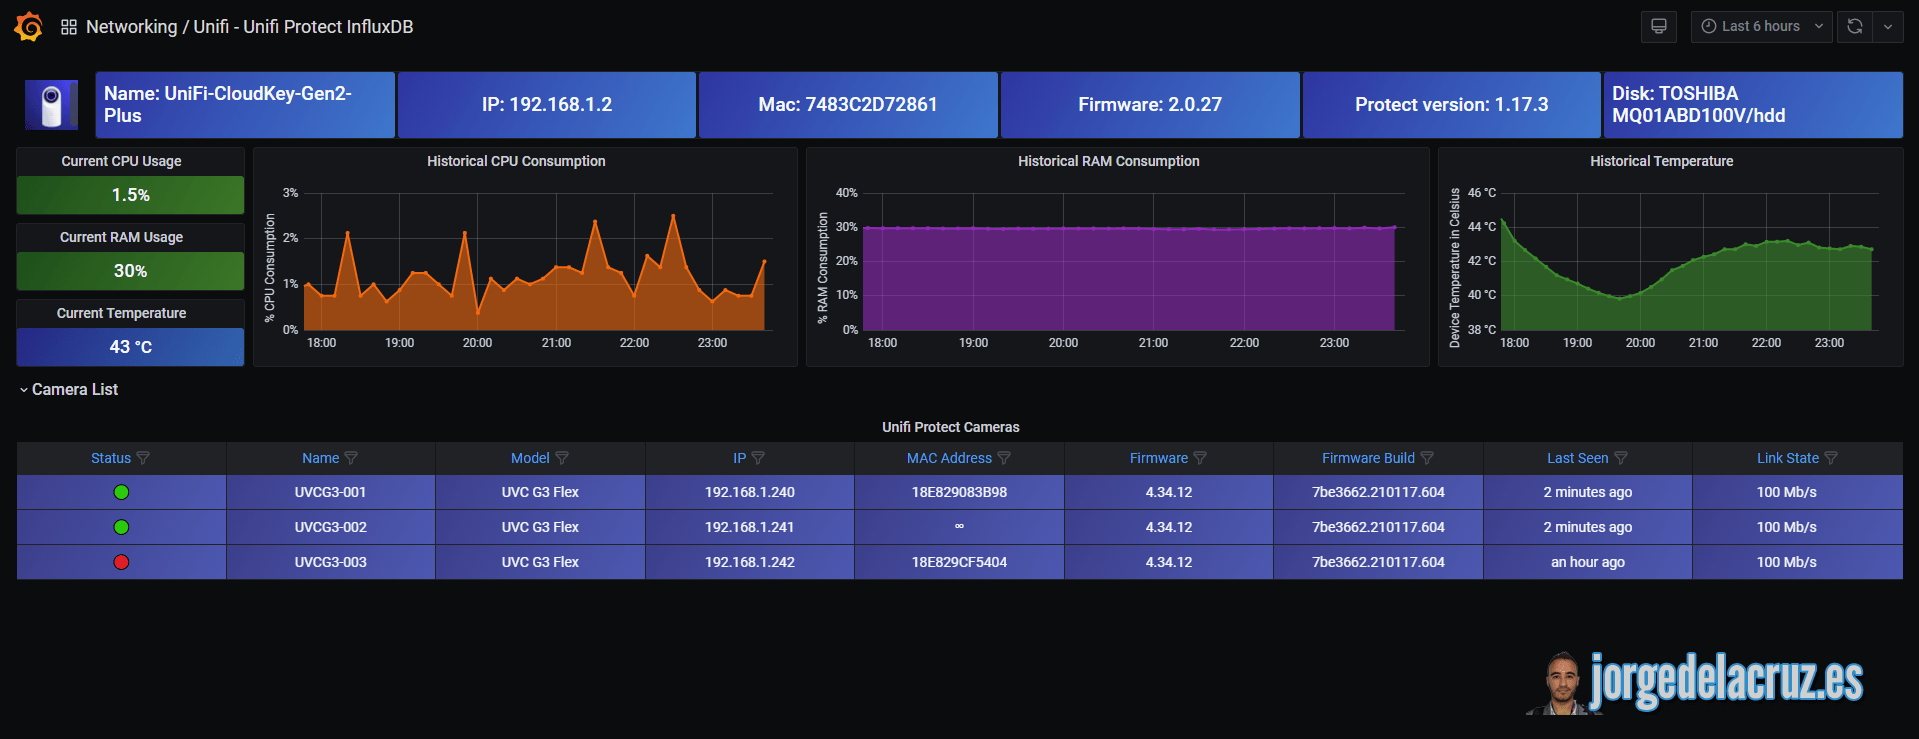
Dashboard – Summary
- Summary – Name of Protect’s recording device, with its version, IP, etc.
- CPU-RAM-Temperature – CPU, RAM, and Temperature in convenient squares to see the latest.
- CPU-RAM-Temperature History – CPU, RAM, and Temperature in convenient graphs to view the data in graphs over time.
- IP Cameras – A very complete table showing all our cameras, their status, firmware information, etc.
Topology with all logical components
This entry is similar to the previous ones since in this case, we will use a combination of a shell script to collect Unifi Protect metrics using RESTful API and InfluxDB. The design would look something similar to this:
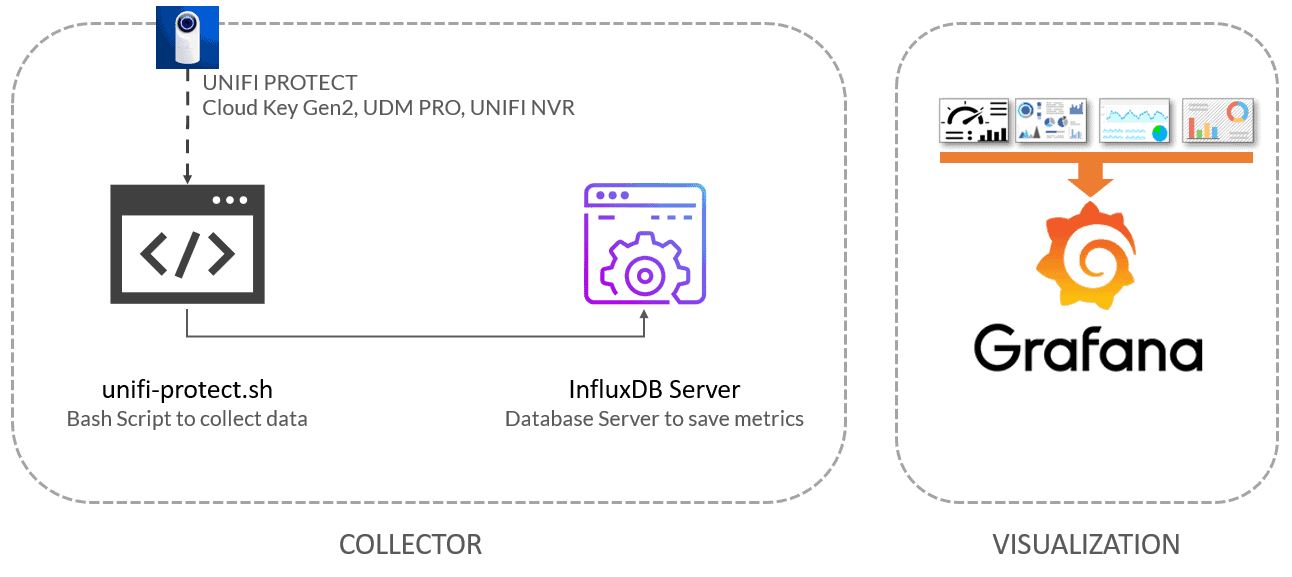 As we can see, the shell script will download the Unifi Protect metrics using the RESTful API, which will send all the data to InfluxDB, from where we can conveniently view them with Grafana.
Download and configure the script the unifi-protect.sh
We have almost everything ready, we have one last step, the script that will make all this work, we will download the latest version from the Github repository:
This shell script can be downloaded and executed from the telegraf server, or influxDB, or any other Linux. We will have to edit the configuration parameters:
# Configurations
##
# Endpoint URL for InfluxDB
InfluxDBURL="http://YOURINFLUXSERVER" #Use https if required
InfluxDBPort="8086" #Default Port
InfluxDB="telegraf" #Default Database
InfluxDBUser="YOURTELEGRAFUSER" #User for Database
InfluxDBPassword="YOURTELEGRAFPASSWORD" #Password for Database

# Endpoint URL for login action
UnifiUsername="YOURUNIFIUSER"
UnifiPassword="YOURUNIFIPASS"
UnifiProtectServer="https://YOURUNIFIPROTECTIP"
CookiePath="/tmp/cookies.txt"
Once the changes are made, make the script executable with chmod:
chmod +x unifi-protect.sh
We run it, and the output of the command should look something like the following, with no errors:
HTTP/1.1 204 No Content
Content-Type: application/json
Request-Id: 30147ef9-6744-11eb-b261-0050569017a8
X-Influxdb-Build: OSS
X-Influxdb-Version: 1.8.3
X-Request-Id: 30147ef9-6744-11eb-b261-0050569017a8
Date: Thu, 04 Feb 2021 23:53:32 GMT
If so, please now add this script to your crontab, such as every 30 minutes:
*/30 * * * * /home/oper/unifi-protect.sh >> /var/log/unifi.log 2>&1
We are ready to go to the next step.
Grafana Dashboards
I created a Dashboard from scratch by selecting the best requests to the database, finalizing the colors, thinking about the graphics and how to display them, and everything is automated to fit our environment without any problems and without having to edit anything manually. The Dashboard can be found here, once imported, you can use the top drop-down menus to select between Protect devices, etc:
Importing the Grafana Dashboard in a simple way
So that you don’t have to waste hours configuring a new Dashboard, and ingesting and debugging what you want, I have already created a wonderful Dashboards with everything you need to monitor our environment in a very simple way, it will look like the image I showed you above. Select the name you want and enter the ID: 13835, which is the unique ID of the Dashboard, or the URL:
 With the menus above, we can move between some options:Please leave your comments here, or on GitHub – thanks so much for reading!
I hope you like it, and I would like to leave you the complete series here, so you can start playing with the plugins that I have been telling you about all these years:
- Looking for the Perfect Dashboard: InfluxDB, Telegraf, and Grafana – Part I (Installing InfluxDB, Telegraf, and Grafana on Ubuntu 20.04 LTS)
- En busca del Dashboard perfecto: InfluxDB, Telegraf y Grafana – Parte II (Instalar agente Telegraf en Nodos remotos Linux)
- En busca del Dashboard perfecto: InfluxDB, Telegraf y Grafana – Parte III Integración con PRTG
- En busca del Dashboard perfecto: InfluxDB, Telegraf y Grafana – Parte IV (Instalar agente Telegraf en Nodos remotos Windows)
- En busca del Dashboard perfecto: InfluxDB, Telegraf y Grafana – Parte V (Activar inputs específicos, Red, MySQL/MariaDB, Nginx)
- En busca del Dashboard perfecto: InfluxDB, Telegraf y Grafana – Parte VI (Monitorizando Veeam)
- En busca del Dashboard perfecto: InfluxDB, Telegraf y Grafana – Parte VII (Monitorizar vSphere)
- En busca del Dashboard perfecto: InfluxDB, Telegraf y Grafana – Parte VIII (Monitorizando Veeam con Enterprise Manager)
- En busca del Dashboard perfecto: InfluxDB, Telegraf y Grafana – Parte IX (Monitorizando Zimbra Collaboration)
- En busca del Dashboard perfecto: InfluxDB, Telegraf y Grafana – Parte X (Grafana Plugins)
- En busca del Dashboard perfecto: InfluxDB, Telegraf y Grafana – Parte XI – (Monitorizando URL e IPS con Telegraf y Ping)
- Looking for the Perfect Dashboard: InfluxDB, Telegraf, and Grafana – Part XII (Native Telegraf Plugin for vSphere)
- Looking for the Perfect Dashboard: InfluxDB, Telegraf, and Grafana – Part XIII (Veeam Backup for Microsoft Office 365 v4)
- Looking for the Perfect Dashboard: InfluxDB, Telegraf, and Grafana – Part XIV – Veeam Availability Console
- Looking for the Perfect Dashboard: InfluxDB, Telegraf, and Grafana – Part XV (IPMI Monitoring of our ESXi Hosts)
- Looking for Perfect Dashboard: InfluxDB, Telegraf, and Grafana – Part XVI (Performance and Advanced Security of Veeam Backup for Microsoft Office 365)
- Looking for the Perfect Dashboard: InfluxDB, Telegraf, and Grafana – Part XVII (Showing Dashboards on Two Monitors Using Raspberry Pi 4)
- En busca del Dashboard perfecto: InfluxDB, Telegraf y Grafana – Parte XVIII – Monitorizar temperatura y estado de Raspberry Pi 4
- Looking for the Perfect Dashboard: InfluxDB, Telegraf, and Grafana – Part XIX (Monitoring Veeam with Enterprise Manager) Shell Script
- Looking for the Perfect Dashboard: InfluxDB, Telegraf, and Grafana – Part XXIV (Monitoring Veeam Backup for Microsoft Azure)
- Looking for the Perfect Dashboard: InfluxDB, Telegraf, and Grafana – Part XXV (Monitoring Power Consumption)
- Looking for the Perfect Dashboard: InfluxDB, Telegraf, and Grafana – Part XXVI (Monitoring Veeam Backup for Nutanix)
- Looking for the Perfect Dashboard: InfluxDB, Telegraf, and Grafana – Part XXVII (Monitoring ReFS and XFS (block-cloning and reflink)
- Looking for the Perfect Dashboard: InfluxDB, Telegraf, and Grafana – Part XXVIII (Monitoring HPE StoreOnce)
- Looking for the Perfect Dashboard: InfluxDB, Telegraf, and Grafana – Part XXIX (Monitoring Pi-hole)
- Looking for the Perfect Dashboard: InfluxDB, Telegraf, and Grafana – Part XXIX (Monitoring Veeam Backup for AWS)
- Looking for the Perfect Dashboard: InfluxDB, Telegraf, and Grafana – Part XXXI (Monitoring Unifi Protect)
- Looking for the Perfect Dashboard: InfluxDB, Telegraf, and Grafana – Part XXXII (Monitoring Veeam ONE – experimental)
- Looking for the Perfect Dashboard: InfluxDB, Telegraf, and Grafana – Part XXXIII (Monitoring NetApp ONTAP)
- Looking for the Perfect Dashboard: InfluxDB, Telegraf, and Grafana – Part XXXIV (Monitoring Runecast)
- Looking for the Perfect Dashboard: InfluxDB, Telegraf, and Grafana – Part XXXV (GPU Monitoring)
- Looking for the Perfect Dashboard: InfluxDB, Telegraf, and Grafana – Part XXXVI (Monitoring Goldshell Miners – JSONv2)
- Looking for the Perfect Dashboard: InfluxDB, Telegraf, and Grafana – Part XXXVII (Monitoring Veeam Backup for Google Cloud Platform)
- En Busca del Dashboard perfecto: InfluxDB, Telegraf y Grafana – Parte XXXVIII (Monitorizando Temperatura y Humedad con Xiaomi Mijia)
- Looking for the Perfect Dashboard: InfluxDB, Telegraf, and Grafana – Part XL (Veeam Backup for Microsoft 365 – Restore Audit)
- Looking for the Perfect Dashboard: InfluxDB, Telegraf, and Grafana – Part XLI (Veeam Backup for Salesforce)
- Looking for the Perfect Dashboard: InfluxDB, Telegraf, and Grafana – Part XLII (Veeam ONE v12 Audit Events)
- Looking for the Perfect Dashboard: InfluxDB, Telegraf, and Grafana – Part XLIII (Monitoring QNAP using SNMP v3)
- Looking for the Perfect Dashboard: InfluxDB, Telegraf, and Grafana – Part XLIV (Monitoring Veeam Backup & Replication API)
- Looking for the Perfect Dashboard: InfluxDB, Telegraf, and Grafana – Part XLV (Monitoring Synology using SNMP v3)
- Looking for the Perfect Dashboard: InfluxDB, Telegraf, and Grafana – Part XLVI (Monitoring NVIDIA Jetson Nano)
- Looking for the Perfect Dashboard: InfluxDB, Telegraf, and Grafana – Part XLVII (Monitoring Open WebUI)
- Looking for the Perfect Dashboard: InfluxDB, Telegraf, and Grafana – Part XLVIII (Monitoring Veeam Data Platform Advanced)
- Looking for the Perfect Dashboard: InfluxDB, Telegraf, and Grafana – Part XLIX (Monitoring Unofficial Veeam ONE Node Exporter)
Leave a Reply