
 Greetings friends, today I bring you a new post about Grafana, today I hope you like it, it is something specific, because it is about importing the so important numbers from Runecast.
It’s a 1.0 version, I have some ideas in mind about this Dashboard, but I haven’t had enough time, I think it’s good enough for now, tell me what you think.
Dashboard for Runecast
When we finish the entry we will have something similar to that Dashboard that will allow you to visualize: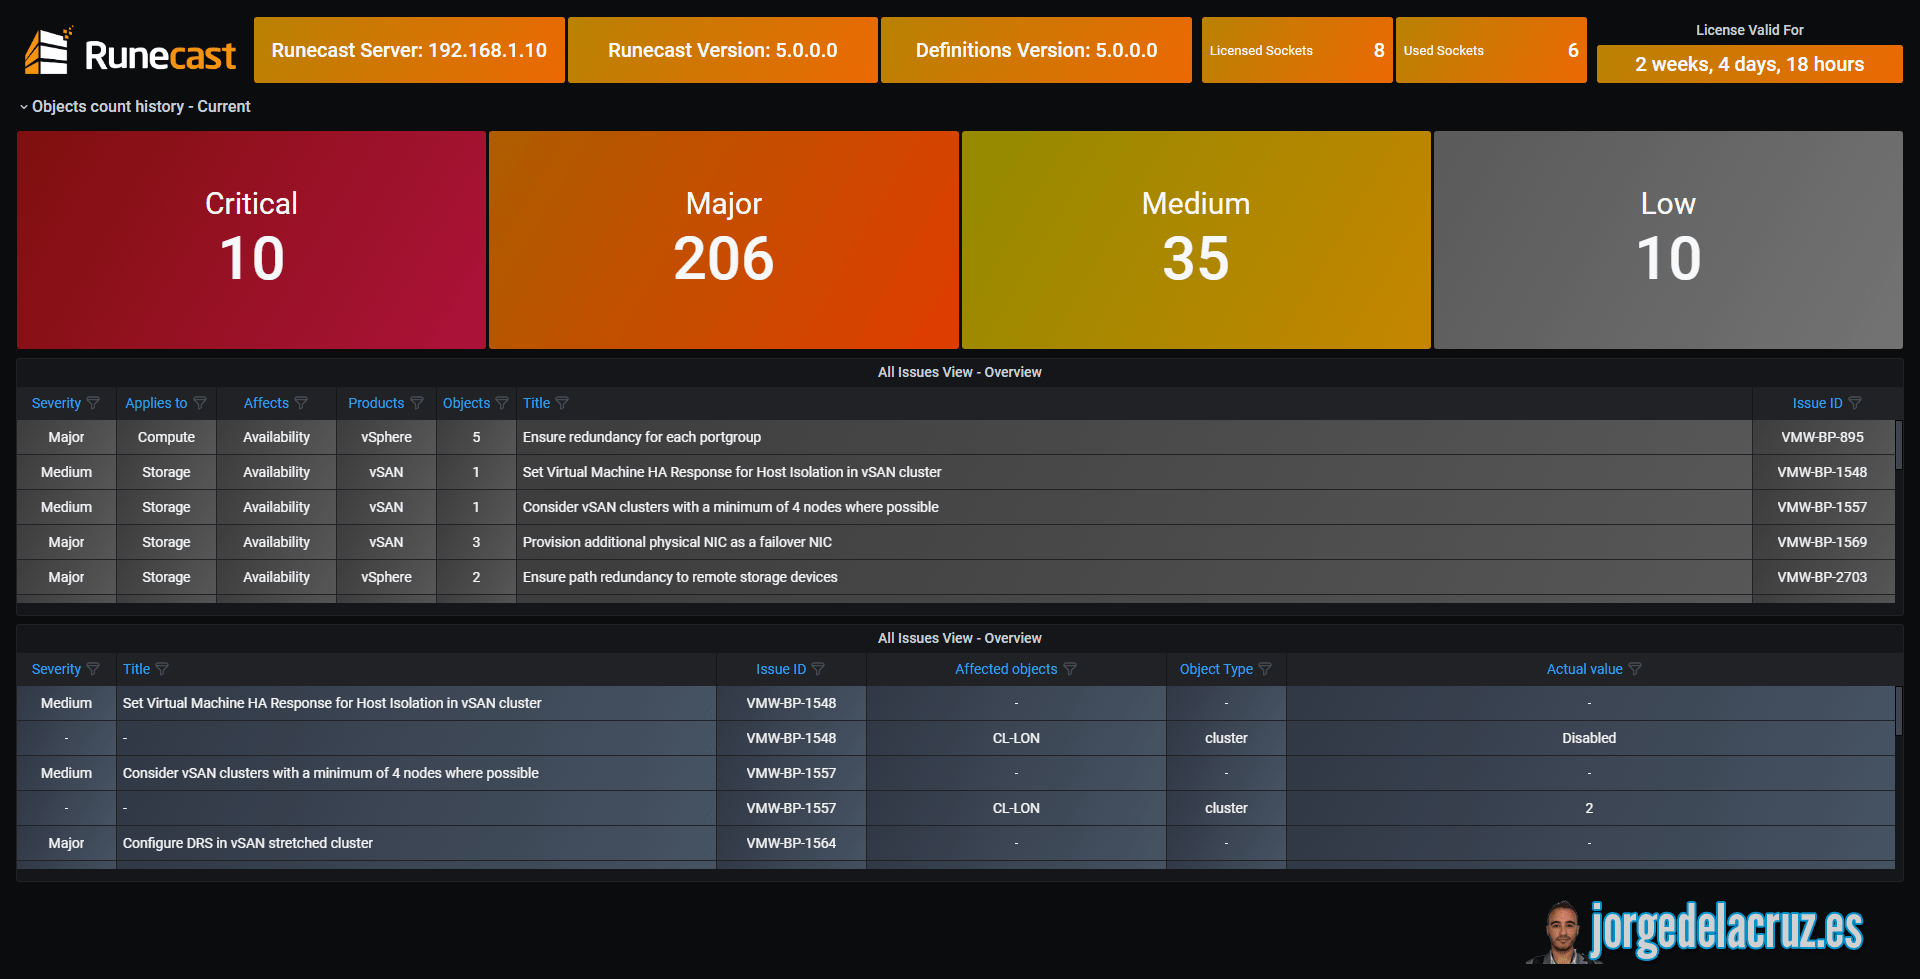
Dashboard – Summary.
This first dashboard of the series, because I intend to create maybe some more with other details, etc., contains:
- Runecast Appliance Overview – IP or FQDN of the Cluster, Version, and version definitions.
- Runecast Issues by Severity – Number of issues by Severity.
- Runecast Issues by Issue ID – A listing of all issues, including the Issue ID.
- Runecast Issues by each object – A listing of all issues, including the Issue ID.
Topology with all the logical components
This entry is similar to the previous ones since in this case, we will use a combination of a shell script to collect Runecast metrics using RESTful API and InfluxDB. The design would look something like this: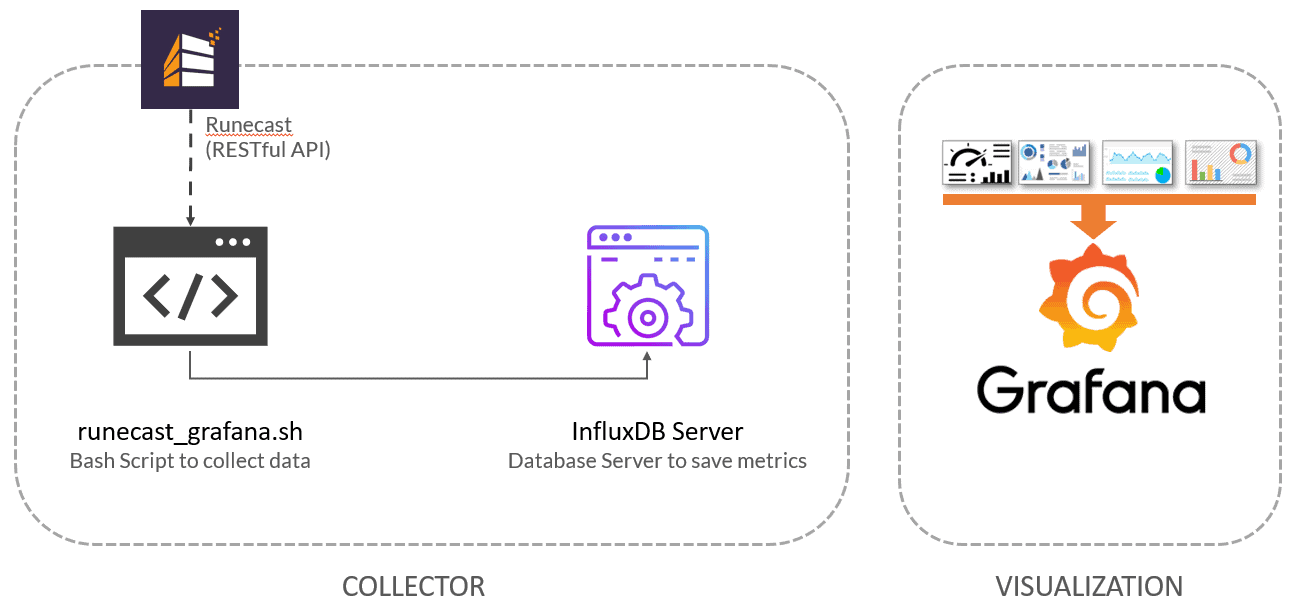 As we can see, the shell script will download the metrics from Runecast using the RESTful API, which will send all the data to InfluxDB, from where we can view them comfortably with Grafana.
Small system requirements before we continue
We will need two small system requirements before we continue, first will be JQ, which is a package that helps us parsing the JSON, let’s go and install it, yum install if CentOS:
apt-get install jq
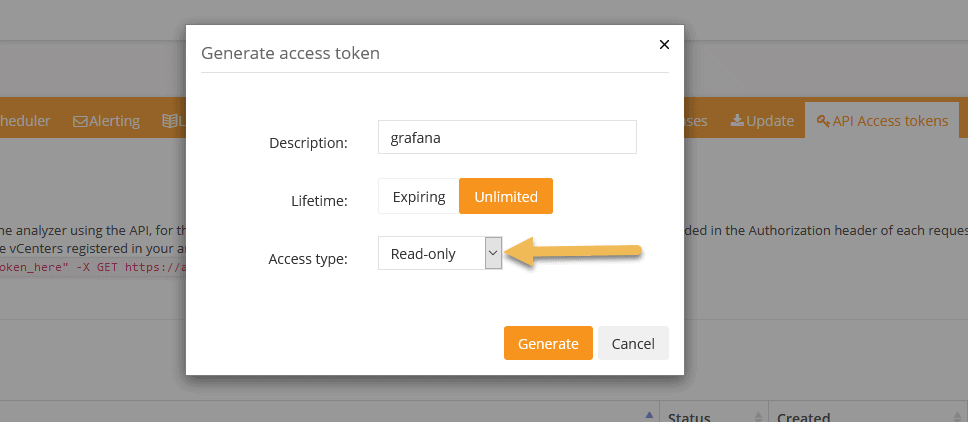
Another small system requirement is to get the Runecast API Access Token, to do so, let’s go to our Runecast Console, under Settings – API Access Tokens, click in Generate API access Token:
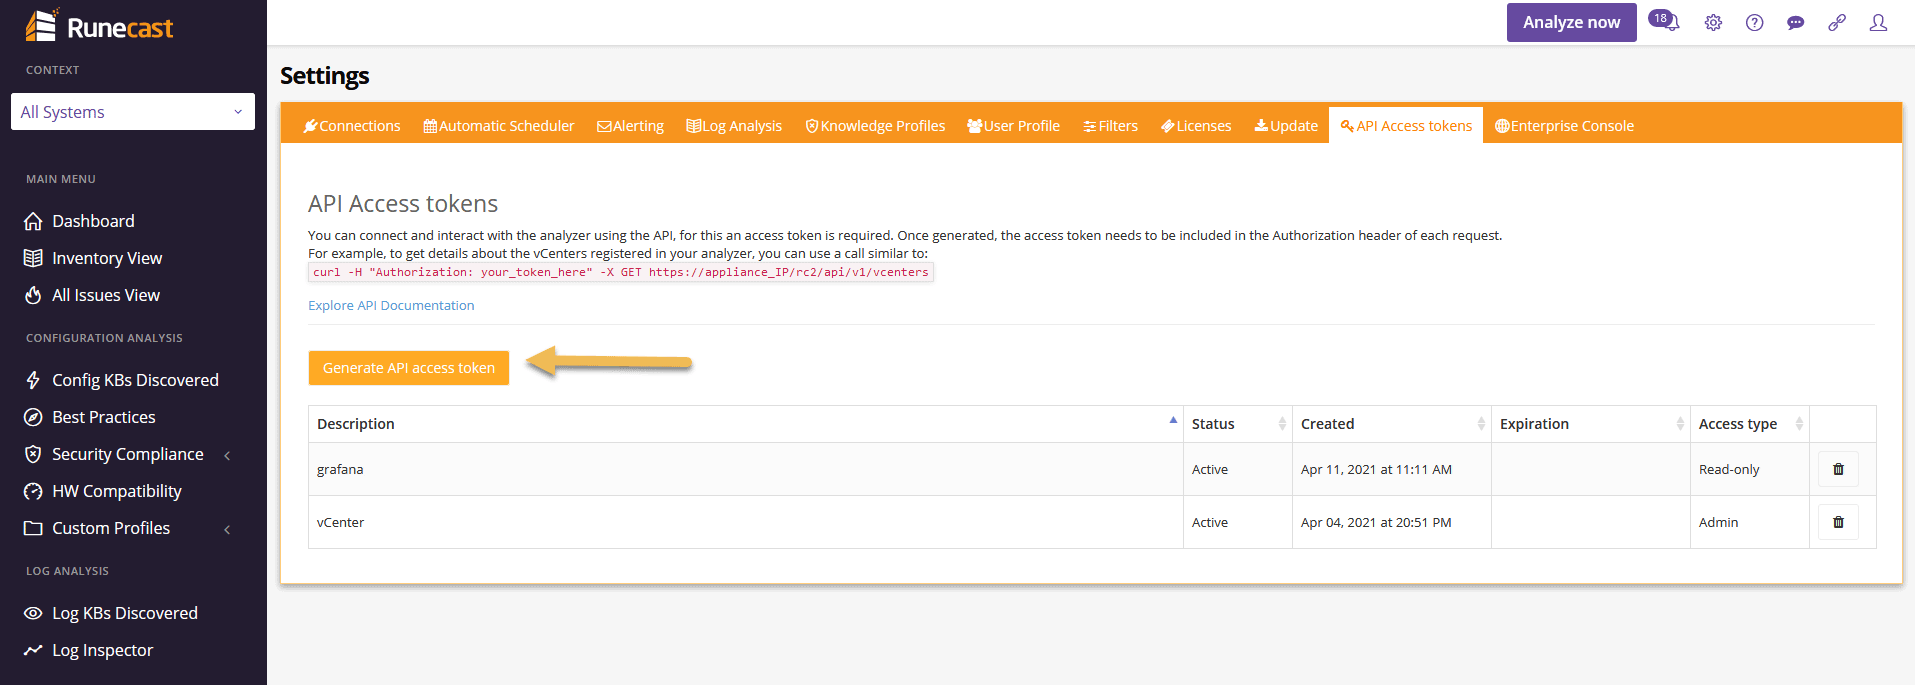 Let’s select read-only, and that it never expires:
 That’s it, ready for the next step:
Download, and configure the runecast_grafana.sh script.
We have almost everything ready, we have one last step, the script that will make all this work, we will download the latest version from the Github repository:
This shell script can be downloaded and run from the telegraf server, or influxDB, or any other Linux. We will have to edit the configuration parameters:
##
# Configurations
##
# Endpoint URL for InfluxDB
InfluxDBURL="http://YOURINFLUXSERVER" #Your InfluxDB Server, http://FQDN or https://FQDN if using SSL
InfluxDBPort="8086" #Default Port
InfluxDB="telegraf" #Default Database
InfluxDBUser="INFLUXUSER" #User for Database
InfluxDBPassword='INFLUXPASS' #Password for Database

# Endpoint URL for login action
runecastToken="RUNECASTOTKEN" #Your read-only Runecast token. You can quickly create one from the portal
runecastServer="RUNECASTFQDNORIP"
Once the changes are done, make the script executable with chmod:
chmod +x runecast_grafana.sh
We run it, and the output of the command should look something like the following, with no errors:
Writing runecast_results_analysis to InfluxDB
HTTP/1.1 204 No Content
Content-Type: application/json
Request-Id: 6cc3cc65-9b71-11eb-8794-0050569017a8
X-Influxdb-Build: OSS
X-Influxdb-Version: 1.8.4
X-Request-Id: 6cc3cc65-9b71-11eb-8794-0050569017a8
Date: Mon, 12 Apr 2021 09:28:22 GMT

Writing runecast_results_analysis to InfluxDB
HTTP/1.1 204 No Content
Content-Type: application/json
Request-Id: 6ce92985-9b71-11eb-8795-0050569017a8
X-Influxdb-Build: OSS
X-Influxdb-Version: 1.8.4
X-Request-Id: 6ce92985-9b71-11eb-8795-0050569017a8
Date: Mon, 12 Apr 2021 09:28:22 GMT
If so, please now add this script to your crontab, like for example every 5minutes, I don’t think our Dashboards are updated more often, but good to download it if so:
0 */6 * * * /home/oper/runecast_grafana.sh >> /var/log/runecast.log 2>&1
We are ready to go to the next step.
Grafana Dashboards
I created a Dashboard from scratch by selecting the best requests to the database, finalizing the colors, thinking about the graphics and how to display them, and everything is automated to fit our environment without any problems and without having to edit anything manually. The Dashboard can be found here, once imported, you can use the top drop-down menus to select between Runecast, Severity, etc:
Importing the Grafana Dashboard the easy way
So you don’t have to waste hours configuring a new Dashboard, and ingesting and debugging what you want, I have already created a wonderful Dashboard with everything you need to monitor our environment in a very simple way, it will look like the image I showed you above. Select the name you want and enter the ID: 14213, which is the unique ID of the Dashboard, or the URL:
 With the menus above, we can move between KB, Severity, etc.:
Please leave your comments here, or on GitHub, thanks a lot for reading!
I hope you like it, and I would like to leave you the complete series here, so you can start playing with the plugins that I have been telling you about all these years:
- Looking for the Perfect Dashboard: InfluxDB, Telegraf, and Grafana – Part I (Installing InfluxDB, Telegraf, and Grafana on Ubuntu 20.04 LTS)
- En busca del Dashboard perfecto: InfluxDB, Telegraf y Grafana – Parte II (Instalar agente Telegraf en Nodos remotos Linux)
- En busca del Dashboard perfecto: InfluxDB, Telegraf y Grafana – Parte III Integración con PRTG
- En busca del Dashboard perfecto: InfluxDB, Telegraf y Grafana – Parte IV (Instalar agente Telegraf en Nodos remotos Windows)
- En busca del Dashboard perfecto: InfluxDB, Telegraf y Grafana – Parte V (Activar inputs específicos, Red, MySQL/MariaDB, Nginx)
- En busca del Dashboard perfecto: InfluxDB, Telegraf y Grafana – Parte VI (Monitorizando Veeam)
- En busca del Dashboard perfecto: InfluxDB, Telegraf y Grafana – Parte VII (Monitorizar vSphere)
- En busca del Dashboard perfecto: InfluxDB, Telegraf y Grafana – Parte VIII (Monitorizando Veeam con Enterprise Manager)
- En busca del Dashboard perfecto: InfluxDB, Telegraf y Grafana – Parte IX (Monitorizando Zimbra Collaboration)
- En busca del Dashboard perfecto: InfluxDB, Telegraf y Grafana – Parte X (Grafana Plugins)
- En busca del Dashboard perfecto: InfluxDB, Telegraf y Grafana – Parte XI – (Monitorizando URL e IPS con Telegraf y Ping)
- Looking for the Perfect Dashboard: InfluxDB, Telegraf, and Grafana – Part XII (Native Telegraf Plugin for vSphere)
- Looking for the Perfect Dashboard: InfluxDB, Telegraf, and Grafana – Part XIII (Veeam Backup for Microsoft Office 365 v4)
- Looking for the Perfect Dashboard: InfluxDB, Telegraf, and Grafana – Part XIV – Veeam Availability Console
- Looking for the Perfect Dashboard: InfluxDB, Telegraf, and Grafana – Part XV (IPMI Monitoring of our ESXi Hosts)
- Looking for Perfect Dashboard: InfluxDB, Telegraf, and Grafana – Part XVI (Performance and Advanced Security of Veeam Backup for Microsoft Office 365)
- Looking for the Perfect Dashboard: InfluxDB, Telegraf, and Grafana – Part XVII (Showing Dashboards on Two Monitors Using Raspberry Pi 4)
- En busca del Dashboard perfecto: InfluxDB, Telegraf y Grafana – Parte XVIII – Monitorizar temperatura y estado de Raspberry Pi 4
- Looking for the Perfect Dashboard: InfluxDB, Telegraf, and Grafana – Part XIX (Monitoring Veeam with Enterprise Manager) Shell Script
- Looking for the Perfect Dashboard: InfluxDB, Telegraf, and Grafana – Part XXIV (Monitoring Veeam Backup for Microsoft Azure)
- Looking for the Perfect Dashboard: InfluxDB, Telegraf, and Grafana – Part XXV (Monitoring Power Consumption)
- Looking for the Perfect Dashboard: InfluxDB, Telegraf, and Grafana – Part XXVI (Monitoring Veeam Backup for Nutanix)
- Looking for the Perfect Dashboard: InfluxDB, Telegraf, and Grafana – Part XXVII (Monitoring ReFS and XFS (block-cloning and reflink)
- Looking for the Perfect Dashboard: InfluxDB, Telegraf, and Grafana – Part XXVIII (Monitoring HPE StoreOnce)
- Looking for the Perfect Dashboard: InfluxDB, Telegraf, and Grafana – Part XXIX (Monitoring Pi-hole)
- Looking for the Perfect Dashboard: InfluxDB, Telegraf, and Grafana – Part XXIX (Monitoring Veeam Backup for AWS)
- Looking for the Perfect Dashboard: InfluxDB, Telegraf, and Grafana – Part XXXI (Monitoring Unifi Protect)
- Looking for the Perfect Dashboard: InfluxDB, Telegraf, and Grafana – Part XXXII (Monitoring Veeam ONE – experimental)
- Looking for the Perfect Dashboard: InfluxDB, Telegraf, and Grafana – Part XXXIII (Monitoring NetApp ONTAP)
- Looking for the Perfect Dashboard: InfluxDB, Telegraf, and Grafana – Part XXXIV (Monitoring Runecast)
- Looking for the Perfect Dashboard: InfluxDB, Telegraf, and Grafana – Part XXXV (GPU Monitoring)
- Looking for the Perfect Dashboard: InfluxDB, Telegraf, and Grafana – Part XXXVI (Monitoring Goldshell Miners – JSONv2)
- Looking for the Perfect Dashboard: InfluxDB, Telegraf, and Grafana – Part XXXVII (Monitoring Veeam Backup for Google Cloud Platform)
- En Busca del Dashboard perfecto: InfluxDB, Telegraf y Grafana – Parte XXXVIII (Monitorizando Temperatura y Humedad con Xiaomi Mijia)
- Looking for the Perfect Dashboard: InfluxDB, Telegraf, and Grafana – Part XL (Veeam Backup for Microsoft 365 – Restore Audit)
- Looking for the Perfect Dashboard: InfluxDB, Telegraf, and Grafana – Part XLI (Veeam Backup for Salesforce)
- Looking for the Perfect Dashboard: InfluxDB, Telegraf, and Grafana – Part XLII (Veeam ONE v12 Audit Events)
- Looking for the Perfect Dashboard: InfluxDB, Telegraf, and Grafana – Part XLIII (Monitoring QNAP using SNMP v3)
- Looking for the Perfect Dashboard: InfluxDB, Telegraf, and Grafana – Part XLIV (Monitoring Veeam Backup & Replication API)
- Looking for the Perfect Dashboard: InfluxDB, Telegraf, and Grafana – Part XLV (Monitoring Synology using SNMP v3)
- Looking for the Perfect Dashboard: InfluxDB, Telegraf, and Grafana – Part XLVI (Monitoring NVIDIA Jetson Nano)
- Looking for the Perfect Dashboard: InfluxDB, Telegraf, and Grafana – Part XLVII (Monitoring Open WebUI)
- Looking for the Perfect Dashboard: InfluxDB, Telegraf, and Grafana – Part XLVIII (Monitoring Veeam Data Platform Advanced)
- Looking for the Perfect Dashboard: InfluxDB, Telegraf, and Grafana – Part XLIX (Monitoring Unofficial Veeam ONE Node Exporter)
Leave a Reply