
 Greetings friends, it’s been a while since I’ve added to the In Search of the Perfect Dashboard series, but it’s time to continue. Today I bring you a very interesting post, that I was really looking forward to adding to the series, it’s about how to collect Goldshell Miners statistics, using the new JSON Parser v2.
Once we finish all the steps, you should have a result similar to the following: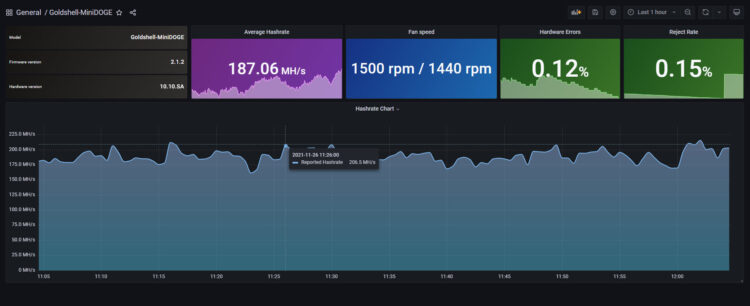
As you may know, if you use Goldshell, it looks like the default interface of the solution.
What is Goldshell Miner?
Goldshell is a well-known brand that produces mining machines better known as ASIC. The only purpose of these devices is to mine cryptocurrency, they do not serve for anything else, in fact, they only have an Ethernet port and another one for electricity.
I am using, in particular, the Goldshell Mini-DOGE which mines, using scrypt, LTC, and DOGE, it does not have a very high hash rate, only 185 MH/s or so, which is more than enough really.

How much money does this machine generate? I leave you my numbers, which may be more or less depending on the value of the coin we mine, in this case, LTC and DOGE, when I write this it is somewhat low, LTC at 173.15, and DOGE at 0.18, this is what it has generated in the month of October 2021:
DOGE
| Date | Coins mined | Value in EUR |
| 2021-10-01 | 8,1598656 | 1,550374 |
| 2021-10-02 | 6,99541612 | 1,329129 |
| 2021-10-03 | 7,31178525 | 1,389239 |
| 2021-10-04 | 7,47747762 | 1,420721 |
| 2021-10-05 | 8,1328704 | 1,545245 |
| 2021-10-06 | 6,76658254 | 1,285651 |
| 2021-10-07 | 6,69766077 | 1,272556 |
| 2021-10-08 | 7,87538981 | 1,496324 |
| 2021-10-09 | 7,4452416 | 1,414596 |
| 2021-10-10 | 7,44087167 | 1,413766 |
| 2021-10-11 | 7,25807395 | 1,379034 |
| 2021-10-12 | 7,6615374 | 1,455692 |
| 2021-10-13 | 7,59237839 | 1,442552 |
| 2021-10-14 | 7,11715188 | 1,352259 |
| 2021-10-15 | 8,107396 | 1,540405 |
| 2021-10-16 | 7,30525001 | 1,387998 |
| 2021-10-17 | 7,65426764 | 1,454311 |
| 2021-10-18 | 7,33102042 | 1,392894 |
| 2021-10-19 | 7,96506716 | 1,513363 |
| 2021-10-20 | 7,22315873 | 1,3724 |
| 2021-10-21 | 7,31601566 | 1,390043 |
| 2021-10-22 | 7,4932752 | 1,423722 |
| 2021-10-23 | 7,57495725 | 1,439242 |
| 2021-10-24 | 7,32556431 | 1,391857 |
| 2021-10-25 | 7,84407088 | 1,490373 |
| 2021-10-26 | 7,56300584 | 1,436971 |
| 2021-10-27 | 6,85135887 | 1,301758 |
| 2021-10-28 | 7,06302577 | 1,341975 |
| 2021-10-29 | 7,921111 | 1,505011 |
| 2021-10-30 | 6,95929214 | 1,322266 |
| 2021-10-31 | 7,1664946 | 1,361634 |
| Total | 230,5966345 | 43,81336 |
LTC
| Date | Coins mined | Value in EUR |
| 2021-10-01 | 0,00424993 | 0,735875 |
| 2021-10-02 | 0,00406853 | 0,704466 |
| 2021-10-03 | 0,00413096 | 0,715276 |
| 2021-10-04 | 0,00419276 | 0,725976 |
| 2021-10-05 | 0,00423587 | 0,733441 |
| 2021-10-06 | 0,00424382 | 0,734817 |
| 2021-10-07 | 0,00400431 | 0,693346 |
| 2021-10-08 | 0,00405578 | 0,702258 |
| 2021-10-09 | 0,00387773 | 0,671429 |
| 2021-10-10 | 0,00421245 | 0,729386 |
| 2021-10-11 | 0,00441005 | 0,7636 |
| 2021-10-12 | 0,00422546 | 0,731638 |
| 2021-10-13 | 0,0042916 | 0,743091 |
| 2021-10-14 | 0,00403777 | 0,69914 |
| 2021-10-15 | 0,0039327 | 0,680947 |
| 2021-10-16 | 0,00395521 | 0,684845 |
| 2021-10-17 | 0,00404578 | 0,700527 |
| 2021-10-18 | 0,00409064 | 0,708294 |
| 2021-10-19 | 0,00401854 | 0,69581 |
| 2021-10-20 | 0,00415581 | 0,719579 |
| 2021-10-21 | 0,00412852 | 0,714853 |
| 2021-10-22 | 0,00405836 | 0,702705 |
| 2021-10-23 | 0,00406549 | 0,70394 |
| 2021-10-24 | 0,0042062 | 0,728304 |
| 2021-10-25 | 0,00419289 | 0,725999 |
| 2021-10-26 | 0,00406101 | 0,703164 |
| 2021-10-27 | 0,00400536 | 0,693528 |
| 2021-10-28 | 0,00364861 | 0,631757 |
| 2021-10-29 | 0,00389534 | 0,674478 |
| 2021-10-30 | 0,00380512 | 0,658857 |
| 2021-10-31 | 0,00370967 | 0,642329 |
| Total | 0,12621227 | 21,85365 |
65,66 Euros in total has generated the machine, depending on your electricity rates, and if DOGE and LTC go up some more, we could pay the cost, 700 Euros, of the machine in a year or a little less. This is not financial advice, do your own research, buy it or not. This entry is, as usual, to see how to monitor this equipment.
Configuring Telegraf to parse the new .json and send it to InfluxDB
This time I am going to use the always versatile inputs.http, to parse directly from the .json, the configuration could not be easier, I have created a new file under /etc/telegraf/telegraf.d/goldlshell.conf with this inside, just change the URL to your GoldShell:
[[inputs.http]]
    urls = ["http://YOURGOLDSHELLIP/mcb/cgminer?cgminercmd=devs"]
    data_format = "json_v2"
        [[inputs.http.json_v2]]
            measurement_name = "goldshell_stats"
        [[inputs.http.json_v2.object]]
            path = "data"

[[inputs.http]]
    urls = ["http://YOURGOLDSHELLIP/mcb/status"]
    data_format = "json_v2"
        [[inputs.http.json_v2]]
            measurement_name = "goldshell_stats"

            [[inputs.http.json_v2.field]]
                path = "hardware"

            [[inputs.http.json_v2.field]]
                path = "model"

            [[inputs.http.json_v2.field]]
                path = "firmware"
To test that everything is working properly we launch the following:
telegraf --config /etc/telegraf/telegraf.d/goldhsell.conf --test
The command should give us something similar to the following if everything works well:
> goldshell_stats,host=tig-monitor,url=http://192.168.1.245/mcb/status firmware="2.1.2",hardware="10.10.SA",model="Goldshell-MiniDOGE" 1637944046000000000
> goldshell_stats,host=tig-monitor,url=http://192.168.1.245/mcb/cgminer?cgminercmd\=devs accepted=7811,adjustpower=0,av_hashrate=187.002,fanspeed="1560 rpm / 1500 rpm",hashrate=172.81200000000004,hwerr_ration=0.001166,hwerrors=748,id=0,minerstatus=0,nonces=644008,powerplan=0,rejected=11,temp="77.3 °C",time=3078,valid=0 1637944046000000000
We will now have to restart the telegraph service:
systemctl restart telegraf
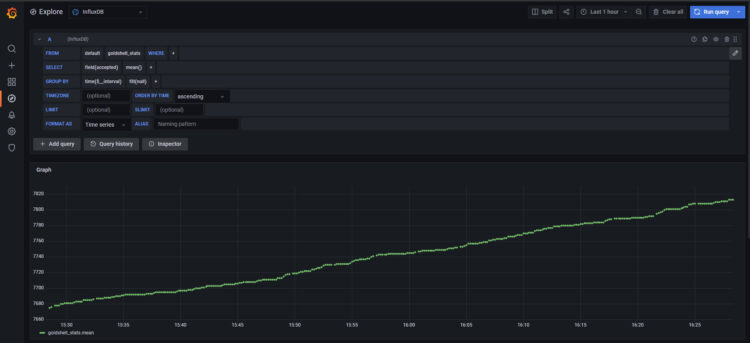
If we go to our Grafana – Explorer, we can see that we have data!
Grafana Dashboard to see everything in a centralized way.
Now that we have all this information, we probably want to show it in a more elegant way.
By simply importing the following Dashboard using the Grafana URL, you will have something similar to this:
At the end of it all, if everything went well, you will be able to see your cool Goldshell Dashboard and know your hashrate, hw errors, etc.
I hope you like it, and I would like to leave you the complete series here, so you can start playing with the plugins that I have been telling you about all these years:
- Looking for the Perfect Dashboard: InfluxDB, Telegraf, and Grafana – Part I (Installing InfluxDB, Telegraf, and Grafana on Ubuntu 20.04 LTS)
- En busca del Dashboard perfecto: InfluxDB, Telegraf y Grafana – Parte II (Instalar agente Telegraf en Nodos remotos Linux)
- En busca del Dashboard perfecto: InfluxDB, Telegraf y Grafana – Parte III Integración con PRTG
- En busca del Dashboard perfecto: InfluxDB, Telegraf y Grafana – Parte IV (Instalar agente Telegraf en Nodos remotos Windows)
- En busca del Dashboard perfecto: InfluxDB, Telegraf y Grafana – Parte V (Activar inputs específicos, Red, MySQL/MariaDB, Nginx)
- En busca del Dashboard perfecto: InfluxDB, Telegraf y Grafana – Parte VI (Monitorizando Veeam)
- En busca del Dashboard perfecto: InfluxDB, Telegraf y Grafana – Parte VII (Monitorizar vSphere)
- En busca del Dashboard perfecto: InfluxDB, Telegraf y Grafana – Parte VIII (Monitorizando Veeam con Enterprise Manager)
- En busca del Dashboard perfecto: InfluxDB, Telegraf y Grafana – Parte IX (Monitorizando Zimbra Collaboration)
- En busca del Dashboard perfecto: InfluxDB, Telegraf y Grafana – Parte X (Grafana Plugins)
- En busca del Dashboard perfecto: InfluxDB, Telegraf y Grafana – Parte XI – (Monitorizando URL e IPS con Telegraf y Ping)
- Looking for the Perfect Dashboard: InfluxDB, Telegraf, and Grafana – Part XII (Native Telegraf Plugin for vSphere)
- Looking for the Perfect Dashboard: InfluxDB, Telegraf, and Grafana – Part XIII (Veeam Backup for Microsoft Office 365 v4)
- Looking for the Perfect Dashboard: InfluxDB, Telegraf, and Grafana – Part XIV – Veeam Availability Console
- Looking for the Perfect Dashboard: InfluxDB, Telegraf, and Grafana – Part XV (IPMI Monitoring of our ESXi Hosts)
- Looking for Perfect Dashboard: InfluxDB, Telegraf, and Grafana – Part XVI (Performance and Advanced Security of Veeam Backup for Microsoft Office 365)
- Looking for the Perfect Dashboard: InfluxDB, Telegraf, and Grafana – Part XVII (Showing Dashboards on Two Monitors Using Raspberry Pi 4)
- En busca del Dashboard perfecto: InfluxDB, Telegraf y Grafana – Parte XVIII – Monitorizar temperatura y estado de Raspberry Pi 4
- Looking for the Perfect Dashboard: InfluxDB, Telegraf, and Grafana – Part XIX (Monitoring Veeam with Enterprise Manager) Shell Script
- Looking for the Perfect Dashboard: InfluxDB, Telegraf, and Grafana – Part XXIV (Monitoring Veeam Backup for Microsoft Azure)
- Looking for the Perfect Dashboard: InfluxDB, Telegraf, and Grafana – Part XXV (Monitoring Power Consumption)
- Looking for the Perfect Dashboard: InfluxDB, Telegraf, and Grafana – Part XXVI (Monitoring Veeam Backup for Nutanix)
- Looking for the Perfect Dashboard: InfluxDB, Telegraf, and Grafana – Part XXVII (Monitoring ReFS and XFS (block-cloning and reflink)
- Looking for the Perfect Dashboard: InfluxDB, Telegraf, and Grafana – Part XXVIII (Monitoring HPE StoreOnce)
- Looking for the Perfect Dashboard: InfluxDB, Telegraf, and Grafana – Part XXIX (Monitoring Pi-hole)
- Looking for the Perfect Dashboard: InfluxDB, Telegraf, and Grafana – Part XXIX (Monitoring Veeam Backup for AWS)
- Looking for the Perfect Dashboard: InfluxDB, Telegraf, and Grafana – Part XXXI (Monitoring Unifi Protect)
- Looking for the Perfect Dashboard: InfluxDB, Telegraf, and Grafana – Part XXXII (Monitoring Veeam ONE – experimental)
- Looking for the Perfect Dashboard: InfluxDB, Telegraf, and Grafana – Part XXXIII (Monitoring NetApp ONTAP)
- Looking for the Perfect Dashboard: InfluxDB, Telegraf, and Grafana – Part XXXIV (Monitoring Runecast)
- Looking for the Perfect Dashboard: InfluxDB, Telegraf, and Grafana – Part XXXV (GPU Monitoring)
- Looking for the Perfect Dashboard: InfluxDB, Telegraf, and Grafana – Part XXXVI (Monitoring Goldshell Miners – JSONv2)
- Looking for the Perfect Dashboard: InfluxDB, Telegraf, and Grafana – Part XXXVII (Monitoring Veeam Backup for Google Cloud Platform)
- En Busca del Dashboard perfecto: InfluxDB, Telegraf y Grafana – Parte XXXVIII (Monitorizando Temperatura y Humedad con Xiaomi Mijia)
- Looking for the Perfect Dashboard: InfluxDB, Telegraf, and Grafana – Part XL (Veeam Backup for Microsoft 365 – Restore Audit)
- Looking for the Perfect Dashboard: InfluxDB, Telegraf, and Grafana – Part XLI (Veeam Backup for Salesforce)
- Looking for the Perfect Dashboard: InfluxDB, Telegraf, and Grafana – Part XLII (Veeam ONE v12 Audit Events)
- Looking for the Perfect Dashboard: InfluxDB, Telegraf, and Grafana – Part XLIII (Monitoring QNAP using SNMP v3)
- Looking for the Perfect Dashboard: InfluxDB, Telegraf, and Grafana – Part XLIV (Monitoring Veeam Backup & Replication API)
- Looking for the Perfect Dashboard: InfluxDB, Telegraf, and Grafana – Part XLV (Monitoring Synology using SNMP v3)
- Looking for the Perfect Dashboard: InfluxDB, Telegraf, and Grafana – Part XLVI (Monitoring NVIDIA Jetson Nano)
- Looking for the Perfect Dashboard: InfluxDB, Telegraf, and Grafana – Part XLVII (Monitoring Open WebUI)
- Looking for the Perfect Dashboard: InfluxDB, Telegraf, and Grafana – Part XLVIII (Monitoring Veeam Data Platform Advanced)
- Looking for the Perfect Dashboard: InfluxDB, Telegraf, and Grafana – Part XLIX (Monitoring Unofficial Veeam ONE Node Exporter)
Leave a Reply