
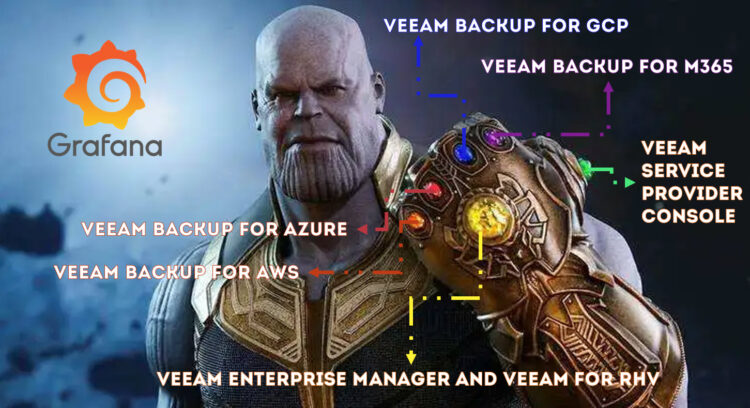
 Greetings friends, before 2021 ended, I spent a few hours digging on Veeam Backup for Google Cloud Platform API. After a few hours, I was able to finally build the last Veeam Dashboard to complete the gauntlet: Every single Veeam product that has reached GA, and included an API, have now a dedicated Grafana Dashboard.
But, why all of this hard work, why Dashboards?
Let me tell you a story. For a long, like a long time, I always wanted to become a Technical Evangelist, the role at the time sounded great, the duties, presenting in front of an audience, doing labs, early access to software in order to build content, etc. Sounded like what I do in my free time since 2011, but with a salary and a bigger team to learn from each other.
In order to achieve this difficult, if not impossible, career goal. I needed practice and what better place to practice in front of an audience than at events like VeeamON. In the past, Veeam welcomed Community, Customers, and Partners Call for Papers.
Late 2016, early 2017 were the years that I started playing with Grafana, and InfluxDB, and seemed like an amazing way of showing useful data, like the status of your latest Data Protection Jobs.
I was confident, like Icarus on his first flight, I’ve spent a few weeks building a simple PowerShell script that queried Veeam, pushed the data to InfluxDB, and used Grafana as a Dashboarding tool, gosh look at the ugly dashboard (apologies):
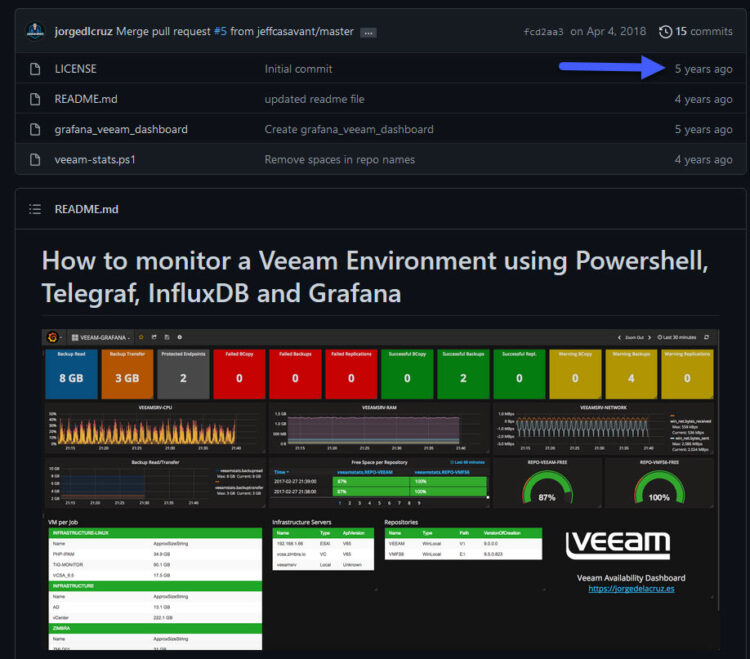
 With that very basic work built, I’ve tried to present at that VeeamON my work, even prepared a t-shirt in case I had the opportunity to present. Unfortunately, the session was rejected. I then tried on subsequent VeeamON events, but the Grafana Dashboards never had their shining moment, yet, after all these years.
Always looking at a positive note, the learning journey with Grafana, InfluxDB, Telegraf, and the API lead me to this very moment, 37 unique Dashboards after, and having all Veeam products under Grafana, all free, and open-source, built by the Community for the Community.
The journey path also allowed me to be part of a few Community programs like:
- vExpert – Which helped me as well to present at VMworld 2021 about Grafana, and VMware.
- Veeam MVP – A Veeam internal group of individuals who contribute to the overall Veeam Community.
- InfluxAce – Community program from the guys at InfluxData. Great group full of other Community members with a passion for Data Observability.
Today, I am pleased to bring you a complete and finished Dashboard to monitor Veeam Backup for Google Cloud Platform, without limit of VMs, jobs, or Repos.
You will see that there is a Map inside the Dashboard, and that’s because I consider it quite important to be able to look globally and see what regions have unprotected VMs.
Veeam Backup for Google Cloud Platform Dashboard
When you finish the entry you will have something similar to this Dashboard:
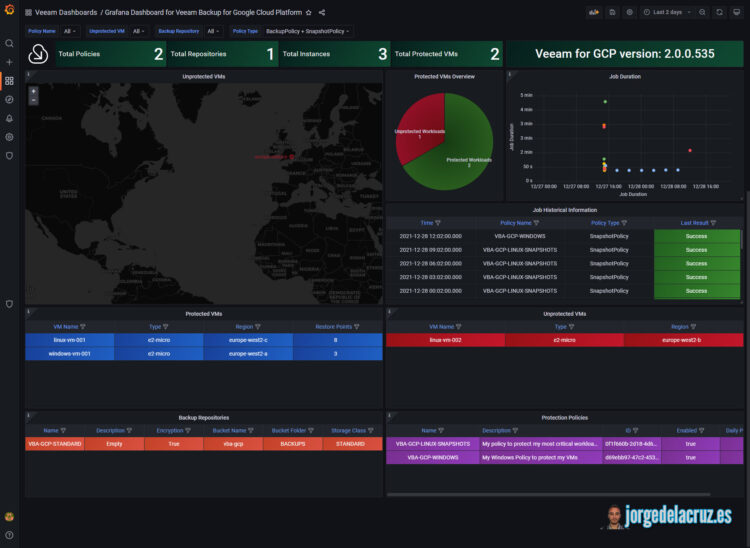
Dashboard – Summary
- Summary – Total number of Repos, Policies, Protected VMs, and VBA version
- Unprotected VMs – Both, in a useful list with size, region, and name. And with a really great visual Map to see the unprotected GCP Regions
- Job Historical Information – A simple table with the last jobs and the status, it also includes if it is a Snapshot Job or Backup Job
- Job Duration – A simple graph that shows the duration per job across time
- Protected vs. Unprotected VMs
Topology with all logical components
This entry is a little different from the previous ones since in this case, we will use a shell script to collect the Veeam Backup for Google Cloud Platform metrics using RESTful API. The design would be something similar to this:
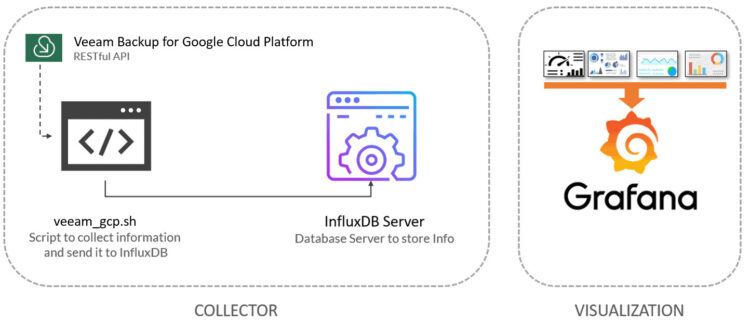
As we can see, the shell script will download metrics from Veeam Backup for Google Cloud Platform using RESTful API, which will send to InfluxDB as well, from where we can comfortably view them with Grafana.
Download and configure the veeam_gcp.sh script
We have almost everything ready, we have one last step, the script that will make all this work, we will download the latest version from the Github repository:
This shell script can be downloaded and run from the telegraf server, InfluxDB, or any other Linux. We will have to edit the configuration parameters:
# Configurations
##
# Endpoint URL for InfluxDB
veeamInfluxDBURL="YOURINFLUXSERVER" ##Use https://fqdn or https://IP in case you use SSL
veeamInfluxDBPort="8086" #Default Port
veeamInfluxDBBucket="veeam" # InfluxDB bucket name (not ID)
veeamInfluxDBToken="TOKEN" # InfluxDB access token with read/write privileges for the bucket
veeamInfluxDBOrg="ORG NAME" # InfluxDB organisation name (not ID)

# Endpoint URL for login action
veeamUsername="YOURVEEAMBACKUPUSER"
veeamPassword="YOURVEEAMBACKUPPASS"
veeamBackupGCPServer="https://YOURVEEAMBACKUPIP"
veeamBackupGCPPort="13140" #Default Port
Once the changes are done, make the script executable with chmod:
chmod +x veeam_gcp.sh
The output of the command should be something like the next, without errors:
HTTP/1.1 204 No Content
Content-Type: application/json
Request-Id: 42df97bc-8ac8-11ea-8168-0050569002da
X-Influxdb-Build: OSS
X-Influxdb-Version: 2.1.0
X-Request-Id: 42df97bc-8ac8-11ea-8168-0050569002da
Date: Thu, 30 Dec 2021 09:52:10 GMT
If so, please now add this script to your crontab, like for example every 30 minutes:
*/30 * * * * /home/oper/veeam_gcp.sh >> /var/log/veeamgcp.log 2>&1
We are ready to move to the next step.
Grafana Dashboards
I created a Dashboard from scratch by selecting the best requests to the database, finishing off colors, thinking about graphics, and how to display them, and everything is automated so that it fits our environment without any problem and without having to edit anything manually. The Dashboard can be found here, once imported, you can use the top drop-down menus to select between organizations, backups, repositories and proxies, VMs, etc.:
Import Grafana Dashboards easily
So that you don’t have to waste hours configuring a new Dashboard, and ingesting and debugging you want, I have already a wonderful Dashboard with everything you need to monitor our environment in a very simple way, you will be like the image I showed you above. Select the name you want and enter the ID: 12204, which is the unique ID of the Dashboard, or the URL:
 With the menus above you can display and adjust the Dashboard to your different choices:
Please leave your feedback in the comments, or on GitHub.
That’s all folks, if you want to follow the full Blog series about Grafana, InfluxDB, Telegraf, please click on the next links:
I hope you like it, and I would like to leave you the complete series here, so you can start playing with the plugins that I have been telling you about all these years:
- Looking for the Perfect Dashboard: InfluxDB, Telegraf, and Grafana – Part I (Installing InfluxDB, Telegraf, and Grafana on Ubuntu 20.04 LTS)
- En busca del Dashboard perfecto: InfluxDB, Telegraf y Grafana – Parte II (Instalar agente Telegraf en Nodos remotos Linux)
- En busca del Dashboard perfecto: InfluxDB, Telegraf y Grafana – Parte III Integración con PRTG
- En busca del Dashboard perfecto: InfluxDB, Telegraf y Grafana – Parte IV (Instalar agente Telegraf en Nodos remotos Windows)
- En busca del Dashboard perfecto: InfluxDB, Telegraf y Grafana – Parte V (Activar inputs específicos, Red, MySQL/MariaDB, Nginx)
- En busca del Dashboard perfecto: InfluxDB, Telegraf y Grafana – Parte VI (Monitorizando Veeam)
- En busca del Dashboard perfecto: InfluxDB, Telegraf y Grafana – Parte VII (Monitorizar vSphere)
- En busca del Dashboard perfecto: InfluxDB, Telegraf y Grafana – Parte VIII (Monitorizando Veeam con Enterprise Manager)
- En busca del Dashboard perfecto: InfluxDB, Telegraf y Grafana – Parte IX (Monitorizando Zimbra Collaboration)
- En busca del Dashboard perfecto: InfluxDB, Telegraf y Grafana – Parte X (Grafana Plugins)
- En busca del Dashboard perfecto: InfluxDB, Telegraf y Grafana – Parte XI – (Monitorizando URL e IPS con Telegraf y Ping)
- Looking for the Perfect Dashboard: InfluxDB, Telegraf, and Grafana – Part XII (Native Telegraf Plugin for vSphere)
- Looking for the Perfect Dashboard: InfluxDB, Telegraf, and Grafana – Part XIII (Veeam Backup for Microsoft Office 365 v4)
- Looking for the Perfect Dashboard: InfluxDB, Telegraf, and Grafana – Part XIV – Veeam Availability Console
- Looking for the Perfect Dashboard: InfluxDB, Telegraf, and Grafana – Part XV (IPMI Monitoring of our ESXi Hosts)
- Looking for Perfect Dashboard: InfluxDB, Telegraf, and Grafana – Part XVI (Performance and Advanced Security of Veeam Backup for Microsoft Office 365)
- Looking for the Perfect Dashboard: InfluxDB, Telegraf, and Grafana – Part XVII (Showing Dashboards on Two Monitors Using Raspberry Pi 4)
- En busca del Dashboard perfecto: InfluxDB, Telegraf y Grafana – Parte XVIII – Monitorizar temperatura y estado de Raspberry Pi 4
- Looking for the Perfect Dashboard: InfluxDB, Telegraf, and Grafana – Part XIX (Monitoring Veeam with Enterprise Manager) Shell Script
- Looking for the Perfect Dashboard: InfluxDB, Telegraf, and Grafana – Part XXIV (Monitoring Veeam Backup for Microsoft Azure)
- Looking for the Perfect Dashboard: InfluxDB, Telegraf, and Grafana – Part XXV (Monitoring Power Consumption)
- Looking for the Perfect Dashboard: InfluxDB, Telegraf, and Grafana – Part XXVI (Monitoring Veeam Backup for Nutanix)
- Looking for the Perfect Dashboard: InfluxDB, Telegraf, and Grafana – Part XXVII (Monitoring ReFS and XFS (block-cloning and reflink)
- Looking for the Perfect Dashboard: InfluxDB, Telegraf, and Grafana – Part XXVIII (Monitoring HPE StoreOnce)
- Looking for the Perfect Dashboard: InfluxDB, Telegraf, and Grafana – Part XXIX (Monitoring Pi-hole)
- Looking for the Perfect Dashboard: InfluxDB, Telegraf, and Grafana – Part XXIX (Monitoring Veeam Backup for AWS)
- Looking for the Perfect Dashboard: InfluxDB, Telegraf, and Grafana – Part XXXI (Monitoring Unifi Protect)
- Looking for the Perfect Dashboard: InfluxDB, Telegraf, and Grafana – Part XXXII (Monitoring Veeam ONE – experimental)
- Looking for the Perfect Dashboard: InfluxDB, Telegraf, and Grafana – Part XXXIII (Monitoring NetApp ONTAP)
- Looking for the Perfect Dashboard: InfluxDB, Telegraf, and Grafana – Part XXXIV (Monitoring Runecast)
- Looking for the Perfect Dashboard: InfluxDB, Telegraf, and Grafana – Part XXXV (GPU Monitoring)
- Looking for the Perfect Dashboard: InfluxDB, Telegraf, and Grafana – Part XXXVI (Monitoring Goldshell Miners – JSONv2)
- Looking for the Perfect Dashboard: InfluxDB, Telegraf, and Grafana – Part XXXVII (Monitoring Veeam Backup for Google Cloud Platform)
- En Busca del Dashboard perfecto: InfluxDB, Telegraf y Grafana – Parte XXXVIII (Monitorizando Temperatura y Humedad con Xiaomi Mijia)
- Looking for the Perfect Dashboard: InfluxDB, Telegraf, and Grafana – Part XL (Veeam Backup for Microsoft 365 – Restore Audit)
- Looking for the Perfect Dashboard: InfluxDB, Telegraf, and Grafana – Part XLI (Veeam Backup for Salesforce)
- Looking for the Perfect Dashboard: InfluxDB, Telegraf, and Grafana – Part XLII (Veeam ONE v12 Audit Events)
- Looking for the Perfect Dashboard: InfluxDB, Telegraf, and Grafana – Part XLIII (Monitoring QNAP using SNMP v3)
- Looking for the Perfect Dashboard: InfluxDB, Telegraf, and Grafana – Part XLIV (Monitoring Veeam Backup & Replication API)
- Looking for the Perfect Dashboard: InfluxDB, Telegraf, and Grafana – Part XLV (Monitoring Synology using SNMP v3)
- Looking for the Perfect Dashboard: InfluxDB, Telegraf, and Grafana – Part XLVI (Monitoring NVIDIA Jetson Nano)
- Looking for the Perfect Dashboard: InfluxDB, Telegraf, and Grafana – Part XLVII (Monitoring Open WebUI)
- Looking for the Perfect Dashboard: InfluxDB, Telegraf, and Grafana – Part XLVIII (Monitoring Veeam Data Platform Advanced)
- Looking for the Perfect Dashboard: InfluxDB, Telegraf, and Grafana – Part XLIX (Monitoring Unofficial Veeam ONE Node Exporter)
Brilliant work, Jorge! Quick question, would you know how I would be able to substitute veeamPassword=”YOURVEEAMBACKUPPASS” to use authorization and refresh tokens instead, rather than a plain text password?
Hello K,
I have replied to you on GitHub directly. I would give it a try, but we do require to auth at some point against the API, using tokens and refresh tokens will involve manual process most likely.
Will give it a try.