
 Greetings friends, another fabolous Veeam release, I am talking about Veeam Backup for Salesforce, and another Dashboard for your Grafana. This blog entry is a bit particular, as I am using the internal APIs the product uses for the Web Interface, and this is unsupported, so please be aware, no tickets to Veeam whatsoever until an official Swagger get’s released.
Said this, pretty much every Dashboard have never been officially supported, but always maintained on GitHub using the issues feature over there 🙂 Let’s jump to this 41st part of the blog series about Grafana.
What I bring today is the usual, bash shell, simple to execute, that grabs data and writes to InfluxDB to finish with an excellent Dashboard.
Grafana Dashboard for a Quick Overview on Veeam Backup for Salesforce
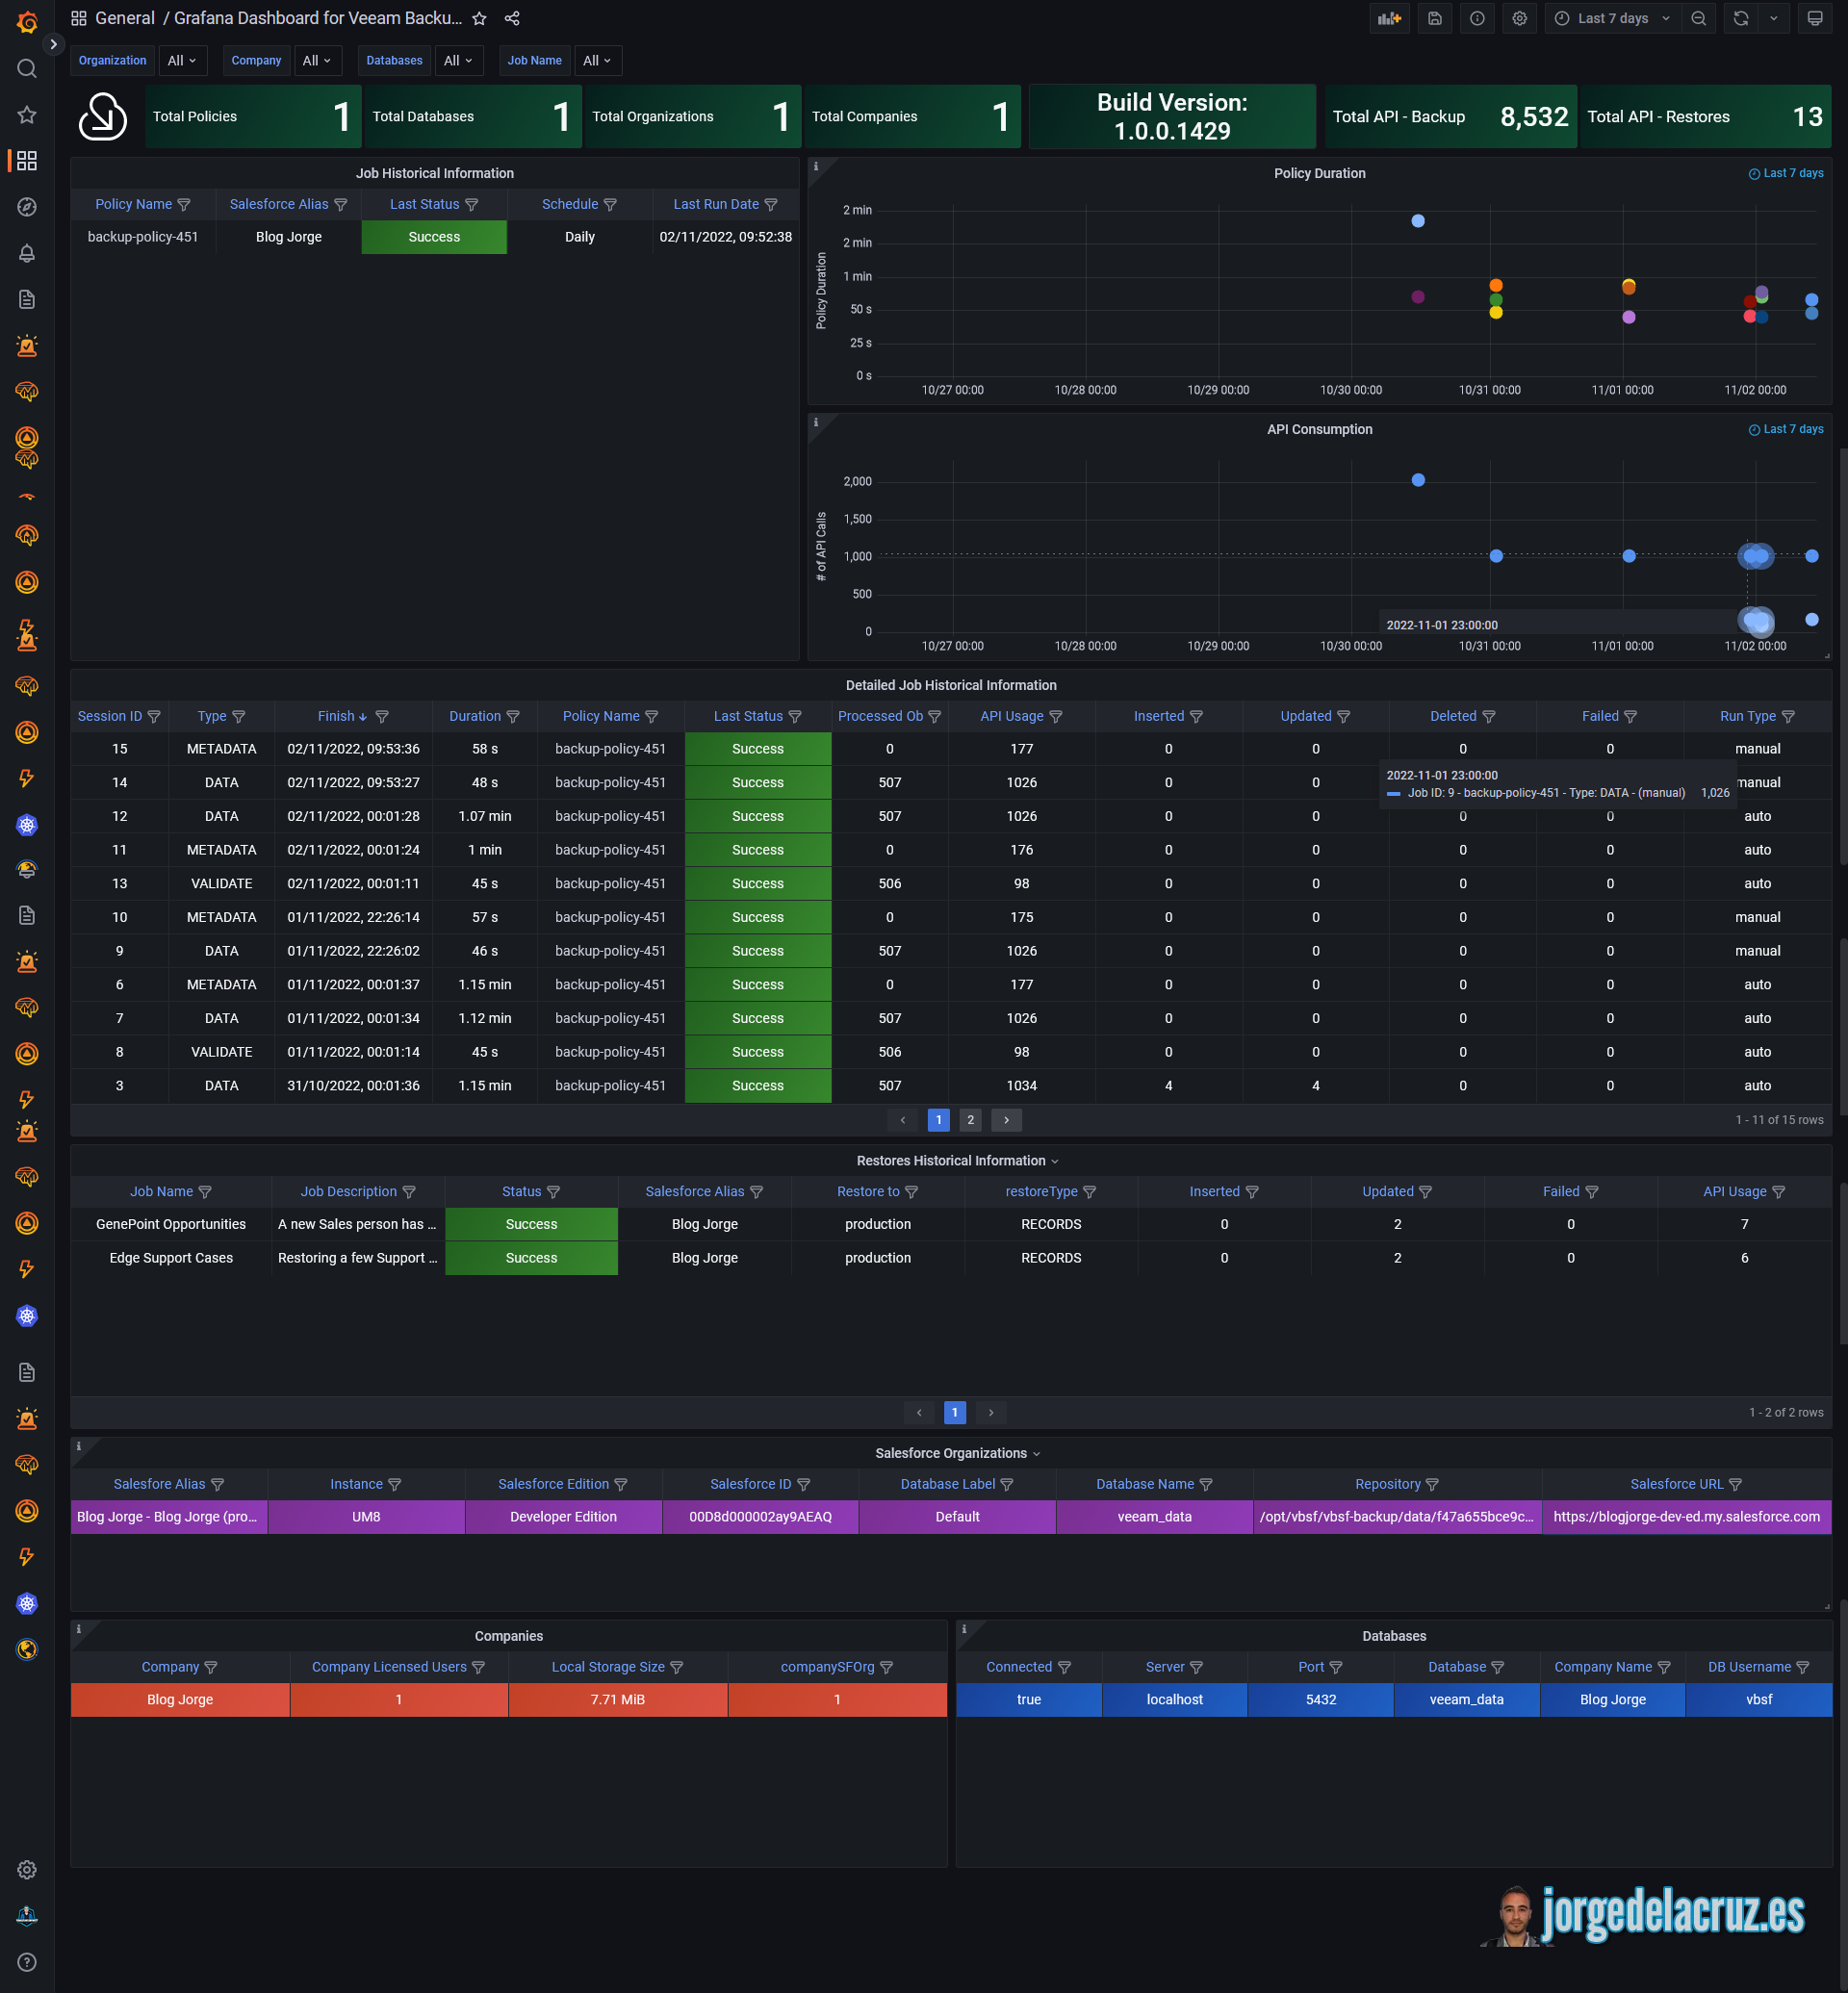
When you finish the entry you will have something similar to this Dashboard, it will vary in the case you have some more Databases, Organizations, Jobs, etc.:
Dashboard – Summary
- Veeam Backup for Salesforce Overview – On the top bar we can find a quick overview to VBSF, like how many Policies, Organizations, Companies and Databases has the appliance configured. The build version of the appliance, and a very important widget in my opinion. How many API calls we have been running during the selected time-frame, for both, restores, and backups.
- Job Historial Information (widget on the left) – A quick, and simple, table that shows a summary on the Job Policies, status, last-run, and last-status.
- Policy Duration (widget on top-right) – A time-series widget with the last seven days policy details, how much time has every policy job taken.
- API Consumption – (widget on top-right behind the Policy Duration) – Another time-series about last seven days API consumption per policy, per day. One of those graphics that will be extremely useful to understand so we do not surpass any Salesforce limits, etc.
- Detailed Job Historical Information – A detailed table with what happened on every sub-task from the Policies, remember that a Salesforce protection policy includes Data, Metadata, etc. With all level of details about how many API we consumed, how many rows introduced into the Database, etc.
- Restores Historical Information – A detailed table that highlights all the performed restores, with details about the name of the restore, description, and details on the metrics.
- Salesforce Organization – Quick summary of the different organizations you are protectiong with Veeam Backup for Salesforce. Details like Salesforce Edition, Alias, Database Name, etc.
- Companies – Quick view to the different Companies you are protecting with Veeam Backup for Salesforce.
- Databases – Another quick view to the databases, nothing too detailed.
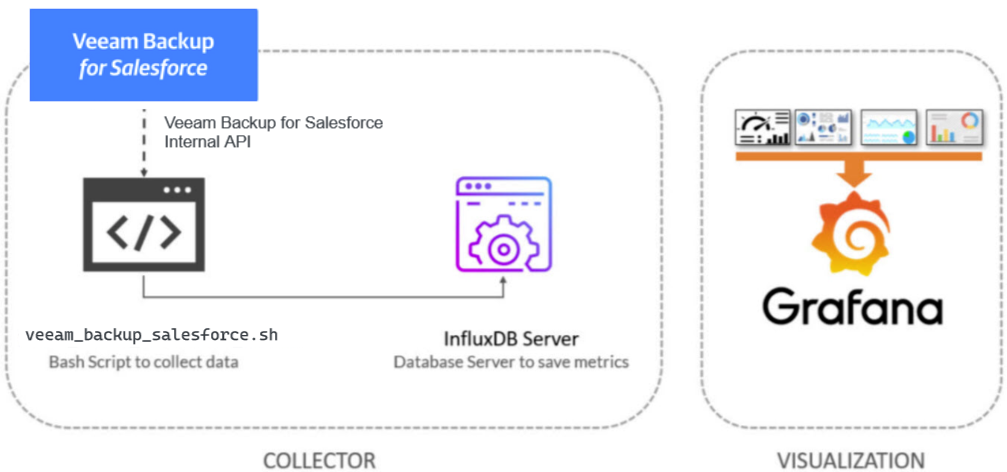
Topology with all logical components
This entry is very similar to the previous ones, we will use a shell script to collect the User Logins to our Veeam Restore Portal metrics using Azure Graph. The design would be something similar to this:
Download and configure the veeam_backup_salesforce.sh script
We have almost everything ready, we have one last step, the script that will make all this work, we will download the latest version from the Github repository:
You will need jq, so please go ahead and install it first (apt-get install jq, or yum install jq)
This shell script can be downloaded and run from the telegraf server, InfluxDB, or any other Linux. We will have to edit the configuration parameters:
# Configurations
##
# Endpoint URL for InfluxDB
veeamInfluxDBURL="https://YOURINFLUXDBSERVER" ##Use http://fqdn or https://IP in case you use SSL
veeamInfluxDBPort="8086" #Default Port
veeamInfluxDBBucket="YOURBUCKET" # InfluxDB bucket name (not ID)
veeamInfluxDBToken="YOURTOKEN" # InfluxDB access token with read/write privileges for the bucket
veeamInfluxDBOrg="YOURORG" # InfluxDB organisation name (not ID)

# Endpoint URL for login action
veeamUsername="YOURVEEAMBACKUPUSER"
veeamPassword="YOURVEEAMBACKUPPASS"
veeamBackupSalesforceServer="https://YOURVEEAMBACKUPIP"
veeamBackupSalesforcePort="443" #Default Port
Once the changes are done, make the script executable with chmod:
chmod +x grafana_influxdb_veeam_backup_salesforce.sh
The output of the command should be something like the next, without errors:
Writing veeam_salesforce_jobslogs to InfluxDB
HTTP/2 204
date: Wed, 02 Nov 2022 10:38:58 GMT
trace-id: 4c0280f82196faa0
trace-sampled: false
strict-transport-security: max-age=15724800; includeSubDomains
x-influxdb-request-id: 4d65d754099599ded69f5f0ce99e7d08
x-influxdb-build: Cloud
If so, please now add this script to your crontab, like for example every 30 minutes:
*/30 * * * * /home/oper/grafana_influxdb_veeam_backup_salesforce.sh >> /var/log/grafana_influxdb_veeam_backup_salesforce.log 2>&1
Grafana Dashboards
I created a Dashboard from scratch by selecting the best requests to the database, finishing off colors, thinking about graphics, and how to display them, and everything is automated so that it fits our environment without any problem and without having to edit anything manually. The Dashboard can be found here, once imported, you can use the top drop-down menus to select between organizations, Companies, Jobs, etc.:
Import Grafana Dashboards easily
So that you don’t have to waste hours configuring a new Dashboard, and ingesting and debugging what you want, I have already a wonderful Dashboard with everything you need to monitor our environment in a very simple way, you will be like the image I showed you above. Select the name you want and enter the ID: 17331, which is the unique ID of the Dashboard, or the URL:
 With the menus above you can display and adjust the Dashboard to your different choices:
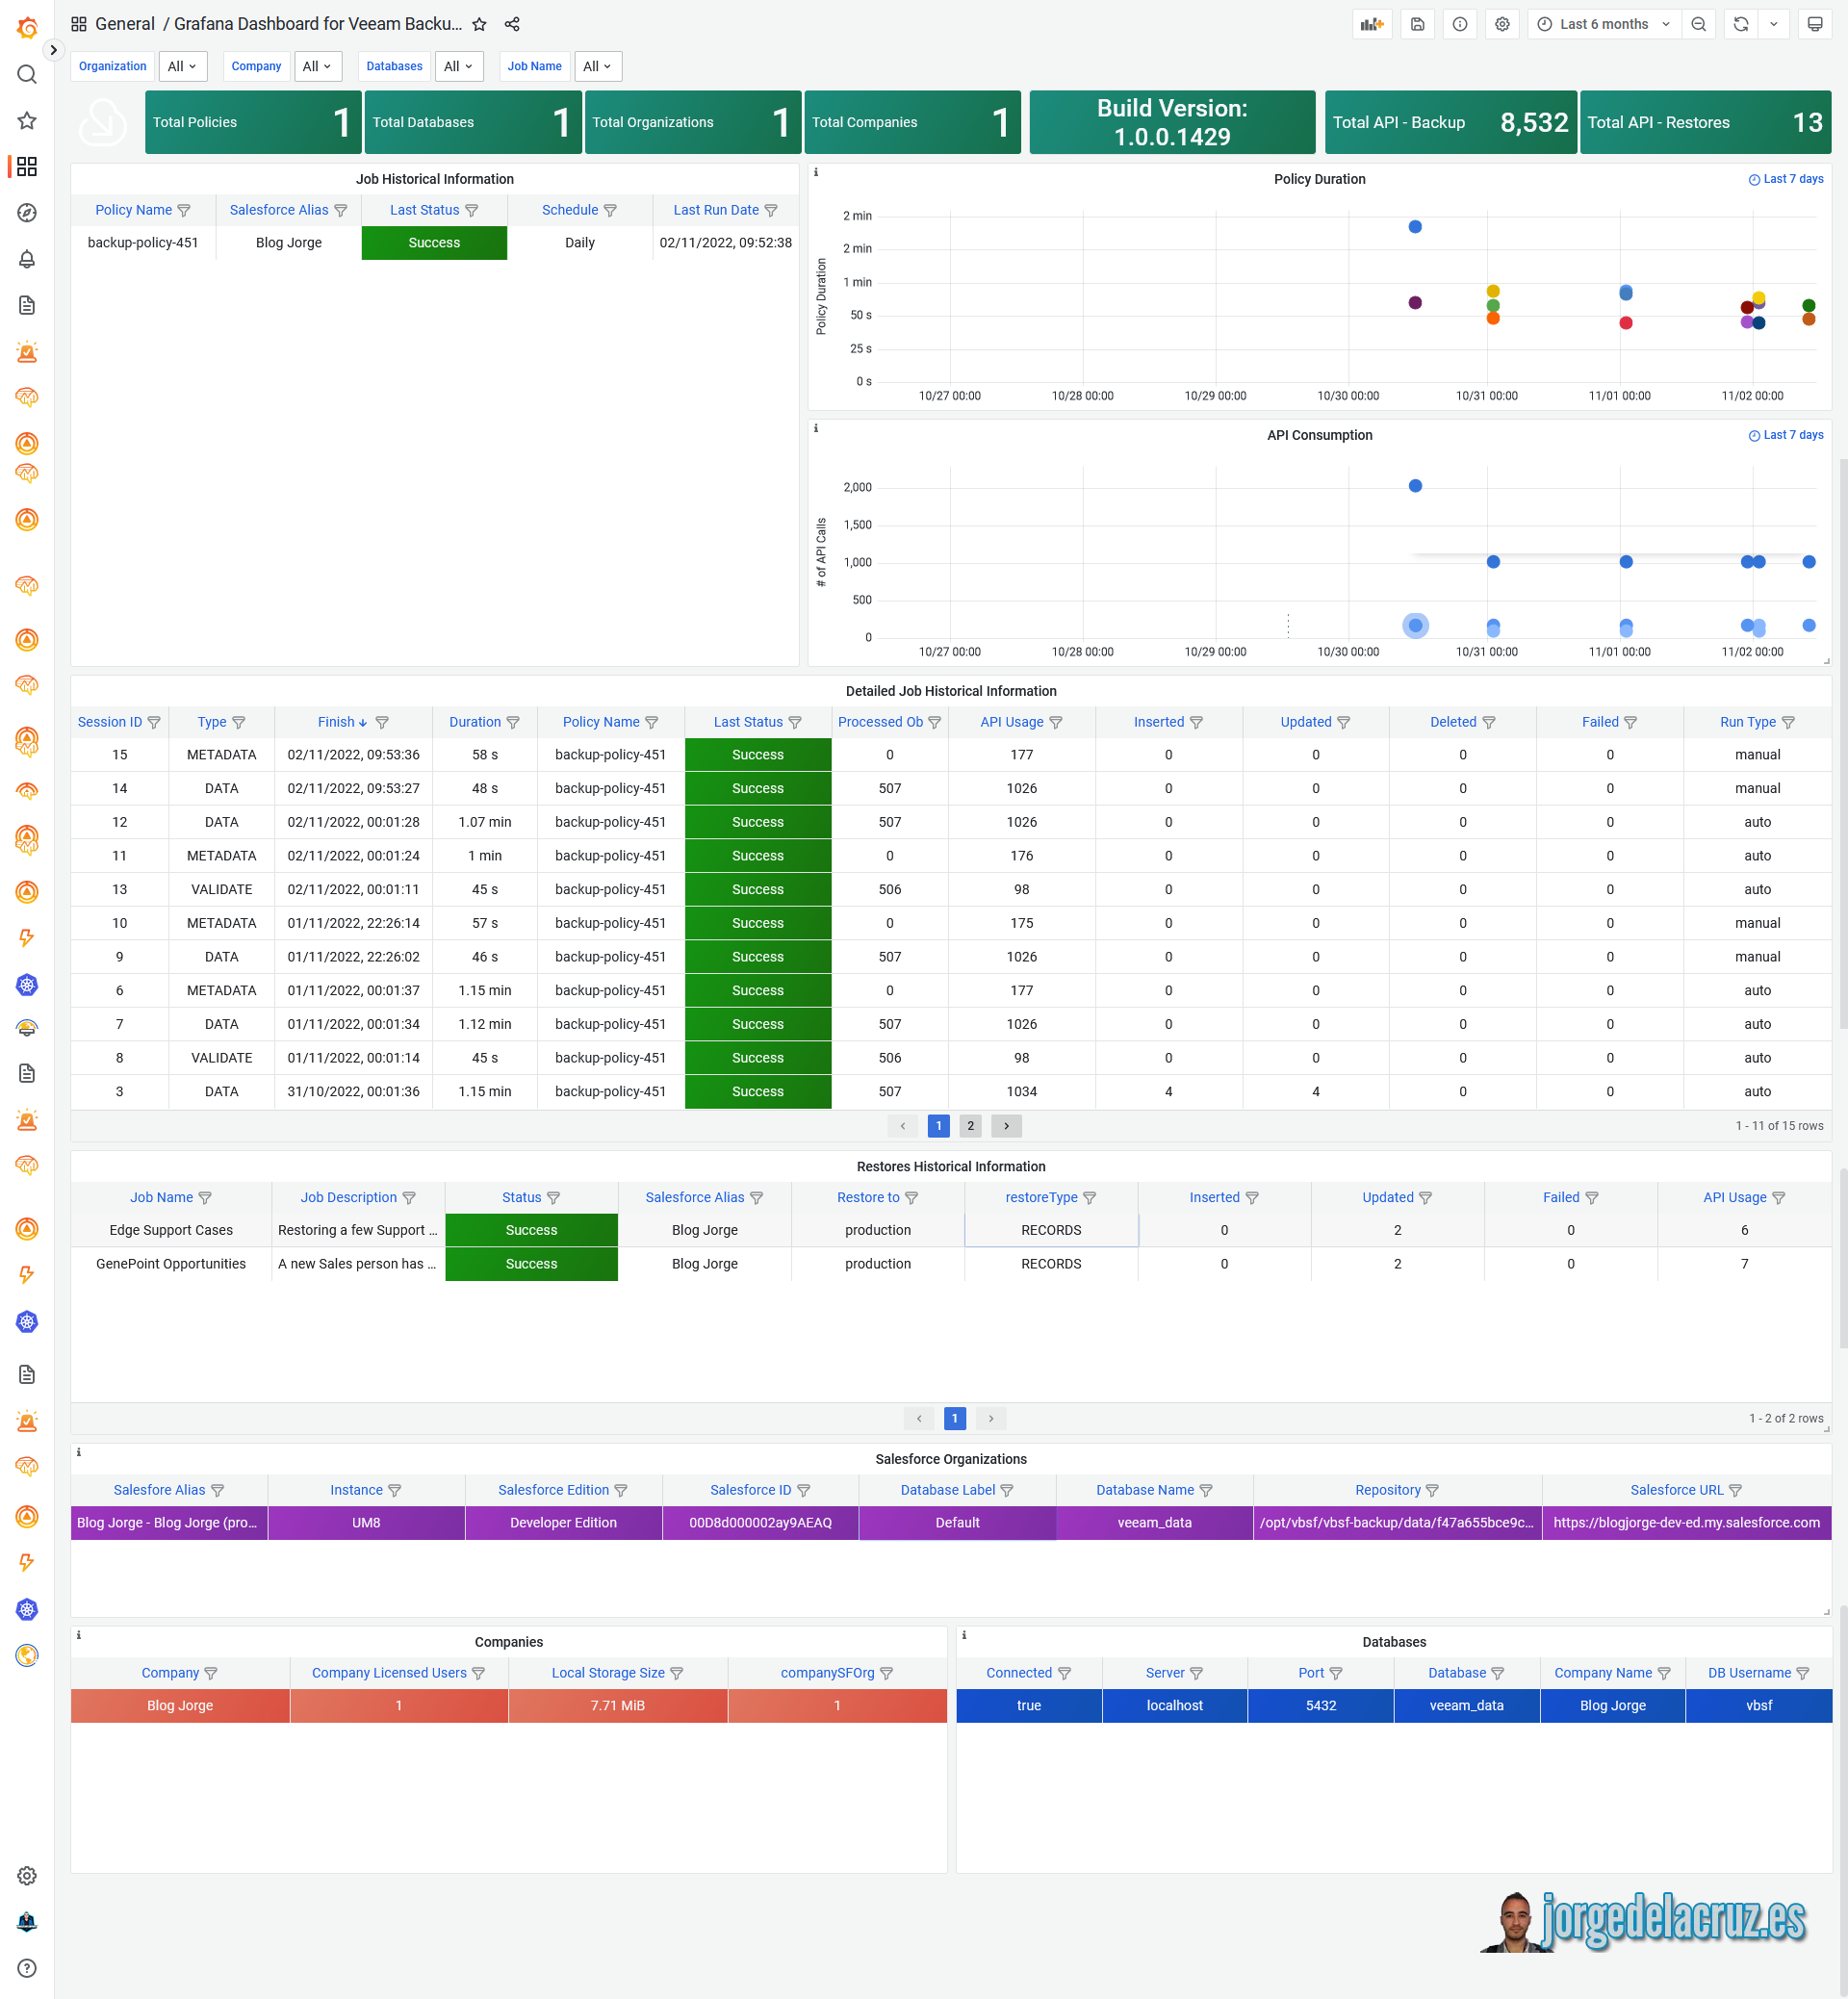
Also in light mode if you switch it on Grafana:
 Please leave your feedback in the comments, or on GitHub.
That’s all folks, if you want to follow the full Blog series about Grafana, InfluxDB, Telegraf, please click on the next links:
I hope you like it, and I would like to leave you the complete series here, so you can start playing with the plugins that I have been telling you about all these years:
- Looking for the Perfect Dashboard: InfluxDB, Telegraf, and Grafana – Part I (Installing InfluxDB, Telegraf, and Grafana on Ubuntu 20.04 LTS)
- En busca del Dashboard perfecto: InfluxDB, Telegraf y Grafana – Parte II (Instalar agente Telegraf en Nodos remotos Linux)
- En busca del Dashboard perfecto: InfluxDB, Telegraf y Grafana – Parte III Integración con PRTG
- En busca del Dashboard perfecto: InfluxDB, Telegraf y Grafana – Parte IV (Instalar agente Telegraf en Nodos remotos Windows)
- En busca del Dashboard perfecto: InfluxDB, Telegraf y Grafana – Parte V (Activar inputs específicos, Red, MySQL/MariaDB, Nginx)
- En busca del Dashboard perfecto: InfluxDB, Telegraf y Grafana – Parte VI (Monitorizando Veeam)
- En busca del Dashboard perfecto: InfluxDB, Telegraf y Grafana – Parte VII (Monitorizar vSphere)
- En busca del Dashboard perfecto: InfluxDB, Telegraf y Grafana – Parte VIII (Monitorizando Veeam con Enterprise Manager)
- En busca del Dashboard perfecto: InfluxDB, Telegraf y Grafana – Parte IX (Monitorizando Zimbra Collaboration)
- En busca del Dashboard perfecto: InfluxDB, Telegraf y Grafana – Parte X (Grafana Plugins)
- En busca del Dashboard perfecto: InfluxDB, Telegraf y Grafana – Parte XI – (Monitorizando URL e IPS con Telegraf y Ping)
- Looking for the Perfect Dashboard: InfluxDB, Telegraf, and Grafana – Part XII (Native Telegraf Plugin for vSphere)
- Looking for the Perfect Dashboard: InfluxDB, Telegraf, and Grafana – Part XIII (Veeam Backup for Microsoft Office 365 v4)
- Looking for the Perfect Dashboard: InfluxDB, Telegraf, and Grafana – Part XIV – Veeam Availability Console
- Looking for the Perfect Dashboard: InfluxDB, Telegraf, and Grafana – Part XV (IPMI Monitoring of our ESXi Hosts)
- Looking for Perfect Dashboard: InfluxDB, Telegraf, and Grafana – Part XVI (Performance and Advanced Security of Veeam Backup for Microsoft Office 365)
- Looking for the Perfect Dashboard: InfluxDB, Telegraf, and Grafana – Part XVII (Showing Dashboards on Two Monitors Using Raspberry Pi 4)
- En busca del Dashboard perfecto: InfluxDB, Telegraf y Grafana – Parte XVIII – Monitorizar temperatura y estado de Raspberry Pi 4
- Looking for the Perfect Dashboard: InfluxDB, Telegraf, and Grafana – Part XIX (Monitoring Veeam with Enterprise Manager) Shell Script
- Looking for the Perfect Dashboard: InfluxDB, Telegraf, and Grafana – Part XXIV (Monitoring Veeam Backup for Microsoft Azure)
- Looking for the Perfect Dashboard: InfluxDB, Telegraf, and Grafana – Part XXV (Monitoring Power Consumption)
- Looking for the Perfect Dashboard: InfluxDB, Telegraf, and Grafana – Part XXVI (Monitoring Veeam Backup for Nutanix)
- Looking for the Perfect Dashboard: InfluxDB, Telegraf, and Grafana – Part XXVII (Monitoring ReFS and XFS (block-cloning and reflink)
- Looking for the Perfect Dashboard: InfluxDB, Telegraf, and Grafana – Part XXVIII (Monitoring HPE StoreOnce)
- Looking for the Perfect Dashboard: InfluxDB, Telegraf, and Grafana – Part XXIX (Monitoring Pi-hole)
- Looking for the Perfect Dashboard: InfluxDB, Telegraf, and Grafana – Part XXIX (Monitoring Veeam Backup for AWS)
- Looking for the Perfect Dashboard: InfluxDB, Telegraf, and Grafana – Part XXXI (Monitoring Unifi Protect)
- Looking for the Perfect Dashboard: InfluxDB, Telegraf, and Grafana – Part XXXII (Monitoring Veeam ONE – experimental)
- Looking for the Perfect Dashboard: InfluxDB, Telegraf, and Grafana – Part XXXIII (Monitoring NetApp ONTAP)
- Looking for the Perfect Dashboard: InfluxDB, Telegraf, and Grafana – Part XXXIV (Monitoring Runecast)
- Looking for the Perfect Dashboard: InfluxDB, Telegraf, and Grafana – Part XXXV (GPU Monitoring)
- Looking for the Perfect Dashboard: InfluxDB, Telegraf, and Grafana – Part XXXVI (Monitoring Goldshell Miners – JSONv2)
- Looking for the Perfect Dashboard: InfluxDB, Telegraf, and Grafana – Part XXXVII (Monitoring Veeam Backup for Google Cloud Platform)
- En Busca del Dashboard perfecto: InfluxDB, Telegraf y Grafana – Parte XXXVIII (Monitorizando Temperatura y Humedad con Xiaomi Mijia)
- Looking for the Perfect Dashboard: InfluxDB, Telegraf, and Grafana – Part XL (Veeam Backup for Microsoft 365 – Restore Audit)
- Looking for the Perfect Dashboard: InfluxDB, Telegraf, and Grafana – Part XLI (Veeam Backup for Salesforce)
- Looking for the Perfect Dashboard: InfluxDB, Telegraf, and Grafana – Part XLII (Veeam ONE v12 Audit Events)
- Looking for the Perfect Dashboard: InfluxDB, Telegraf, and Grafana – Part XLIII (Monitoring QNAP using SNMP v3)
- Looking for the Perfect Dashboard: InfluxDB, Telegraf, and Grafana – Part XLIV (Monitoring Veeam Backup & Replication API)
- Looking for the Perfect Dashboard: InfluxDB, Telegraf, and Grafana – Part XLV (Monitoring Synology using SNMP v3)
- Looking for the Perfect Dashboard: InfluxDB, Telegraf, and Grafana – Part XLVI (Monitoring NVIDIA Jetson Nano)
- Looking for the Perfect Dashboard: InfluxDB, Telegraf, and Grafana – Part XLVII (Monitoring Open WebUI)
- Looking for the Perfect Dashboard: InfluxDB, Telegraf, and Grafana – Part XLVIII (Monitoring Veeam Data Platform Advanced)
- Looking for the Perfect Dashboard: InfluxDB, Telegraf, and Grafana – Part XLIX (Monitoring Unofficial Veeam ONE Node Exporter)
Leave a Reply