
 Greetings friends, Veeam ONE v12 has been launched, there are tons of improvements which we will cover on this blog shortly. But before I jump into native great features, I wanted to show you the art of the possible once again.
Veeam ONE v12 comes with a new Audit funcionality that stores in the Windows Events Logs absolutely everything that happens in the Veeam ONE environment, that is changes into the Infrastructure, passwords changes, Report views, succesful/unsuccesful logins , etc. And that, my dear readers, it is power, an infinite source of power that we should control, monitor, and have it at hand.
This blog entry covers how you can monitor Veeam ONE Windows Events Log using telegraf, but of course you can monitor any other Windows Events Log of your choice and build something similar.
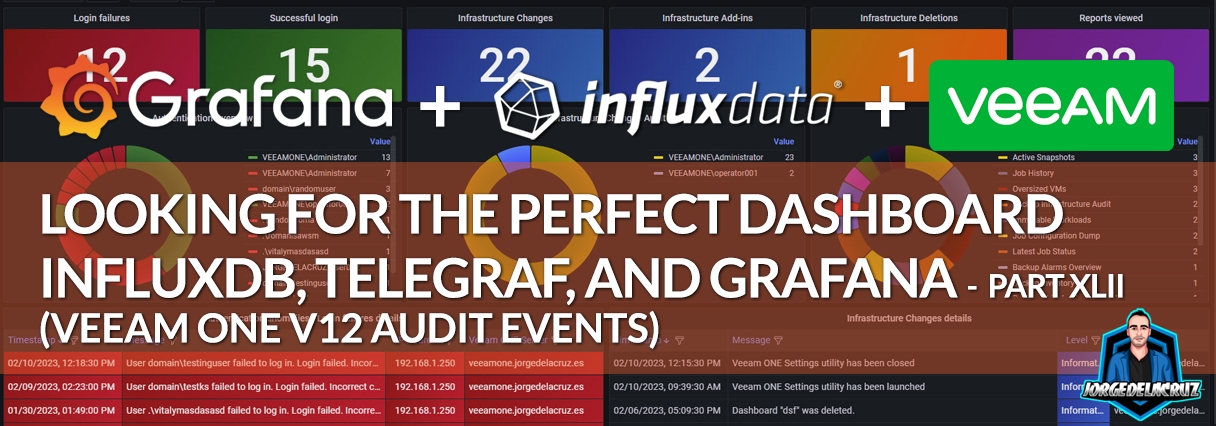
Grafana Dashboard for a Quick Overview on Veeam ONE Audit Events
When you finish the entry you will have something similar to this Dashboard, it will vary in the case you have some more Veeam ONE Servers, Users, etc.:
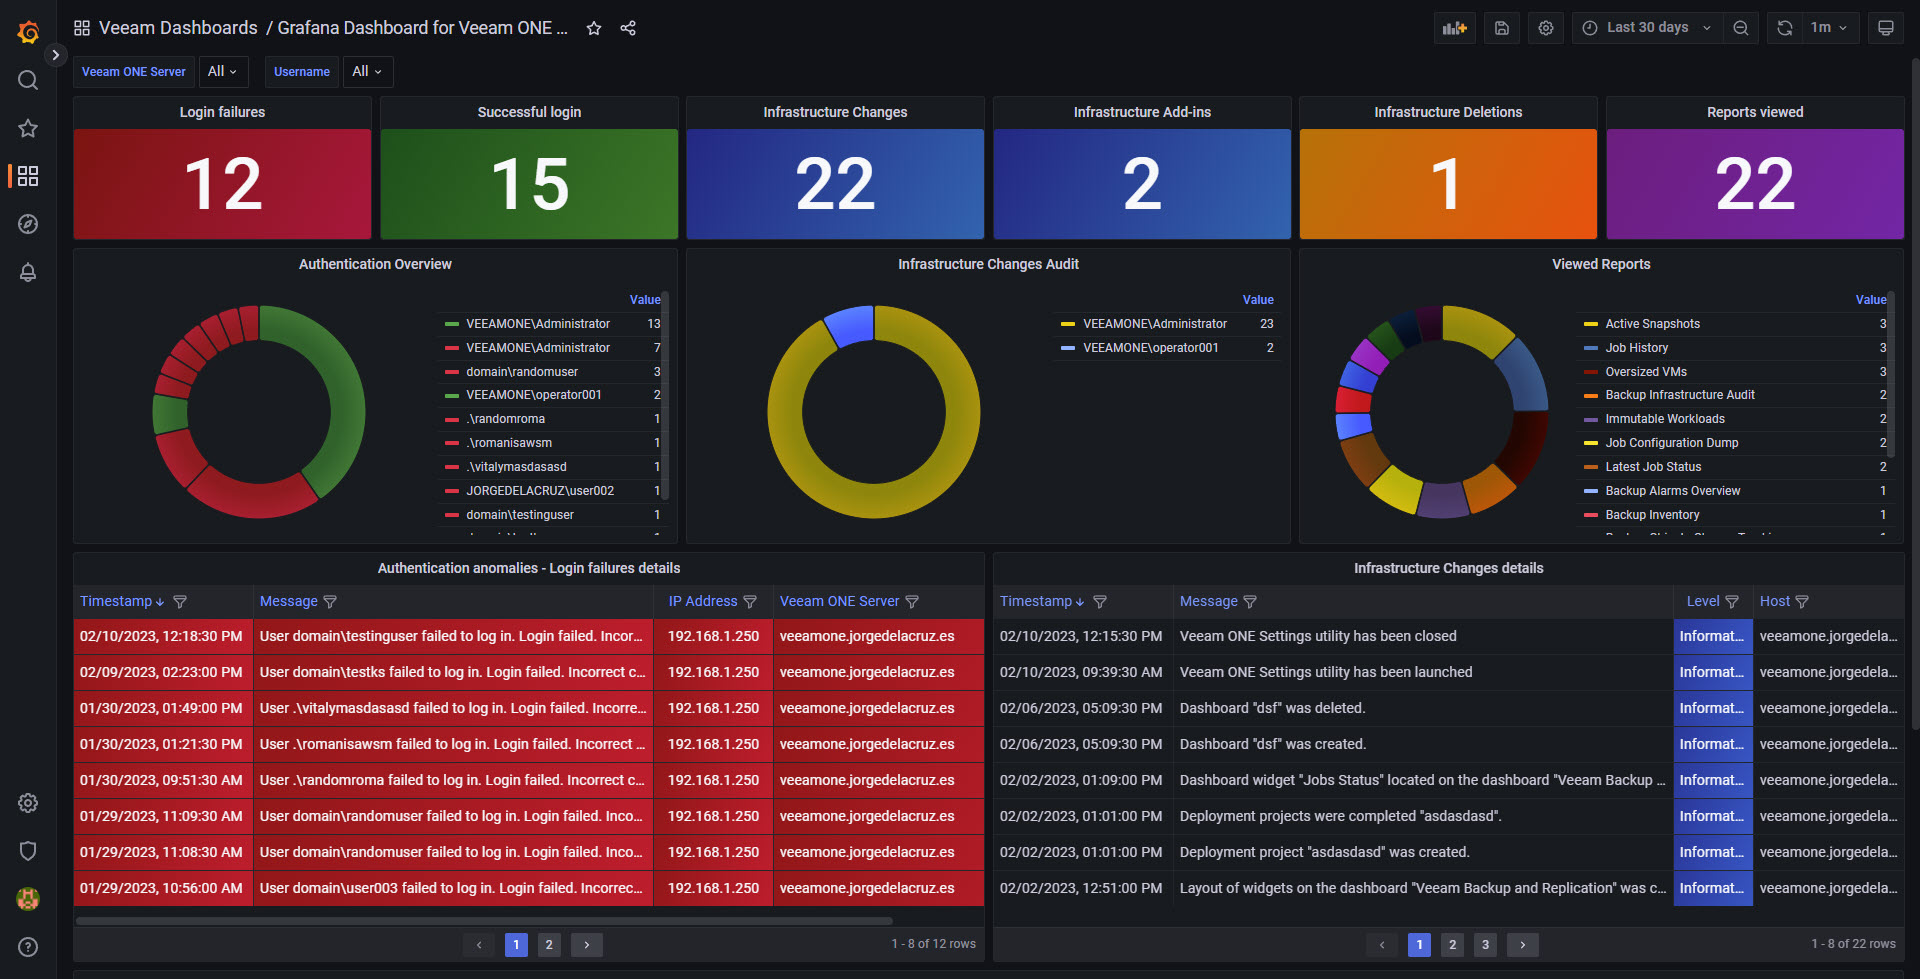
Dashboard – Summary
- Veeam ONE Audit Events Overview – On the top bar we can find a quick overview to Veeam ONE Events, like how many Login Failures, Succesful Logins, Infrastructure Changes, Infrastructure Addins, Infrastructure Deletions, and Reports Viewed.
- Authentication Overview (widget on the left) – A quick, and simple, donut that shows how many every user has tried to login, with either success, or error.
- Infrastructure Changes Audit (widget on the center) – Another donut, this time to show how many changes have happened in the Infrastructure, grouped by user.
- Viewed Reports – (widget on the right) – Last donut, who does not want to see what Report is the most popular and have been Previewed the most? Now you can easily see it.
- Authentication anomalies – Details – A detailed table with the specific login attempt, in this case just showing the error ones. It will show timestamp, username, IP address, and Veeam ONE server.
- Infrastructure Changes – Details – A detailed table that highlights all the Changes that had happened to the Infrastructure, perfect to see when the credentials for monitoring vSphere were changed, or when that VBR server was added, etc.
- Raw log – If you want to dig deep into the raw logs themselves, but do not want to jump into the VeeamONE Server, here you can quickly see as many details as you need per Event.
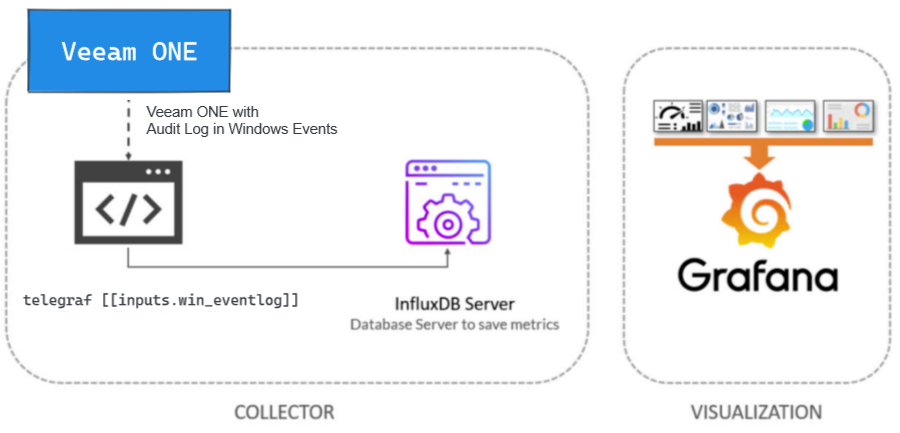
Topology with all logical components
This entry is very similar to the previous ones, we will use telegraf installed on the Veeam ONE Server, so the windows version, and collect the different Windows Event logs, from there we will send them to InfluxDB, and visualize them with Grafana . The design would be something similar to this:
How-to download and configure telegraf for Microsoft Windows, and Grafana Dashboard Overview, in video
If you prefer a quick overview on a YouTube format, I have recorded the next piece just for you:
How-to download and configure telegraf for Microsoft Windows
As we can see, telegraf has already a Windows Event Log plugin ready to be used. Before we made use of it, we need to download telegraf as an agent in our Veeam ONE Server, and configure it properly.
Really easy, from a PowerShell with admin rights, we ran the next commands:
wget https://dl.influxdata.com/telegraf/releases/telegraf-1.25.1_windows_amd64.zip -UseBasicParsing -OutFile telegraf-1.25.1_windows_amd64.zip
Expand-Archive .\telegraf-1.25.1_windows_amd64.zip -DestinationPath 'C:\Program Files\InfluxData\telegraf\'
cd "C:\Program Files\InfluxData\telegraf"
mv .\telegraf-1.25.1\telegraf.* .
That has installed the latest version of telegraf, moved to the correct path, and so on. Let’s add it now as Windows Service:
.\telegraf.exe --service install --config "C:\Program Files\InfluxData\telegraf\telegraf.conf"
Let’s move to the configuration part, there is not much to do, just to make sure your agent uses the hostname, the output is right as well. For example, here is my agent and outputs section:
[agent]
  interval = "10s"
  round_interval = true

  metric_batch_size = 1000
  metric_buffer_limit = 10000
  collection_jitter = "0s"

  flush_interval = "10s"
  flush_jitter = "0s"

  precision = "0s"
  logtarget = "file"
  logfile = "C:/Program Files/InfluxData/telegraf/telegraf.log"

  hostname = "veeamone.jorgedelacruz.es"

  omit_hostname = false

[outputs.influxdb_v2]
   urls = ["https://YOURINFLUXDB:8086"]
   token = "YOUROWNTOKEN"
   organization = "NAMEOFYOURORG"
   bucket = "YOURBUCKET"
And finally, at the end of the file, let’s add the really powerful Windows Events Log parser:
[[inputs.win_eventlog]]
  xpath_query = '''
<QueryList>
  <Query Id="0" Path="Veeam ONE">
    <Select Path="Veeam ONE">*</Select>
  </Query>
</QueryList>
'''

  process_userdata = true
  process_eventdata = true
  separator = "_"
  only_first_line_of_message = true
  timestamp_from_event = true
  event_tags = ["Source", "EventID", "Level", "LevelText", "Task", "TaskText", "Opcode", "OpcodeText", "Keywords", "Channel", "Computer"]
  event_fields = ["*"]
  exclude_fields = ["TimeCreated", "Binary", "Data_Address*"]
  exclude_empty = ["*ActivityID", "UserID"]
We are good to go, as simple as from the PowerShell:
telegraf.exe --service start
Grafana Dashboards
I created a Dashboard from scratch by selecting the best requests to the database, finishing off colors, thinking about graphics, and how to display them, and everything is automated so that it fits our environment without any problem and without having to edit anything manually. The Dashboard can be found here, once imported, you can use the top drop-down menus to select between VeeamONE Servers, and Users:
Import Grafana Dashboards easily
I have already a wonderful Dashboard, ready just for you with everything you need to monitor our environment in a very simple way. Select the name you want and enter the ID: 18054, which is the unique ID of the Dashboard, or the URL:
 With the menus above you can display and adjust the Dashboard to your different choices:
Also in light mode if you switch it on Grafana:

Please leave your feedback in the comments, or on GitHub.
That’s all folks, if you want to follow the full Blog series about Grafana, InfluxDB, Telegraf, please click on the next links:
I hope you like it, and I would like to leave you the complete series here, so you can start playing with the plugins that I have been telling you about all these years:
- Looking for the Perfect Dashboard: InfluxDB, Telegraf, and Grafana – Part I (Installing InfluxDB, Telegraf, and Grafana on Ubuntu 20.04 LTS)
- En busca del Dashboard perfecto: InfluxDB, Telegraf y Grafana – Parte II (Instalar agente Telegraf en Nodos remotos Linux)
- En busca del Dashboard perfecto: InfluxDB, Telegraf y Grafana – Parte III Integración con PRTG
- En busca del Dashboard perfecto: InfluxDB, Telegraf y Grafana – Parte IV (Instalar agente Telegraf en Nodos remotos Windows)
- En busca del Dashboard perfecto: InfluxDB, Telegraf y Grafana – Parte V (Activar inputs específicos, Red, MySQL/MariaDB, Nginx)
- En busca del Dashboard perfecto: InfluxDB, Telegraf y Grafana – Parte VI (Monitorizando Veeam)
- En busca del Dashboard perfecto: InfluxDB, Telegraf y Grafana – Parte VII (Monitorizar vSphere)
- En busca del Dashboard perfecto: InfluxDB, Telegraf y Grafana – Parte VIII (Monitorizando Veeam con Enterprise Manager)
- En busca del Dashboard perfecto: InfluxDB, Telegraf y Grafana – Parte IX (Monitorizando Zimbra Collaboration)
- En busca del Dashboard perfecto: InfluxDB, Telegraf y Grafana – Parte X (Grafana Plugins)
- En busca del Dashboard perfecto: InfluxDB, Telegraf y Grafana – Parte XI – (Monitorizando URL e IPS con Telegraf y Ping)
- Looking for the Perfect Dashboard: InfluxDB, Telegraf, and Grafana – Part XII (Native Telegraf Plugin for vSphere)
- Looking for the Perfect Dashboard: InfluxDB, Telegraf, and Grafana – Part XIII (Veeam Backup for Microsoft Office 365 v4)
- Looking for the Perfect Dashboard: InfluxDB, Telegraf, and Grafana – Part XIV – Veeam Availability Console
- Looking for the Perfect Dashboard: InfluxDB, Telegraf, and Grafana – Part XV (IPMI Monitoring of our ESXi Hosts)
- Looking for Perfect Dashboard: InfluxDB, Telegraf, and Grafana – Part XVI (Performance and Advanced Security of Veeam Backup for Microsoft Office 365)
- Looking for the Perfect Dashboard: InfluxDB, Telegraf, and Grafana – Part XVII (Showing Dashboards on Two Monitors Using Raspberry Pi 4)
- En busca del Dashboard perfecto: InfluxDB, Telegraf y Grafana – Parte XVIII – Monitorizar temperatura y estado de Raspberry Pi 4
- Looking for the Perfect Dashboard: InfluxDB, Telegraf, and Grafana – Part XIX (Monitoring Veeam with Enterprise Manager) Shell Script
- Looking for the Perfect Dashboard: InfluxDB, Telegraf, and Grafana – Part XXIV (Monitoring Veeam Backup for Microsoft Azure)
- Looking for the Perfect Dashboard: InfluxDB, Telegraf, and Grafana – Part XXV (Monitoring Power Consumption)
- Looking for the Perfect Dashboard: InfluxDB, Telegraf, and Grafana – Part XXVI (Monitoring Veeam Backup for Nutanix)
- Looking for the Perfect Dashboard: InfluxDB, Telegraf, and Grafana – Part XXVII (Monitoring ReFS and XFS (block-cloning and reflink)
- Looking for the Perfect Dashboard: InfluxDB, Telegraf, and Grafana – Part XXVIII (Monitoring HPE StoreOnce)
- Looking for the Perfect Dashboard: InfluxDB, Telegraf, and Grafana – Part XXIX (Monitoring Pi-hole)
- Looking for the Perfect Dashboard: InfluxDB, Telegraf, and Grafana – Part XXIX (Monitoring Veeam Backup for AWS)
- Looking for the Perfect Dashboard: InfluxDB, Telegraf, and Grafana – Part XXXI (Monitoring Unifi Protect)
- Looking for the Perfect Dashboard: InfluxDB, Telegraf, and Grafana – Part XXXII (Monitoring Veeam ONE – experimental)
- Looking for the Perfect Dashboard: InfluxDB, Telegraf, and Grafana – Part XXXIII (Monitoring NetApp ONTAP)
- Looking for the Perfect Dashboard: InfluxDB, Telegraf, and Grafana – Part XXXIV (Monitoring Runecast)
- Looking for the Perfect Dashboard: InfluxDB, Telegraf, and Grafana – Part XXXV (GPU Monitoring)
- Looking for the Perfect Dashboard: InfluxDB, Telegraf, and Grafana – Part XXXVI (Monitoring Goldshell Miners – JSONv2)
- Looking for the Perfect Dashboard: InfluxDB, Telegraf, and Grafana – Part XXXVII (Monitoring Veeam Backup for Google Cloud Platform)
- En Busca del Dashboard perfecto: InfluxDB, Telegraf y Grafana – Parte XXXVIII (Monitorizando Temperatura y Humedad con Xiaomi Mijia)
- Looking for the Perfect Dashboard: InfluxDB, Telegraf, and Grafana – Part XL (Veeam Backup for Microsoft 365 – Restore Audit)
- Looking for the Perfect Dashboard: InfluxDB, Telegraf, and Grafana – Part XLI (Veeam Backup for Salesforce)
- Looking for the Perfect Dashboard: InfluxDB, Telegraf, and Grafana – Part XLII (Veeam ONE v12 Audit Events)
- Looking for the Perfect Dashboard: InfluxDB, Telegraf, and Grafana – Part XLIII (Monitoring QNAP using SNMP v3)
- Looking for the Perfect Dashboard: InfluxDB, Telegraf, and Grafana – Part XLIV (Monitoring Veeam Backup & Replication API)
- Looking for the Perfect Dashboard: InfluxDB, Telegraf, and Grafana – Part XLV (Monitoring Synology using SNMP v3)
- Looking for the Perfect Dashboard: InfluxDB, Telegraf, and Grafana – Part XLVI (Monitoring NVIDIA Jetson Nano)
- Looking for the Perfect Dashboard: InfluxDB, Telegraf, and Grafana – Part XLVII (Monitoring Open WebUI)
- Looking for the Perfect Dashboard: InfluxDB, Telegraf, and Grafana – Part XLVIII (Monitoring Veeam Data Platform Advanced)
- Looking for the Perfect Dashboard: InfluxDB, Telegraf, and Grafana – Part XLIX (Monitoring Unofficial Veeam ONE Node Exporter)
Hello jorgedelacruz
I try config install telegraf on VeeamOne sucessc but on InfluxDB i see only measure relate win_perf_counters.
Are you any suggestion for me ?
2023-12-12T02:43:01Z I! Available plugins: 210 inputs, 9 aggregators, 26 processors, 21 parsers, 57 outputs, 2 secret-stores
2023-12-12T02:43:01Z I! Loaded inputs: win_eventlog win_perf_counters
2023-12-12T02:43:01Z I! Loaded aggregators:
2023-12-12T02:43:01Z I! Loaded processors:
2023-12-12T02:43:01Z I! Loaded secretstores:
2023-12-12T02:43:01Z I! Loaded outputs: influxdb_v2
2023-12-12T02:43:01Z I! Tags enabled: host=HA-Veeam-One-01.ssi.local
Hello haiph,
Do you have this on the config?
[[inputs.win_eventlog]]
xpath_query = ”’
”’
process_userdata = true
process_eventdata = true
separator = “_”
only_first_line_of_message = true
timestamp_from_event = true
event_tags = [“Source”, “EventID”, “Level”, “LevelText”, “Task”, “TaskText”, “Opcode”, “OpcodeText”, “Keywords”, “Channel”, “Computer”]
event_fields = [“*”]
exclude_fields = [“TimeCreated”, “Binary”, “Data_Address*”]
exclude_empty = [“*ActivityID”, “UserID”]
I can not see it enabled on the log you shared.