
 Greetings friends, a few years ago I showed you how to monitor the CPU temperature using telegraf for a Raspberry Pi. I have recently purchased an exciting NVIDIA Jetson Nano and I wanted to monitor it as well, this device is a bit unique. I have used the RPi dashboard as inspiration, but this is an arm board with some unique GPU capabilities, let’s take a quick look:
| Jetson Orin Nano 8GB Module | |
| AI Performance | 67 TOPS |
| GPU | NVIDIA Ampere architecture with 1024 NVIDIA® CUDA® cores and 32 Tensor cores |
| CPU | 6-core Arm Cortex-A78AE v8.2 64-bit CPU 1.5MB L2 + 4MB L3 |
| Memory | 8GB 128-bit LPDDR5 102 GB/s |
| Storage | external via microSD slot external NVMe via M.2 KeyM |
| Video Encode | 1080p30 supported by 1-2 CPU cores |
| Video Decode | 1x 4K60 (H.265) 2x 4K30 (H.265) 5x 1080p60 (H.265) 11x 1080p30 (H.265) |
| Power | 7W to 25W |
| PCI Express | 22 lanes PCIe Gen 4 Up to 2 x8, 1 x4, 2 x1 |
| Ethernet | 1 Gbe RGMII | 4x 10Gbe XFI |
| Mechanical | 100mm x 87mm 699 pin connector |
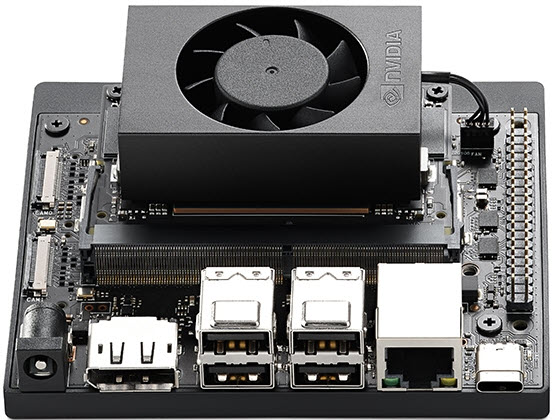
Then as peripherals, we can find the next:
| Reference Carrier Board | |
| Camera | 2x MIPI CSI-2 22-pin camera connectors PCIe |
| USB | USB Type-A connector: 4x USB 3.2 Gen2 USB Type-C connector for UFP |
| Networking | 1xGbE connector |
| Display | 1x DP 1.2 (+MST) connector |
| Other I/O | 40-pin expansion header (UART, SPI, I2S, I2C, GPIO) 12-pin button header 4-pin fan header microSD slot DC power jack |
| Mechanical | 103mm x 90.5mm x 34.77mm (Height includes feet, carrier board, module, and thermal solution) |
Now that we understand the unit a bit better. It is time to start monitoring the temperature.
Grafana Dashboard for NVIDIA Jetson Nano Super
When you finish the entry you will have something similar to this. It might look a bit different in case your CPU/RAM consumption, but should work out of the box:
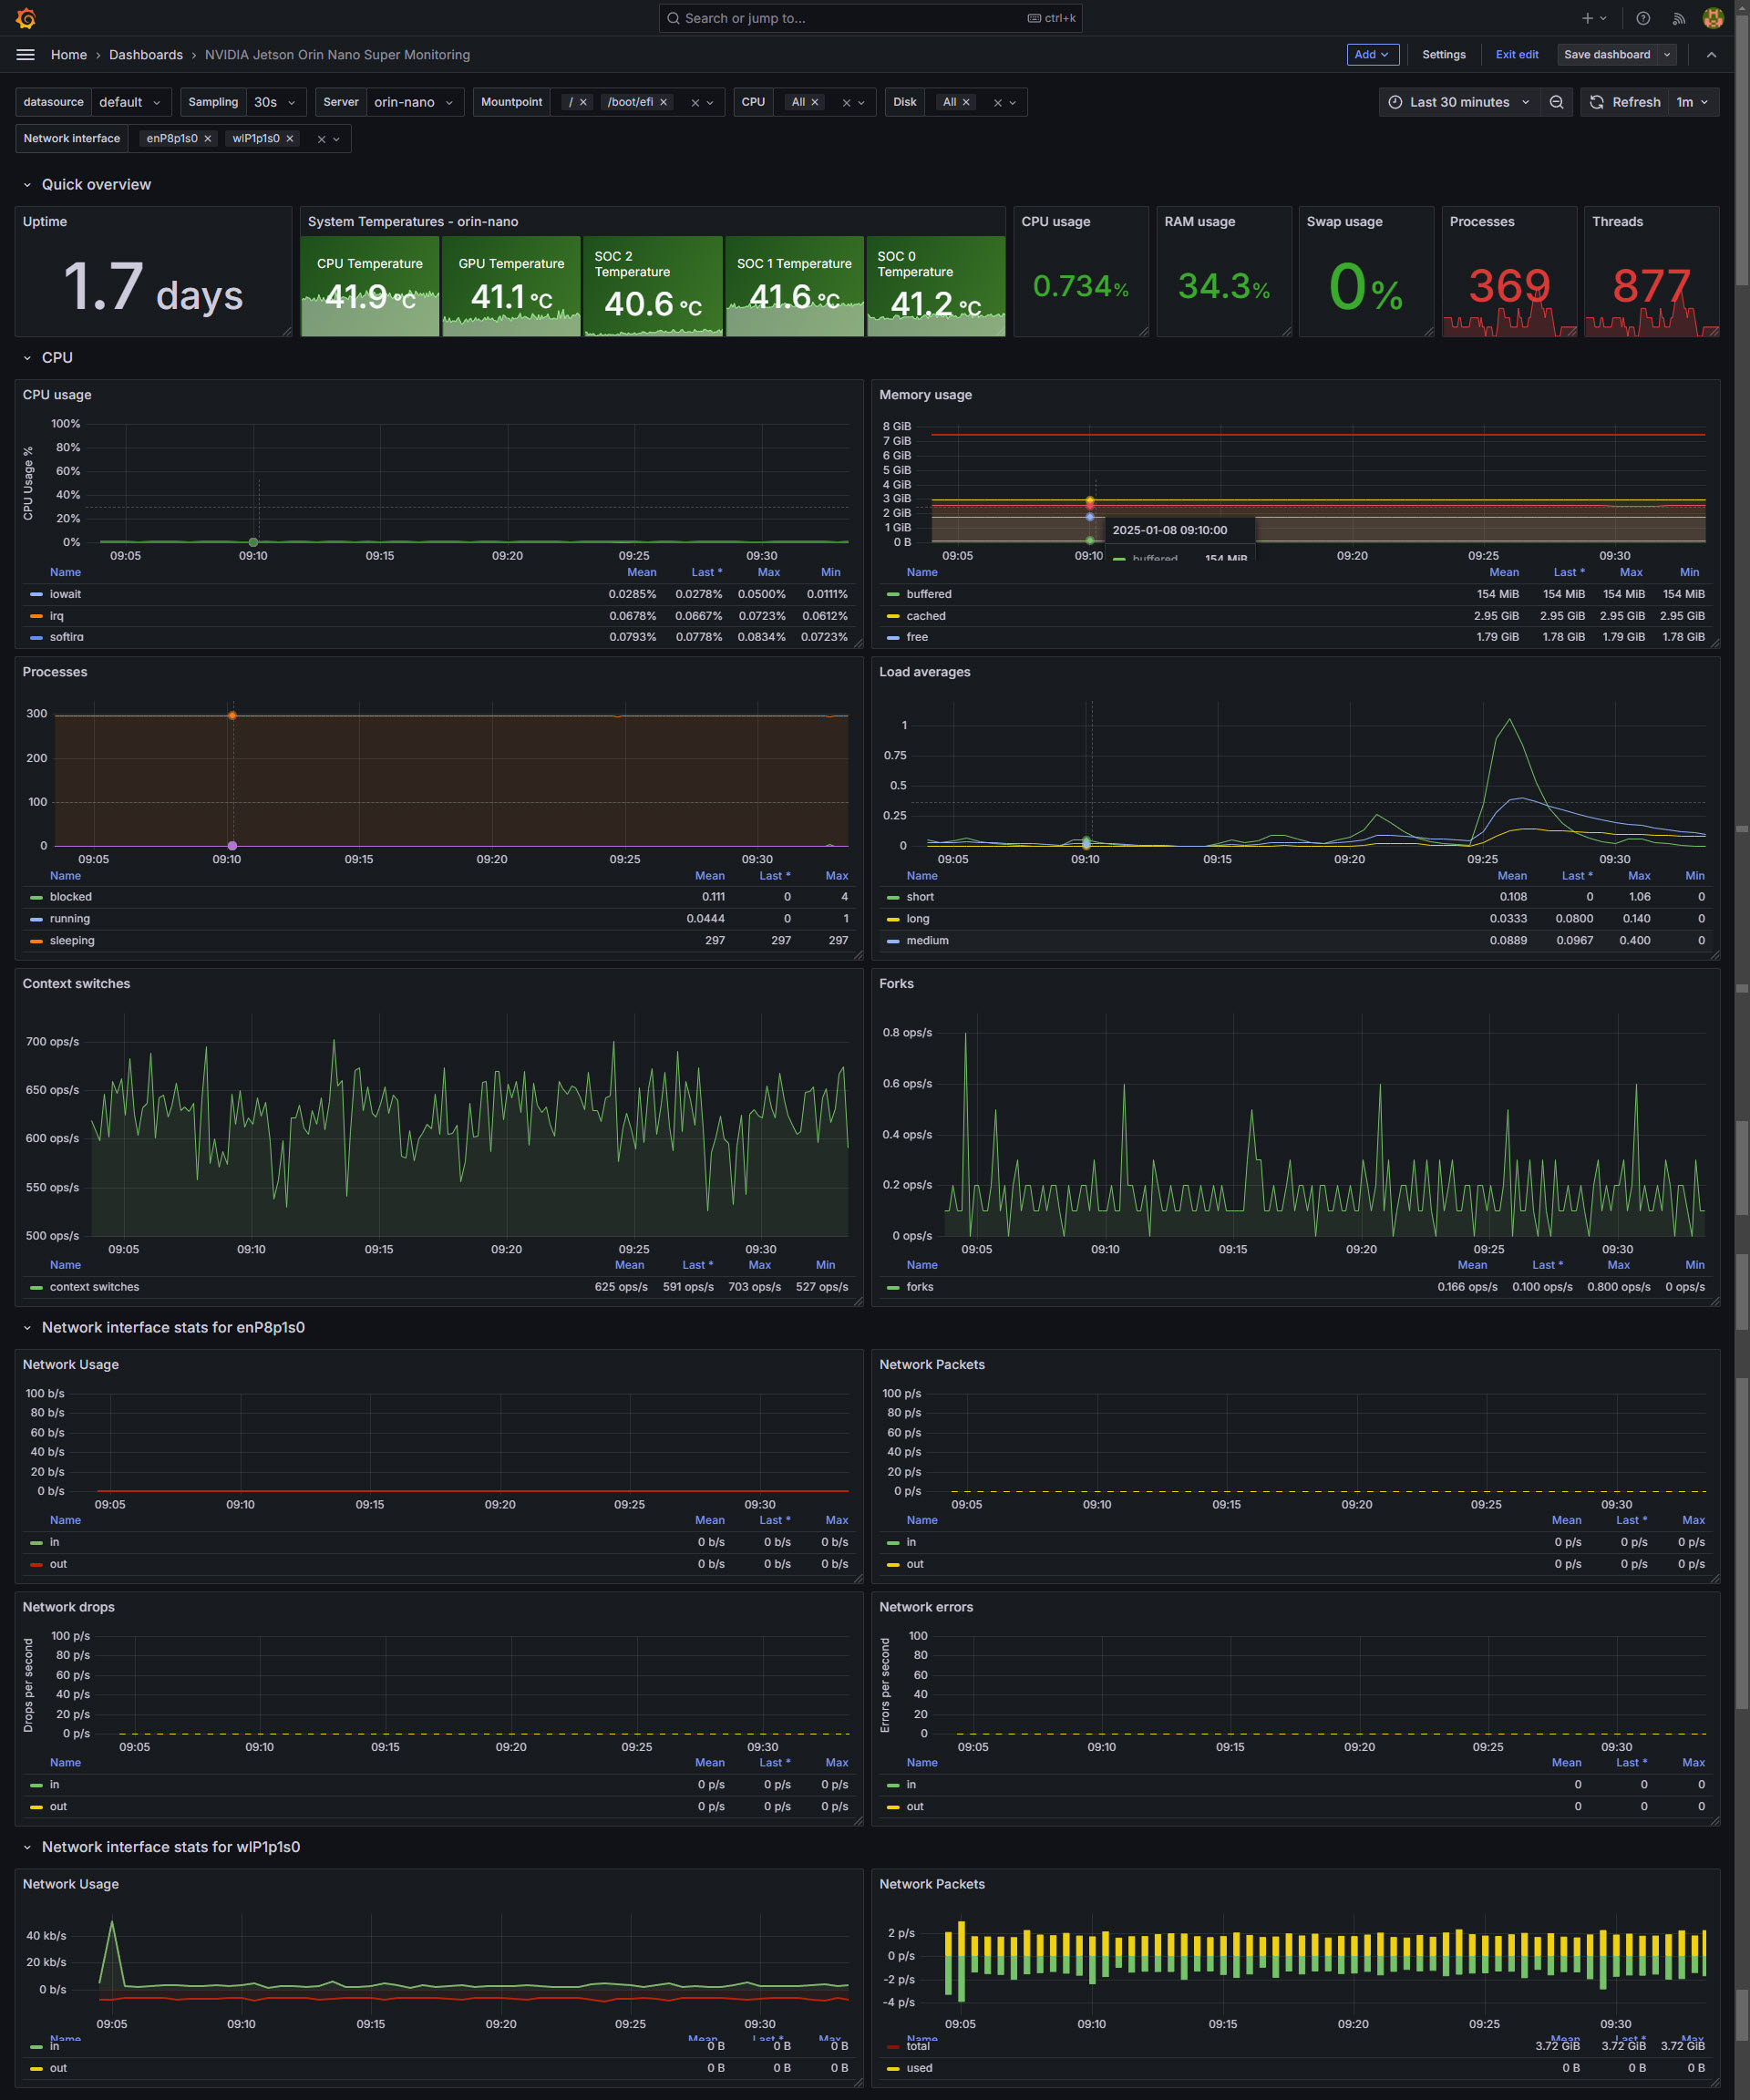 Dashboard – Summary
- Quick Overview – On the top bar we can find a quick overview of our NVIDIA Jetson Orin Nano: Uptime, Temperatures of the board, CPU/RAM/Swap usage, and processes and threats.
- Resources consumption – The CPU/RAM consumption plus processes, load, etc. all in historical to detect spikes.
- Network consumption – Truly important historical information with all we need regarding Network consumption and network status, like packets, drops, errors, etc.
- Disk IOPS/Volume Usage – Multiple visualisations about disks and volumes, showing consumption, iops, etc.
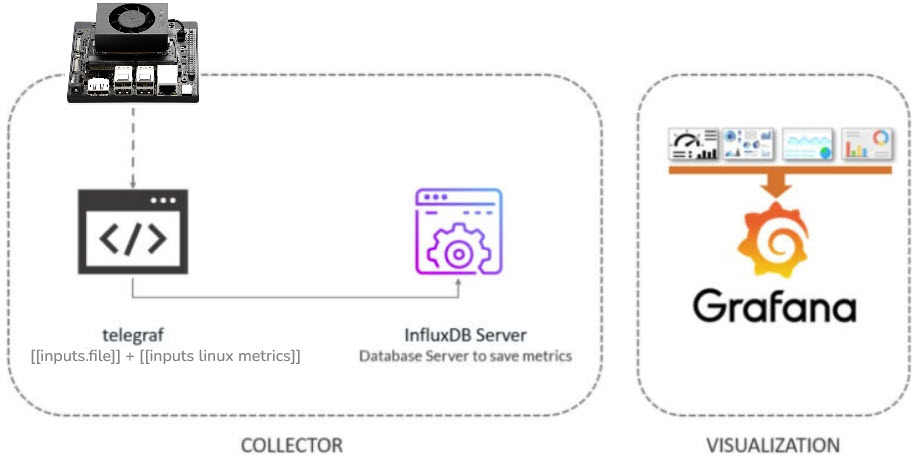
Topology with all logical components
This entry is very similar to the previous ones, we will use telegraf to collect the information from our Jetson Nano, from there we will send them to InfluxDB, and visualize them with Grafana . The design would be something similar to this:
How-to Install Telegraf on NVIDIA Jetson Nano Super
There is nothing out of the ordinary, and we can easily follow the InfluxDB steps, but in any case, let me walk you trough the step by step to install telegraf.
curl -fsSL https://repos.influxdata.com/influxdata-archive_compat.key |    gpg --dearmor |    sudo tee  /etc/apt/trusted.gpg.d/influxdata-archive_compat.gpg > /dev/null
echo 'deb [signed-by=/etc/apt/trusted.gpg.d/influxdata-archive_compat.gpg] https://repos.influxdata.com/debian stable main' \
| sudo tee /etc/apt/sources.list.d/influxdata.list
sudo apt-get update && sudo apt-get install telegraf
Once we install telegraf, I would recommend to create a few files under /etc/telegraf/telegraf.d/ one it will be called influx.conf, another called linux.conf, and last one called temperature.conf, let’s see the three files:
/etc/telegraf/telegraf.d/influx.conf
This file contains the configuration of your InfluxDB, on my case I have SSL, etc. This the output:
[outputs.influxdb_v2]
   urls = ["https://MYINFLUXSERVER.DOMAIN.COM:8086"]
   token = "YOURTOKEN"
   organization = "YOURORGNAME"
   bucket = "telegraf"
/etc/telegraf/telegraf.d/linux.conf
This file contains all that is needed for a proper Linux monitoring itself, like processes, RAM, CPU, etc.
[[inputs.cpu]]
    percpu = true
    totalcpu = true
    collect_cpu_time = false
    report_active = false
[[inputs.disk]]
    ignore_fs = ["tmpfs", "devtmpfs", "devfs"]
[[inputs.io]]
[[inputs.mem]]
[[inputs.net]]
[[inputs.system]]
[[inputs.swap]]
[[inputs.netstat]]
[[inputs.processes]]
[[inputs.kernel]]
/etc/telegraf/telegraf.d/temperature.conf
This file contains what it is required to monitor the temperature of our NVIDIA Jetson Nano Super. First of all let me explain how to see the temperatures available, by running the next command:
cat /sys/devices/virtual/thermal/thermal_zone*/type
cpu-thermal
gpu-thermal
cv0-thermal
cv1-thermal
cv2-thermal
soc0-thermal
soc1-thermal
soc2-thermal
tj-thermal
We can see if all are giving us values, on my case all the cvs are not getting me anything so I would not monitor them, but the rest, 100% recommended:
45281
44500
cat: /sys/devices/virtual/thermal/thermal_zone2/temp: Resource temporarily unavailable
cat: /sys/devices/virtual/thermal/thermal_zone3/temp: Resource temporarily unavailable
cat: /sys/devices/virtual/thermal/thermal_zone4/temp: Resource temporarily unavailable
44500
45031
44093
45281
So, all in all, this is the temperature.conf you should put:
[[inputs.file]]
  files = ["/sys/devices/virtual/thermal/thermal_zone0/temp"]
  name_override = "cpu_temperature"
  data_format = "value"
  data_type = "integer"

[[inputs.file]]
  files = ["/sys/devices/virtual/thermal/thermal_zone1/temp"]
  name_override = "gpu_temperature"
  data_format = "value"
  data_type = "integer"

[[inputs.file]]
  files = ["/sys/devices/virtual/thermal/thermal_zone5/temp"]
  name_override = "soc0_temperature"
  data_format = "value"
  data_type = "integer"

[[inputs.file]]
  files = ["/sys/devices/virtual/thermal/thermal_zone6/temp"]
  name_override = "soc1_temperature"
  data_format = "value"
  data_type = "integer"

[[inputs.file]]
  files = ["/sys/devices/virtual/thermal/thermal_zone7/temp"]
  name_override = "soc2_temperature"
  data_format = "value"
  data_type = "integer"
How-to test telegraf’s configuration
Let’s quickly check if everything is working, you can try whatever .conf you prefer, but in my case I want to try the temperature one, as it is a bit more hand-made:
root@orin-nano:/home/oper# telegraf --test --config /etc/telegraf/telegraf.d/temperature.conf
2025-01-08T09:48:11Z I! Loading config: /etc/telegraf/telegraf.d/temperature.conf
2025-01-08T09:48:11Z I! Starting Telegraf 1.33.0 brought to you by InfluxData the makers of InfluxDB
2025-01-08T09:48:11Z I! Available plugins: 236 inputs, 9 aggregators, 33 processors, 26 parsers, 63 outputs, 6 secret-stores
2025-01-08T09:48:11Z I! Loaded inputs: file (5x)
2025-01-08T09:48:11Z I! Loaded aggregators:
2025-01-08T09:48:11Z I! Loaded processors:
2025-01-08T09:48:11Z I! Loaded secretstores:
2025-01-08T09:48:11Z W! Outputs are not used in testing mode!
2025-01-08T09:48:11Z I! Tags enabled: host=orin-nano
> soc2_temperature,host=orin-nano value=41375i 1736329692000000000
> cpu_temperature,host=orin-nano value=42968i 1736329692000000000
> soc0_temperature,host=orin-nano value=41812i 1736329692000000000
> soc1_temperature,host=orin-nano value=42250i 1736329692000000000
> gpu_temperature,host=orin-nano value=41968i 1736329692000000000
It is all working!
Grafana Dashboards
I created a Dashboard using the RPI as inspiration, by selecting the best requests to the database, finishing off colors, thinking about graphics, and how to display them, and everything is automated so that it fits our environment without any problem and without having to edit anything manually. The Dashboard can be found here, once imported, you can use the top drop-down menus to select between the different variables:
Import Grafana Dashboards easily
I have already a wonderful Dashboard, ready just for you with everything you need to monitor our environment in a very simple way. Select the name you want and enter the ID: 22650, which is the unique ID of the Dashboard, or the URL:
 With the menus above you can display and adjust the Dashboard to your different choices:
I hope you like it, and I would like to leave you the complete series here, so you can start playing with the plugins that I have been telling you about all these years:
- Looking for the Perfect Dashboard: InfluxDB, Telegraf, and Grafana – Part I (Installing InfluxDB, Telegraf, and Grafana on Ubuntu 20.04 LTS)
- En busca del Dashboard perfecto: InfluxDB, Telegraf y Grafana – Parte II (Instalar agente Telegraf en Nodos remotos Linux)
- En busca del Dashboard perfecto: InfluxDB, Telegraf y Grafana – Parte III Integración con PRTG
- En busca del Dashboard perfecto: InfluxDB, Telegraf y Grafana – Parte IV (Instalar agente Telegraf en Nodos remotos Windows)
- En busca del Dashboard perfecto: InfluxDB, Telegraf y Grafana – Parte V (Activar inputs específicos, Red, MySQL/MariaDB, Nginx)
- En busca del Dashboard perfecto: InfluxDB, Telegraf y Grafana – Parte VI (Monitorizando Veeam)
- En busca del Dashboard perfecto: InfluxDB, Telegraf y Grafana – Parte VII (Monitorizar vSphere)
- En busca del Dashboard perfecto: InfluxDB, Telegraf y Grafana – Parte VIII (Monitorizando Veeam con Enterprise Manager)
- En busca del Dashboard perfecto: InfluxDB, Telegraf y Grafana – Parte IX (Monitorizando Zimbra Collaboration)
- En busca del Dashboard perfecto: InfluxDB, Telegraf y Grafana – Parte X (Grafana Plugins)
- En busca del Dashboard perfecto: InfluxDB, Telegraf y Grafana – Parte XI – (Monitorizando URL e IPS con Telegraf y Ping)
- Looking for the Perfect Dashboard: InfluxDB, Telegraf, and Grafana – Part XII (Native Telegraf Plugin for vSphere)
- Looking for the Perfect Dashboard: InfluxDB, Telegraf, and Grafana – Part XIII (Veeam Backup for Microsoft Office 365 v4)
- Looking for the Perfect Dashboard: InfluxDB, Telegraf, and Grafana – Part XIV – Veeam Availability Console
- Looking for the Perfect Dashboard: InfluxDB, Telegraf, and Grafana – Part XV (IPMI Monitoring of our ESXi Hosts)
- Looking for Perfect Dashboard: InfluxDB, Telegraf, and Grafana – Part XVI (Performance and Advanced Security of Veeam Backup for Microsoft Office 365)
- Looking for the Perfect Dashboard: InfluxDB, Telegraf, and Grafana – Part XVII (Showing Dashboards on Two Monitors Using Raspberry Pi 4)
- En busca del Dashboard perfecto: InfluxDB, Telegraf y Grafana – Parte XVIII – Monitorizar temperatura y estado de Raspberry Pi 4
- Looking for the Perfect Dashboard: InfluxDB, Telegraf, and Grafana – Part XIX (Monitoring Veeam with Enterprise Manager) Shell Script
- Looking for the Perfect Dashboard: InfluxDB, Telegraf, and Grafana – Part XXIV (Monitoring Veeam Backup for Microsoft Azure)
- Looking for the Perfect Dashboard: InfluxDB, Telegraf, and Grafana – Part XXV (Monitoring Power Consumption)
- Looking for the Perfect Dashboard: InfluxDB, Telegraf, and Grafana – Part XXVI (Monitoring Veeam Backup for Nutanix)
- Looking for the Perfect Dashboard: InfluxDB, Telegraf, and Grafana – Part XXVII (Monitoring ReFS and XFS (block-cloning and reflink)
- Looking for the Perfect Dashboard: InfluxDB, Telegraf, and Grafana – Part XXVIII (Monitoring HPE StoreOnce)
- Looking for the Perfect Dashboard: InfluxDB, Telegraf, and Grafana – Part XXIX (Monitoring Pi-hole)
- Looking for the Perfect Dashboard: InfluxDB, Telegraf, and Grafana – Part XXIX (Monitoring Veeam Backup for AWS)
- Looking for the Perfect Dashboard: InfluxDB, Telegraf, and Grafana – Part XXXI (Monitoring Unifi Protect)
- Looking for the Perfect Dashboard: InfluxDB, Telegraf, and Grafana – Part XXXII (Monitoring Veeam ONE – experimental)
- Looking for the Perfect Dashboard: InfluxDB, Telegraf, and Grafana – Part XXXIII (Monitoring NetApp ONTAP)
- Looking for the Perfect Dashboard: InfluxDB, Telegraf, and Grafana – Part XXXIV (Monitoring Runecast)
- Looking for the Perfect Dashboard: InfluxDB, Telegraf, and Grafana – Part XXXV (GPU Monitoring)
- Looking for the Perfect Dashboard: InfluxDB, Telegraf, and Grafana – Part XXXVI (Monitoring Goldshell Miners – JSONv2)
- Looking for the Perfect Dashboard: InfluxDB, Telegraf, and Grafana – Part XXXVII (Monitoring Veeam Backup for Google Cloud Platform)
- En Busca del Dashboard perfecto: InfluxDB, Telegraf y Grafana – Parte XXXVIII (Monitorizando Temperatura y Humedad con Xiaomi Mijia)
- Looking for the Perfect Dashboard: InfluxDB, Telegraf, and Grafana – Part XL (Veeam Backup for Microsoft 365 – Restore Audit)
- Looking for the Perfect Dashboard: InfluxDB, Telegraf, and Grafana – Part XLI (Veeam Backup for Salesforce)
- Looking for the Perfect Dashboard: InfluxDB, Telegraf, and Grafana – Part XLII (Veeam ONE v12 Audit Events)
- Looking for the Perfect Dashboard: InfluxDB, Telegraf, and Grafana – Part XLIII (Monitoring QNAP using SNMP v3)
- Looking for the Perfect Dashboard: InfluxDB, Telegraf, and Grafana – Part XLIV (Monitoring Veeam Backup & Replication API)
- Looking for the Perfect Dashboard: InfluxDB, Telegraf, and Grafana – Part XLV (Monitoring Synology using SNMP v3)
- Looking for the Perfect Dashboard: InfluxDB, Telegraf, and Grafana – Part XLVI (Monitoring NVIDIA Jetson Nano)
- Looking for the Perfect Dashboard: InfluxDB, Telegraf, and Grafana – Part XLVII (Monitoring Open WebUI)
- Looking for the Perfect Dashboard: InfluxDB, Telegraf, and Grafana – Part XLVIII (Monitoring Veeam Data Platform Advanced)
- Looking for the Perfect Dashboard: InfluxDB, Telegraf, and Grafana – Part XLIX (Monitoring Unofficial Veeam ONE Node Exporter)
Leave a Reply