
 Greetings friends, for years I have been exploring all the Veeam APIs, for all the multiple products the company has. Started back in the day with Veeam Backup for Microsoft 365, then Enterprise Manager to more recently Veeam Backup for Salesforce, and the super popular Veeam Backup & Replication Grafana dashboard that has 1552 downloads already.
I covered briefly years ago Veeam ONE API, and built an unofficial and unsupported back then Grafana. Since then many things happened, I even became the Product Manager of Veeam ONE! And one of my main goals with the solution is to keep a very strong and fulfilled API. Take a look a the Veeam ONE REST API Reference Map, or just jump to the API Reference.
Veeam ONE, which is part of Veeam Data Platform Advanced, has an unique, massive, yet simple API with all the information across many platforms, for example it includes ALL the Job policies Veeam Backup & Replication has, also Veeam Backup for Microsoft 365, and Veeam Backup for Public Cloud, that alone is a lot, on simple endpoints we can query. So, after years of talking daily with Customers about how powerful Veeam ONE API is, it was time to dig deep and eat my own dog food.
Grafana Dashboards for Veeam ONE API
I have prepared two views, for now, using Veeam ONE API, views that include absolutely everything (Onprem ALL Veeam supported hypervisors, All Job Types, Public Cloud, and even VB365!). When you finish this article, if you follow all the steps, you should have something similar to this. It might be different in content of course depending of your environment.

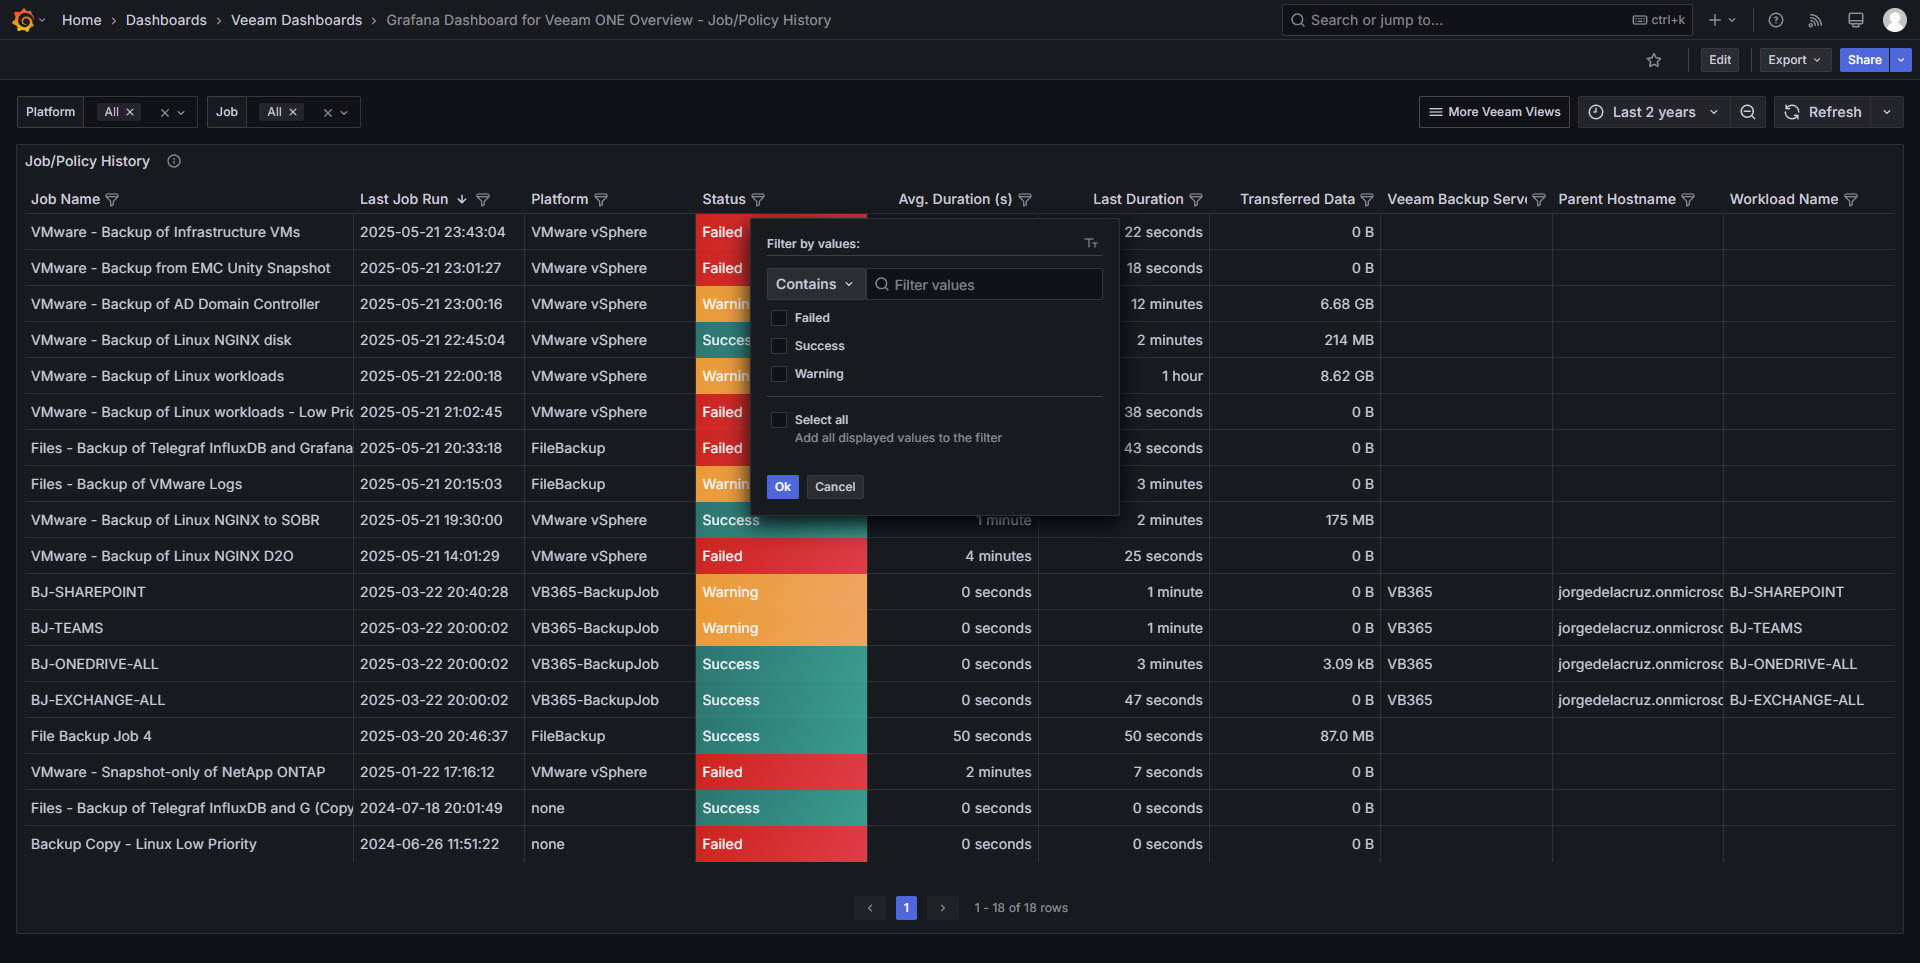
Job Policy History – Summary
- Platform support: VM Backups, Cloud Director Backups, VM Replication, Backup Copy, VM Copy, File Backup, Agent Backup, Agent Policies, Microsoft 365 Backup, Public Cloud Policies
- Last Job Run: Easy to see and filter when the job finished last time
- Platform: Easy to filter by platform
- Status: Coloured by status
- Avg Duration: For the jobs that supports this metric
- Last Duration: For the jobs that supports this metric
- Transferred Data: For the jobs that supports this metric
- Backup Server: Whenever available
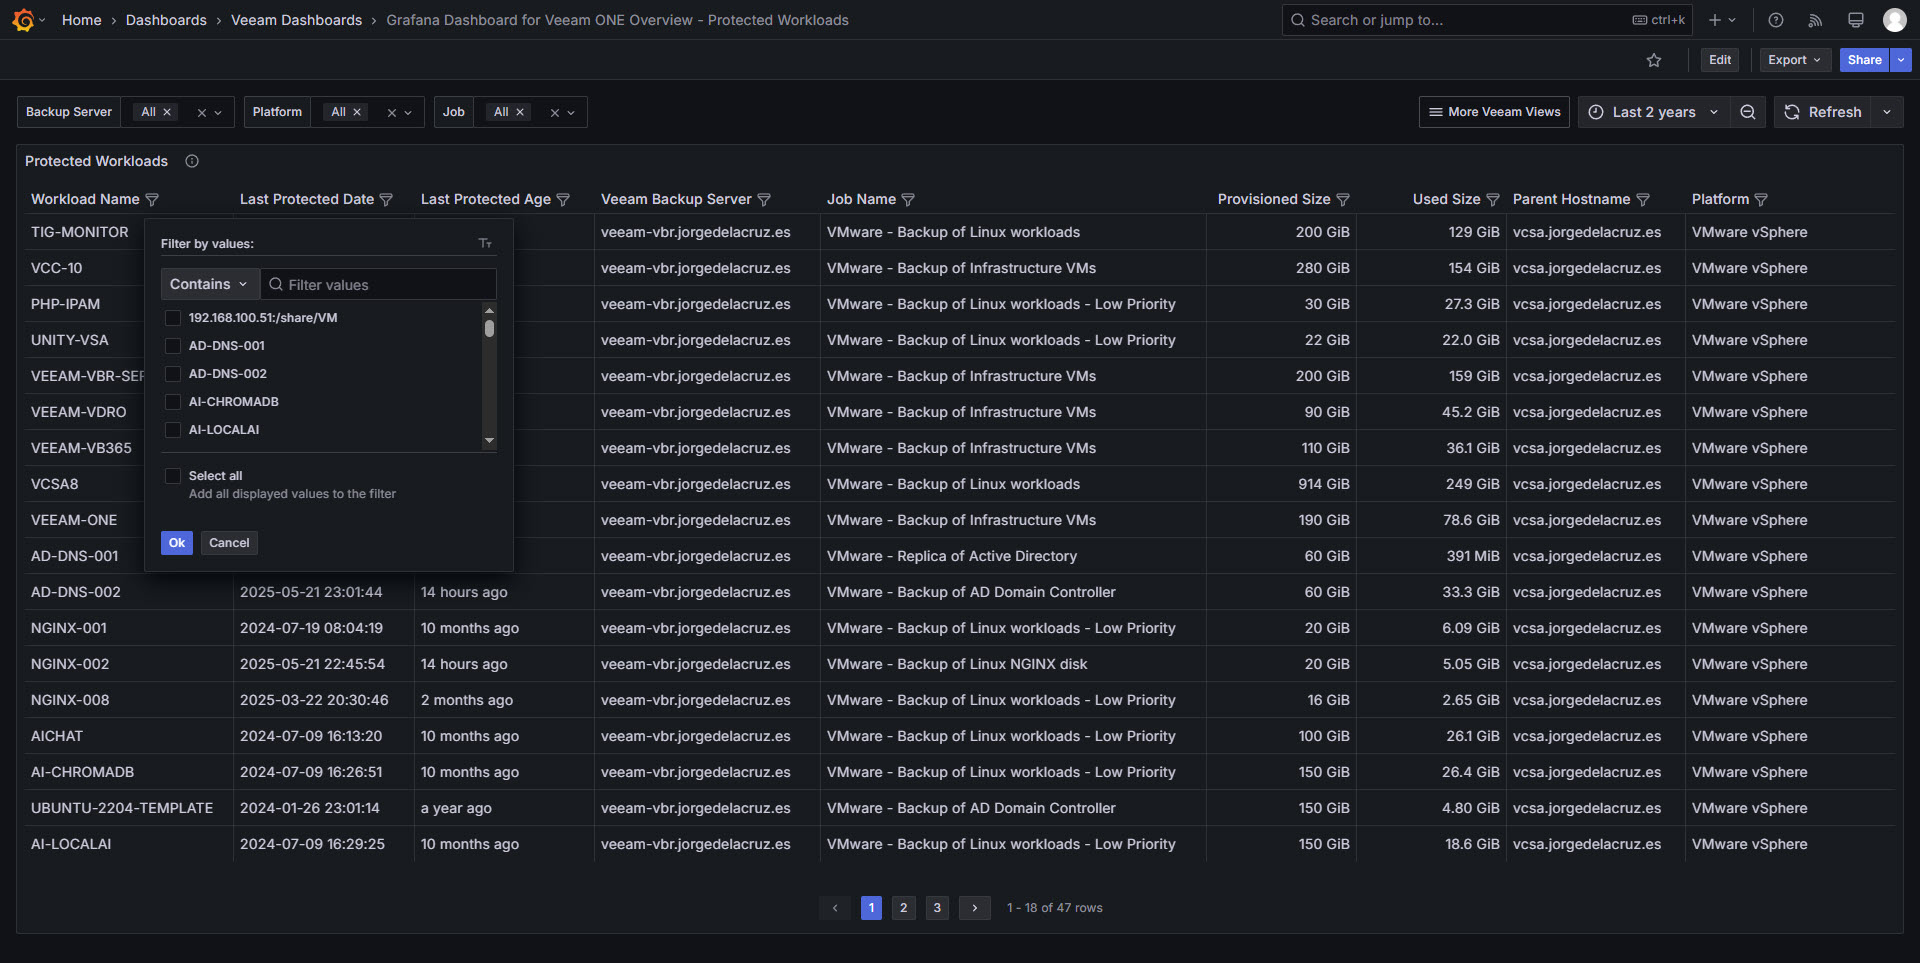
Protected Workloads – Summary
- Platform support: Virtual Machines (all supported hypervisors), Computers (all supported types), File Shares, Object Storage, Enterprise Applications, 365 Users, 365 Groups, 365 Sites, 365 Teams, Public Cloud VMs, Public Cloud Files, Public Cloud Databases, Public Cloud Networks
- Workload Name: Get granular, find that workload you are interested
- Last protected date: In regular date format
- Last protected age: Human-friendly date format
- Backup Server: To filter by VBR when you have hundreds
- Job Name: Super useful to identify workloads on multiple jobs
- Provisioned Size, Used Size: Whenever available, usually just for VMs
- Parent Hostname: Good to identify the vCenter, or Cluster where the workload belongs
- Platform: Easy to filter by platform
Topology with all logical components
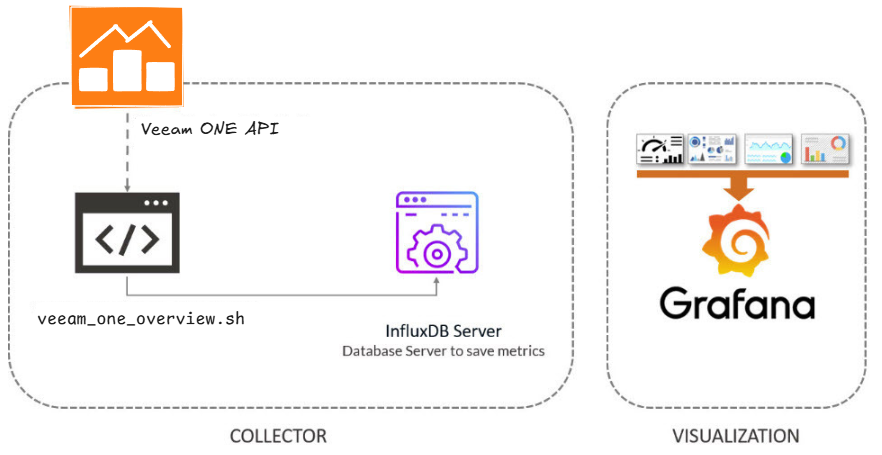
This entry is very similar to the previous ones, we will use a custom bash shell script to collect the API information from our Veeam ONE API, from there we will send them to InfluxDB, and visualize them with Grafana . The design would be something similar to this:
How-to download and configure veeam_one_overview.sh script
I have created a custom bash shell script so you do not need to spend your time dealing with Veeam ONE API, which is very comprehensive, but no swagger at the moment.
You will need jq, so please go ahead and install it first (apt-get install jq, or yum install jq)
This shell script can be downloaded and run from the telegraf server, InfluxDB, or any other Linux. We will have to edit the configuration parameters:
# Configurations
##
# Endpoint URL for InfluxDB
veeamInfluxDBURL="YOURINFLUXSERVER" #Your InfluxDB Server, http://FQDN or https://FQDN if using SSL
veeamInfluxDBPort="8086" #Default Port
veeamInfluxDBBucket="YOURINFLUXDB" # InfluxDB bucket name (not ID)
veeamInfluxDBToken="TOKEN" # InfluxDB access token with read/write privileges for the bucket
veeamInfluxDBOrg="ORG NAME" # InfluxDB organisation name (not ID)

# Endpoint URL for login action
veeamUsername="YOURVEEAMONEUSER" #Usually domain\user or [email protected]
veeamPassword="YOURVEEAMONEPASS"
veeamONEServer="https://YOURVEEAMONEIP" #You can use FQDN if you like as well
veeamONEPort="1239" #Default Port
Once the changes are done, make the script executable with chmod:
chmod +x veeam_one_overview.sh
Run it with ./veeam_one_overview.sh if everything is good you should see something similar to this:
Writing veeam_ONE_about to InfluxDB
Writing veeam_ONE_overview_protectedvms data to InfluxDB
Writing veeam_ONE_overview_protectedvms data to InfluxDB
Writing veeam_ONE_overview_protectedvms data to InfluxDB
Writing veeam_ONE_overview_protectedvms data to InfluxDB
Writing veeam_ONE_overview_protectedvms data to InfluxDB
Writing veeam_ONE_overview_protectedvms data to InfluxDB
Writing veeam_ONE_overview_protectedvms data to InfluxDB
Writing veeam_ONE_overview_protectedvms data to InfluxDB
Writing veeam_ONE_overview_protectedvms data to InfluxDB
Writing veeam_ONE_overview_protectedvms data to InfluxDB
If so, please now add this script to your crontab, like for example every 60 minutes:
*/60 * * * * * /home/oper/veeam_one_overview.sh >> /var/log/veeam_one_overview.log 2>&1
A few notes about the script. You would need to have Veeam ONE installed, up and running, use credentials like domain\user. Also, you might have more than 100 jobs, or 100 workloads, so fine-tune the limit API calls. Last but not least, if you are using InfluxDB without valid SSL, you will need to change the influx write for influx write --skip-verify 
Grafana Dashboards
I created two Dashboards from scratch by selecting the best requests to the database, finishing off colors, thinking about graphics, and how to display them, and everything is automated so that it fits our environment without any problem and without having to edit anything manually.
- Grafana Dashboard for Veeam ONE Overview – Protected Workloads | Grafana Labs
- Grafana Dashboard for Veeam ONE Overview – Job/Policy History | Grafana Labs
Import Grafana Dashboards easily
I have already a wonderful Dashboard, ready just for you with everything you need to monitor our environment in a very simple way. Select the name you want and enter the ID: 22867, which is the unique ID of the Dashboard, or the URL:
- 23465
- 23466
 And that’s it. With the menus on the top you can display and adjust the Dashboard to your different choices, like jobs, workloads, etc.:
I hope you like it, and I would like to leave you the complete series here, so you can start playing with the plugins that I have been telling you about all these years:
- Looking for the Perfect Dashboard: InfluxDB, Telegraf, and Grafana – Part I (Installing InfluxDB, Telegraf, and Grafana on Ubuntu 20.04 LTS)
- En busca del Dashboard perfecto: InfluxDB, Telegraf y Grafana – Parte II (Instalar agente Telegraf en Nodos remotos Linux)
- En busca del Dashboard perfecto: InfluxDB, Telegraf y Grafana – Parte III Integración con PRTG
- En busca del Dashboard perfecto: InfluxDB, Telegraf y Grafana – Parte IV (Instalar agente Telegraf en Nodos remotos Windows)
- En busca del Dashboard perfecto: InfluxDB, Telegraf y Grafana – Parte V (Activar inputs específicos, Red, MySQL/MariaDB, Nginx)
- En busca del Dashboard perfecto: InfluxDB, Telegraf y Grafana – Parte VI (Monitorizando Veeam)
- En busca del Dashboard perfecto: InfluxDB, Telegraf y Grafana – Parte VII (Monitorizar vSphere)
- En busca del Dashboard perfecto: InfluxDB, Telegraf y Grafana – Parte VIII (Monitorizando Veeam con Enterprise Manager)
- En busca del Dashboard perfecto: InfluxDB, Telegraf y Grafana – Parte IX (Monitorizando Zimbra Collaboration)
- En busca del Dashboard perfecto: InfluxDB, Telegraf y Grafana – Parte X (Grafana Plugins)
- En busca del Dashboard perfecto: InfluxDB, Telegraf y Grafana – Parte XI – (Monitorizando URL e IPS con Telegraf y Ping)
- Looking for the Perfect Dashboard: InfluxDB, Telegraf, and Grafana – Part XII (Native Telegraf Plugin for vSphere)
- Looking for the Perfect Dashboard: InfluxDB, Telegraf, and Grafana – Part XIII (Veeam Backup for Microsoft Office 365 v4)
- Looking for the Perfect Dashboard: InfluxDB, Telegraf, and Grafana – Part XIV – Veeam Availability Console
- Looking for the Perfect Dashboard: InfluxDB, Telegraf, and Grafana – Part XV (IPMI Monitoring of our ESXi Hosts)
- Looking for Perfect Dashboard: InfluxDB, Telegraf, and Grafana – Part XVI (Performance and Advanced Security of Veeam Backup for Microsoft Office 365)
- Looking for the Perfect Dashboard: InfluxDB, Telegraf, and Grafana – Part XVII (Showing Dashboards on Two Monitors Using Raspberry Pi 4)
- En busca del Dashboard perfecto: InfluxDB, Telegraf y Grafana – Parte XVIII – Monitorizar temperatura y estado de Raspberry Pi 4
- Looking for the Perfect Dashboard: InfluxDB, Telegraf, and Grafana – Part XIX (Monitoring Veeam with Enterprise Manager) Shell Script
- Looking for the Perfect Dashboard: InfluxDB, Telegraf, and Grafana – Part XXIV (Monitoring Veeam Backup for Microsoft Azure)
- Looking for the Perfect Dashboard: InfluxDB, Telegraf, and Grafana – Part XXV (Monitoring Power Consumption)
- Looking for the Perfect Dashboard: InfluxDB, Telegraf, and Grafana – Part XXVI (Monitoring Veeam Backup for Nutanix)
- Looking for the Perfect Dashboard: InfluxDB, Telegraf, and Grafana – Part XXVII (Monitoring ReFS and XFS (block-cloning and reflink)
- Looking for the Perfect Dashboard: InfluxDB, Telegraf, and Grafana – Part XXVIII (Monitoring HPE StoreOnce)
- Looking for the Perfect Dashboard: InfluxDB, Telegraf, and Grafana – Part XXIX (Monitoring Pi-hole)
- Looking for the Perfect Dashboard: InfluxDB, Telegraf, and Grafana – Part XXIX (Monitoring Veeam Backup for AWS)
- Looking for the Perfect Dashboard: InfluxDB, Telegraf, and Grafana – Part XXXI (Monitoring Unifi Protect)
- Looking for the Perfect Dashboard: InfluxDB, Telegraf, and Grafana – Part XXXII (Monitoring Veeam ONE – experimental)
- Looking for the Perfect Dashboard: InfluxDB, Telegraf, and Grafana – Part XXXIII (Monitoring NetApp ONTAP)
- Looking for the Perfect Dashboard: InfluxDB, Telegraf, and Grafana – Part XXXIV (Monitoring Runecast)
- Looking for the Perfect Dashboard: InfluxDB, Telegraf, and Grafana – Part XXXV (GPU Monitoring)
- Looking for the Perfect Dashboard: InfluxDB, Telegraf, and Grafana – Part XXXVI (Monitoring Goldshell Miners – JSONv2)
- Looking for the Perfect Dashboard: InfluxDB, Telegraf, and Grafana – Part XXXVII (Monitoring Veeam Backup for Google Cloud Platform)
- En Busca del Dashboard perfecto: InfluxDB, Telegraf y Grafana – Parte XXXVIII (Monitorizando Temperatura y Humedad con Xiaomi Mijia)
- Looking for the Perfect Dashboard: InfluxDB, Telegraf, and Grafana – Part XL (Veeam Backup for Microsoft 365 – Restore Audit)
- Looking for the Perfect Dashboard: InfluxDB, Telegraf, and Grafana – Part XLI (Veeam Backup for Salesforce)
- Looking for the Perfect Dashboard: InfluxDB, Telegraf, and Grafana – Part XLII (Veeam ONE v12 Audit Events)
- Looking for the Perfect Dashboard: InfluxDB, Telegraf, and Grafana – Part XLIII (Monitoring QNAP using SNMP v3)
- Looking for the Perfect Dashboard: InfluxDB, Telegraf, and Grafana – Part XLIV (Monitoring Veeam Backup & Replication API)
- Looking for the Perfect Dashboard: InfluxDB, Telegraf, and Grafana – Part XLV (Monitoring Synology using SNMP v3)
- Looking for the Perfect Dashboard: InfluxDB, Telegraf, and Grafana – Part XLVI (Monitoring NVIDIA Jetson Nano)
- Looking for the Perfect Dashboard: InfluxDB, Telegraf, and Grafana – Part XLVII (Monitoring Open WebUI)
- Looking for the Perfect Dashboard: InfluxDB, Telegraf, and Grafana – Part XLVIII (Monitoring Veeam Data Platform Advanced)
- Looking for the Perfect Dashboard: InfluxDB, Telegraf, and Grafana – Part XLIX (Monitoring Unofficial Veeam ONE Node Exporter)
Leave a Reply