
 Greetings friends, in case you are not aware. Veeam has released an early release of Veeam Software Appliance; a pre-built, pre-hardened, predictable linux appliance that can be deployed super fast and secure. Anton Gostev talks about initial numbers in his latest LinkedIn update, and it is absolutely mind-blowing the current statistics, especially not having major bugs in it, considering the major shift on paradigm.
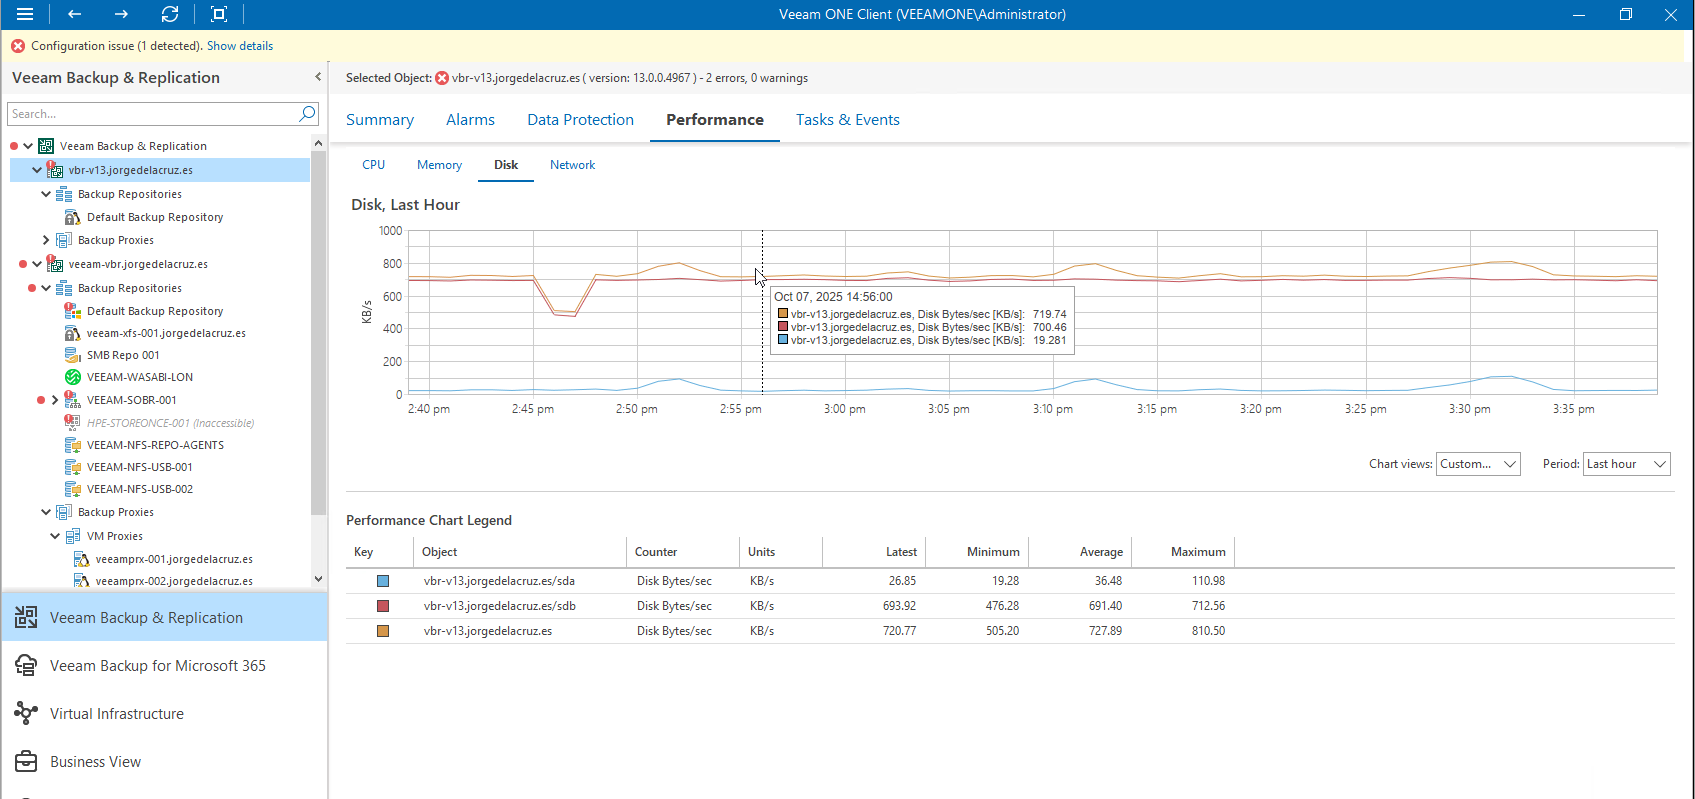
Within pre-hardened, and pre-built, comes as well monitoring and observability, because as much as we all love a black box that we do not need to maintain, it is paramount to get some level of visibility, and that is where Veeam ONE v13 comes to the rescue. Veeam ONE is the only approved software at the moment that monitors Veeam Software Appliance, among of course current Veeam Backup & Replication v12.x, Backup Proxies, Repositories, Veeam Backup for Microsoft 365 Servers, etc.
Even with the great visibility that Veeam ONE offers today for Veeam Software Appliance; Reports, Alarms, Dashboards, Monitoring, etc. I have heard that many Customers and Community members would really appreciate the following view exported to some open format, like Prometheus.
 Currently, this is not available. But this blog post is to briefly use an unsupported and unofficial node_exporter to export this data out of Veeam ONE, let’s go!
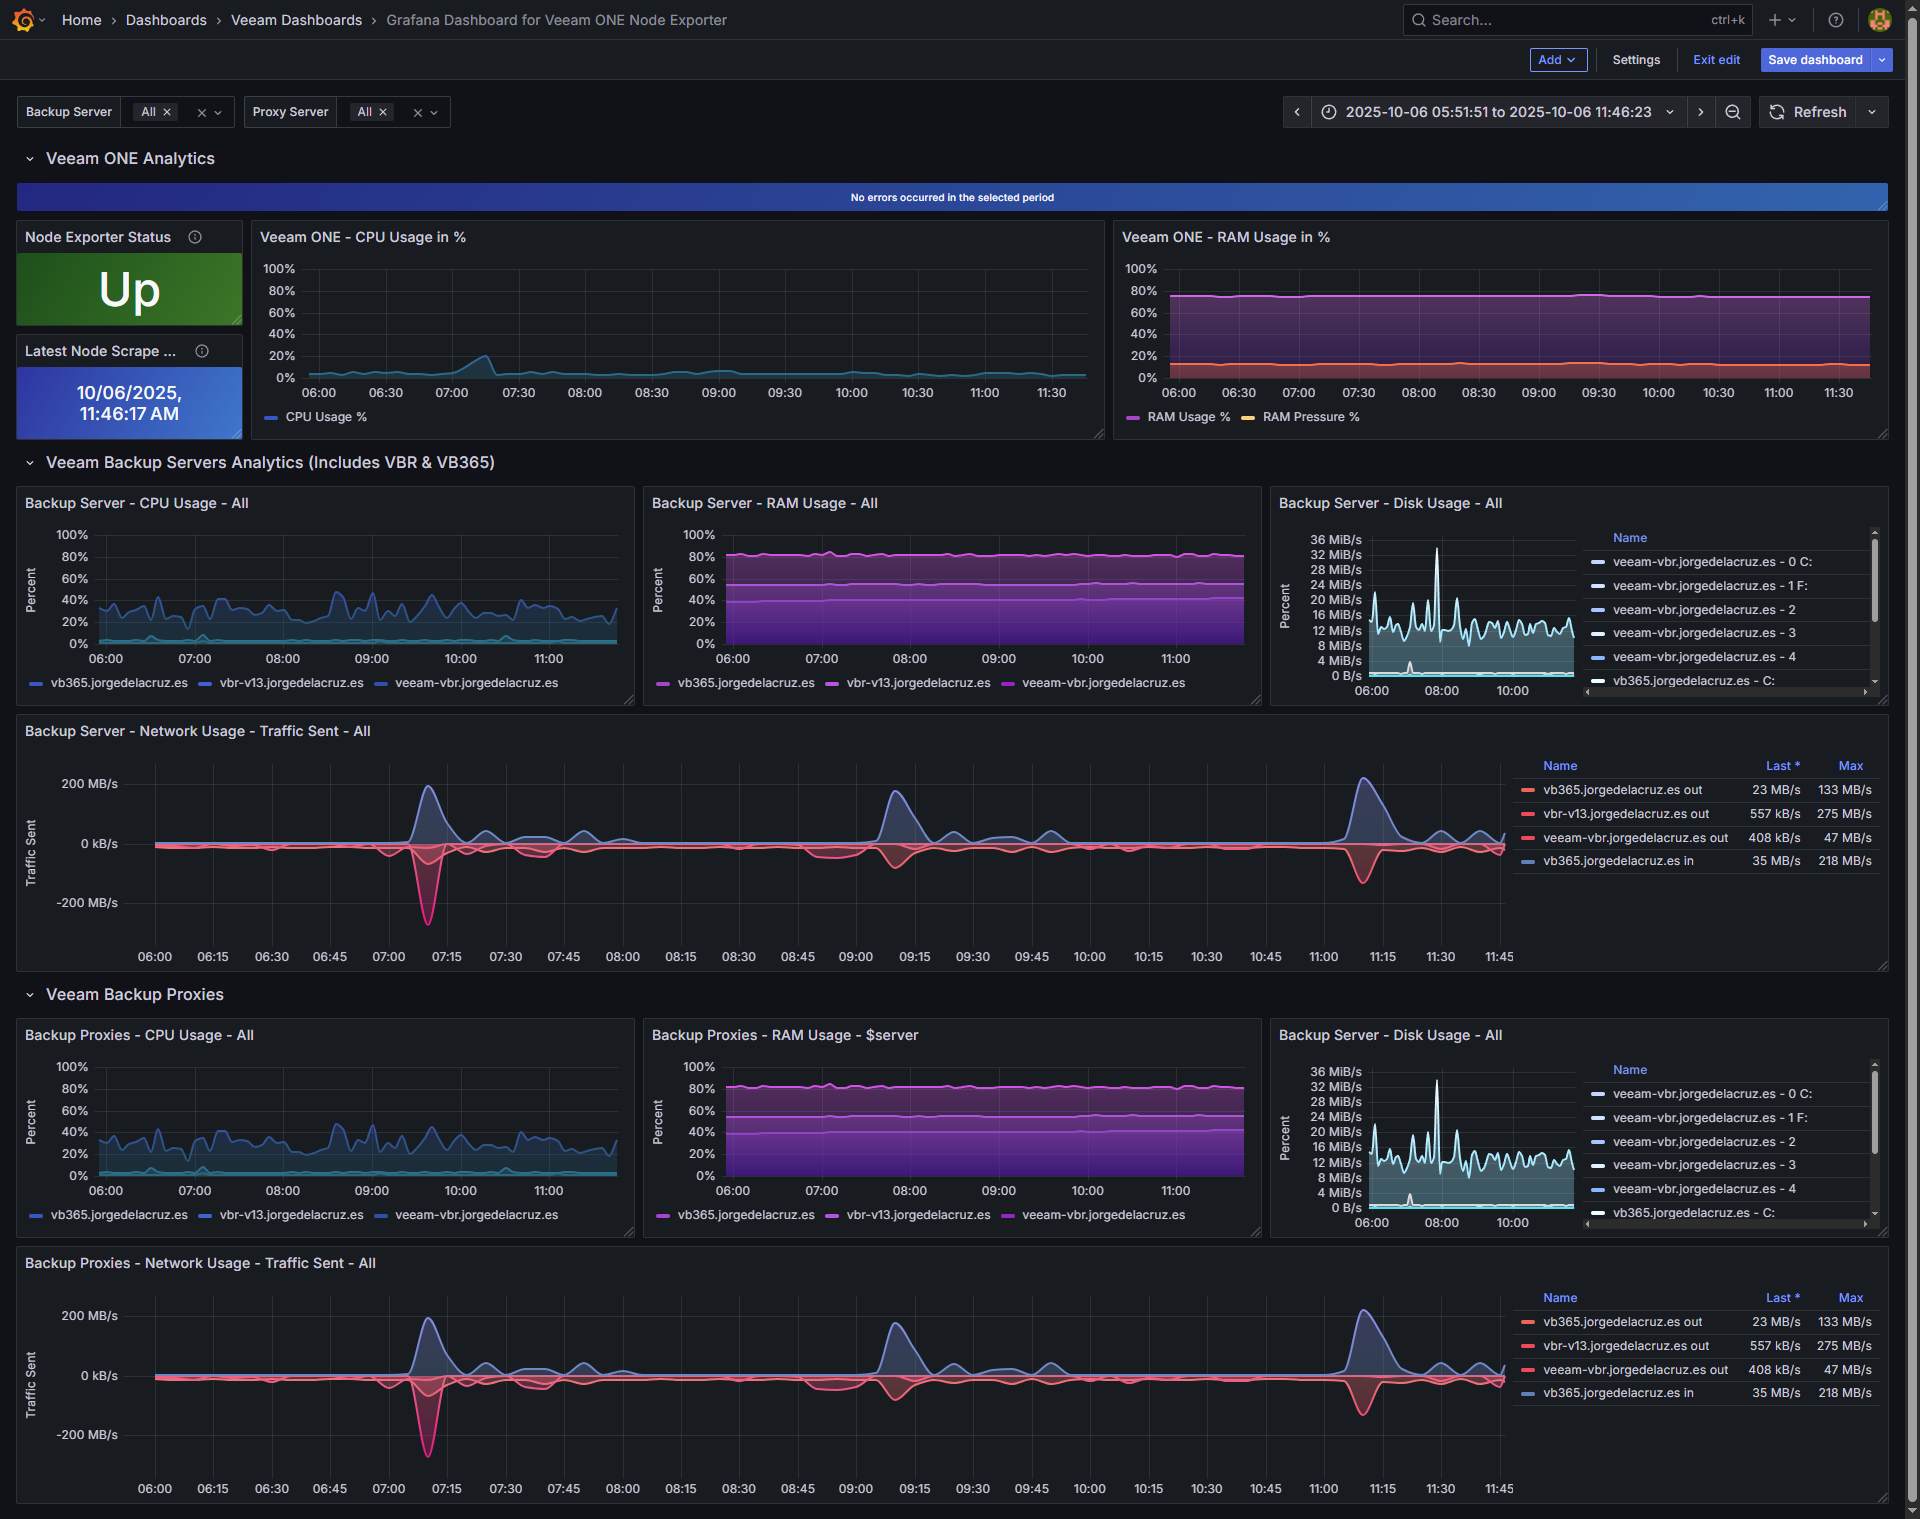
Grafana Dashboard for Unofficial Veeam ONE Node Exporter
When you finish the entry you will have something similar to this. It might look a bit different depending of how many servers you have, but should work out of the box:
 Dashboard – Summary
- Veeam ONE Analytics (Node Exporter Health):
- Summary bar: The dashboard starts with a blue bar in case there are no recent errors, and it changes showing the error in case that any.
- Status: It displays if the Node Exporter is up and running and collecting data
- Latest node scrap: It shows clearly when it was the last successful data collection from the Node Exporter
- Veeam ONE CPU Usage
- Veeam ONE RAM Usage
- Veeam Backup Servers & VB365 Servers CPU Usage
- Veeam Backup Servers & VB365 Servers RAM Usage
- Veeam Backup Servers & VB365 Servers Disk Usage
- Veeam Backup Servers & VB365 Servers Network Usage
- Veeam Backup Proxies & VB365 Proxies CPU Usage
- Veeam Backup Proxies & VB365 Proxies RAM Usage
- Veeam Backup Proxies & VB365 Proxies Disk Usage
- Veeam Backup Proxies & VB365 Network Usage
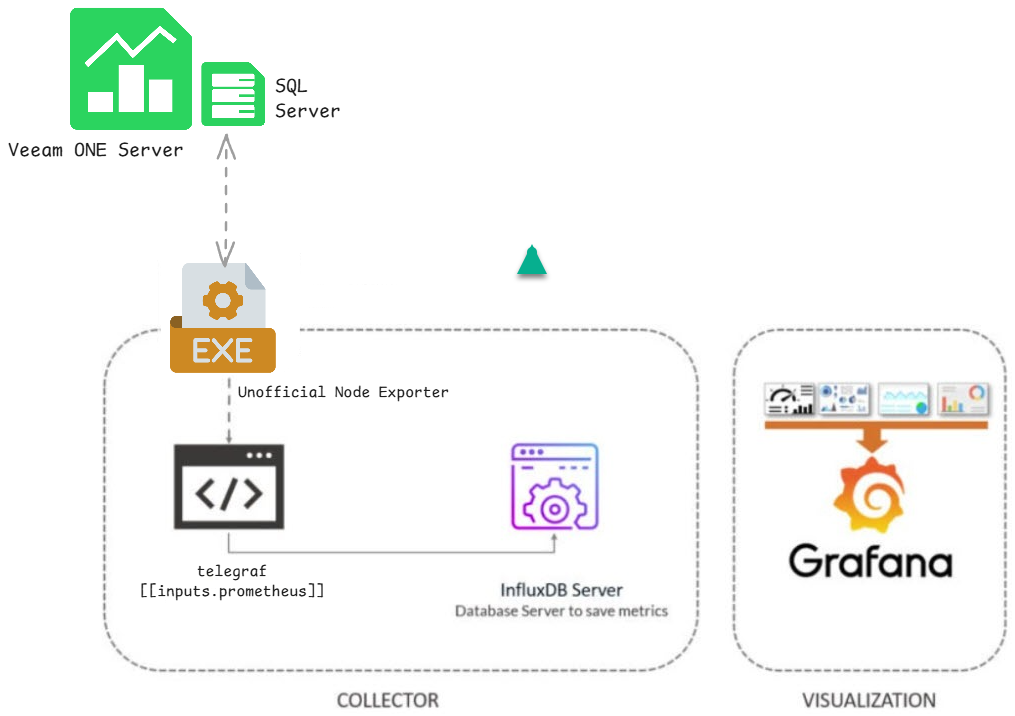
Topology with all logical components
This entry is unique, as it is the very first time I build a .exe to perform some very specific tasks like looking at the correct parts of the database, and exporting that information out. Once we have the unofficial Node Exporter, it is very easy to add to any collector using telegraf or similar, then storing that data into InfluxDB and visualise it.
How-to download the unofficial node exporter
I have created an unofficial executable that connects to Veeam ONE Microsoft SQL Server and exposes the required data into a Node Exporter format, it can be easily downloaded from here:
There is no installation required, just run the .exe once extracted. By default it is connecting to a SQL that is on the same machine, and with the Windows credentials, this should be okay for small labs or environments. If you have a dedicated SQL Server outside of Veeam ONE, and SQL credentials, please specify that on the appsettings.json and run the .exe again.
If everything goes as planned, you can now navigate to http://127.0.0.1:9108/metrics and see the next metrics:
# HELP vone_exporter_up Exporter health
# TYPE vone_exporter_up gauge
vone_exporter_up 1
# HELP vone_exporter_last_scrape_success_seconds Unix time of last successful scrape
# TYPE vone_exporter_last_scrape_success_seconds gauge
vone_exporter_last_scrape_success_seconds 1759694296
# HELP vone_exporter_last_scrape_error_info Last scrape error info (0 means none)
# TYPE vone_exporter_last_scrape_error_info gauge
vone_exporter_last_scrape_error_info{message="none"} 1
# HELP vone_exporter_veeam_one_server_memory_usage_percent Veeam ONE server memory usage percent
# TYPE vone_exporter_veeam_one_server_memory_usage_percent gauge
# HELP vone_exporter_veeam_one_server_memory_pressure_percent Veeam ONE server memory pressure percent
# TYPE vone_exporter_veeam_one_server_memory_pressure_percent gauge
# HELP vone_exporter_veeam_one_server_cpu_usage_percent Veeam ONE server CPU usage percent
# TYPE vone_exporter_veeam_one_server_cpu_usage_percent gauge
# HELP vone_exporter_memory_available_bytes Available memory in bytes
# TYPE vone_exporter_memory_available_bytes gauge
# HELP vone_exporter_memory_used_bytes Used memory in bytes
# TYPE vone_exporter_memory_used_bytes gauge
# HELP vone_exporter_cpu_usage_percent CPU usage percent
# TYPE vone_exporter_cpu_usage_percent gauge
# HELP vone_exporter_net_bytes_total_per_sec Network total bytes per second
# TYPE vone_exporter_net_bytes_total_per_sec gauge
# HELP vone_exporter_net_bytes_received_per_sec Network bytes received per second
# TYPE vone_exporter_net_bytes_received_per_sec gauge
# HELP vone_exporter_net_bytes_sent_per_sec Network bytes sent per second
# TYPE vone_exporter_net_bytes_sent_per_sec gauge
# HELP vone_exporter_disk_read_bytes_per_sec Disk read bytes per second
# TYPE vone_exporter_disk_read_bytes_per_sec gauge
# HELP vone_exporter_disk_write_bytes_per_sec Disk write bytes per second
# TYPE vone_exporter_disk_write_bytes_per_sec gauge
# HELP vone_exporter_disk_bytes_per_sec Disk bytes per second
# TYPE vone_exporter_disk_bytes_per_sec gauge
# HELP vone_exporter_memory_usage_percent Memory usage percent
# TYPE vone_exporter_memory_usage_percent gauge
vone_exporter_veeam_one_server_memory_usage_percent{host="Virtual Infrastructure",role="veeam_srv"} 76.16 1759694100000
vone_exporter_veeam_one_server_memory_pressure_percent{host="Virtual Infrastructure",role="veeam_srv"} 12.66 1759694100000
vone_exporter_veeam_one_server_cpu_usage_percent{host="Virtual Infrastructure",role="veeam_srv"} 2.83 1759694100000
vone_exporter_memory_available_bytes{host="vb365.jorgedelacruz.es",role="vbm_srv"} 10170457833 1759694100000
vone_exporter_memory_used_bytes{host="vb365.jorgedelacruz.es",role="vbm_srv"} 7009411351 1759694100000
vone_exporter_cpu_usage_percent{host="vb365.jorgedelacruz.es",role="vbm_srv"} 0.86 1759694100000
vone_exporter_net_bytes_total_per_sec{host="vb365.jorgedelacruz.es",role="vbm_srv",iface="vmxnet3 Ethernet Adapter"} 14697 1759694100000
vone_exporter_net_bytes_received_per_sec{host="vb365.jorgedelacruz.es",role="vbm_srv",iface="vmxnet3 Ethernet Adapter"} 1331 1759694100000
vone_exporter_net_bytes_sent_per_sec{host="vb365.jorgedelacruz.es",role="vbm_srv",iface="vmxnet3 Ethernet Adapter"} 13365 1759694100000
vone_exporter_disk_read_bytes_per_sec{host="vb365.jorgedelacruz.es",role="vbm_srv",disk="C:"} 5 1759694100000
vone_exporter_disk_write_bytes_per_sec{host="vb365.jorgedelacruz.es",role="vbm_srv",disk="C:"} 151686 1759694100000
vone_exporter_disk_bytes_per_sec{host="vb365.jorgedelacruz.es",role="vbm_srv",disk="C:"} 151691 1759694100000
vone_exporter_disk_read_bytes_per_sec{host="vb365.jorgedelacruz.es",role="vbm_srv",disk="E:"} 0 1759694100000
vone_exporter_disk_write_bytes_per_sec{host="vb365.jorgedelacruz.es",role="vbm_srv",disk="E:"} 0 1759694100000
vone_exporter_disk_bytes_per_sec{host="vb365.jorgedelacruz.es",role="vbm_srv",disk="E:"} 0 1759694100000
vone_exporter_disk_read_bytes_per_sec{host="vb365.jorgedelacruz.es",role="vbm_srv",disk="HarddiskVolume1"} 0 1759694100000
vone_exporter_disk_write_bytes_per_sec{host="vb365.jorgedelacruz.es",role="vbm_srv",disk="HarddiskVolume1"} 0 1759694100000
vone_exporter_disk_bytes_per_sec{host="vb365.jorgedelacruz.es",role="vbm_srv",disk="HarddiskVolume1"} 0 1759694100000
vone_exporter_cpu_usage_percent{host="vb365.jorgedelacruz.es",role="vbm_prx"} 0.86 1759694100000
vone_exporter_memory_available_bytes{host="vb365.jorgedelacruz.es",role="vbm_prx"} 10170457833 1759694100000
vone_exporter_memory_used_bytes{host="vb365.jorgedelacruz.es",role="vbm_prx"} 7009411351 1759694100000
vone_exporter_memory_usage_percent{host="vb365.jorgedelacruz.es",role="vbm_prx"} 41 1759694100000
vone_exporter_disk_read_bytes_per_sec{host="vb365.jorgedelacruz.es",role="vbm_prx",disk="C:"} 5 1759694100000
vone_exporter_disk_write_bytes_per_sec{host="vb365.jorgedelacruz.es",role="vbm_prx",disk="C:"} 151686 1759694100000
vone_exporter_disk_bytes_per_sec{host="vb365.jorgedelacruz.es",role="vbm_prx",disk="C:"} 151691 1759694100000
vone_exporter_disk_read_bytes_per_sec{host="vb365.jorgedelacruz.es",role="vbm_prx",disk="E:"} 0 1759694100000
vone_exporter_disk_write_bytes_per_sec{host="vb365.jorgedelacruz.es",role="vbm_prx",disk="E:"} 0 1759694100000
vone_exporter_disk_bytes_per_sec{host="vb365.jorgedelacruz.es",role="vbm_prx",disk="E:"} 0 1759694100000
vone_exporter_disk_read_bytes_per_sec{host="vb365.jorgedelacruz.es",role="vbm_prx",disk="HarddiskVolume1"} 0 1759694100000
vone_exporter_disk_write_bytes_per_sec{host="vb365.jorgedelacruz.es",role="vbm_prx",disk="HarddiskVolume1"} 0 1759694100000
vone_exporter_disk_bytes_per_sec{host="vb365.jorgedelacruz.es",role="vbm_prx",disk="HarddiskVolume1"} 0 1759694100000
vone_exporter_net_bytes_total_per_sec{host="vb365.jorgedelacruz.es",role="vbm_prx",iface="vmxnet3 Ethernet Adapter"} 14697 1759694100000
vone_exporter_net_bytes_received_per_sec{host="vb365.jorgedelacruz.es",role="vbm_prx",iface="vmxnet3 Ethernet Adapter"} 1331 1759694100000
vone_exporter_net_bytes_sent_per_sec{host="vb365.jorgedelacruz.es",role="vbm_prx",iface="vmxnet3 Ethernet Adapter"} 13365 1759694100000
vone_exporter_memory_available_bytes{host="veeam-vbr.jorgedelacruz.es",role="serv"} 2644148869 1759694100000
vone_exporter_memory_used_bytes{host="veeam-vbr.jorgedelacruz.es",role="serv"} 10239712635 1759694100000
vone_exporter_disk_bytes_per_sec{host="veeam-vbr.jorgedelacruz.es",role="serv",disk="4"} 0 1759694100000
vone_exporter_net_bytes_sent_per_sec{host="veeam-vbr.jorgedelacruz.es",role="serv",iface="vmxnet3 Ethernet Adapter"} 4136 1759694100000
vone_exporter_net_bytes_sent_per_sec{host="veeam-vbr.jorgedelacruz.es",role="serv",iface="vmxnet3 Ethernet Adapter _2"} 0 1759694100000
vone_exporter_net_bytes_sent_per_sec{host="veeam-vbr.jorgedelacruz.es",role="serv"} 4136 1759694100000
vone_exporter_disk_bytes_per_sec{host="veeam-vbr.jorgedelacruz.es",role="serv",disk="0 C:"} 13263602 1759694100000
vone_exporter_disk_bytes_per_sec{host="veeam-vbr.jorgedelacruz.es",role="serv",disk="1 F:"} 0 1759694100000
vone_exporter_disk_bytes_per_sec{host="veeam-vbr.jorgedelacruz.es",role="serv",disk="2"} 0 1759694100000
vone_exporter_disk_bytes_per_sec{host="veeam-vbr.jorgedelacruz.es",role="serv",disk="3"} 0 1759694100000
vone_exporter_disk_bytes_per_sec{host="veeam-vbr.jorgedelacruz.es",role="serv"} 13263602 1759694100000
vone_exporter_cpu_usage_percent{host="veeam-vbr.jorgedelacruz.es",role="serv"} 27 1759694100000
vone_exporter_disk_bytes_per_sec{host="veeam-vbr.jorgedelacruz.es",role="rep"} 0 1759694100000
vone_exporter_disk_bytes_per_sec{host="veeam-vbr.jorgedelacruz.es",role="rep"} 0 1759694100000
vone_exporter_memory_used_bytes{host="veeam-vbr.jorgedelacruz.es",role="prx"} 10239712635 1759694100000
vone_exporter_memory_available_bytes{host="veeam-vbr.jorgedelacruz.es",role="prx"} 2644148869 1759694100000
vone_exporter_net_bytes_sent_per_sec{host="veeam-vbr.jorgedelacruz.es",role="rep",iface="vmxnet3 Ethernet Adapter"} 4136 1759694100000
vone_exporter_disk_bytes_per_sec{host="veeam-vbr.jorgedelacruz.es",role="prx",disk="4"} 0 1759694100000
vone_exporter_cpu_usage_percent{host="veeam-vbr.jorgedelacruz.es",role="prx"} 27 1759694100000
vone_exporter_net_bytes_sent_per_sec{host="veeam-vbr.jorgedelacruz.es",role="prx",iface="vmxnet3 Ethernet Adapter"} 4136 1759694100000
vone_exporter_net_bytes_sent_per_sec{host="veeam-vbr.jorgedelacruz.es",role="prx",iface="vmxnet3 Ethernet Adapter _2"} 0 1759694100000
vone_exporter_disk_bytes_per_sec{host="veeam-vbr.jorgedelacruz.es",role="prx",disk="0 C:"} 13263602 1759694100000
vone_exporter_net_bytes_sent_per_sec{host="veeam-vbr.jorgedelacruz.es",role="prx"} 4136 1759694100000
vone_exporter_memory_used_bytes{host="veeam-vbr.jorgedelacruz.es",role="rep"} 10239712635 1759694100000
vone_exporter_memory_available_bytes{host="veeam-vbr.jorgedelacruz.es",role="rep"} 2644148869 1759694100000
vone_exporter_disk_bytes_per_sec{host="veeam-vbr.jorgedelacruz.es",role="prx",disk="2"} 0 1759694100000
vone_exporter_disk_bytes_per_sec{host="veeam-vbr.jorgedelacruz.es",role="prx",disk="1 F:"} 0 1759694100000
vone_exporter_disk_bytes_per_sec{host="veeam-vbr.jorgedelacruz.es",role="prx",disk="3"} 0 1759694100000
vone_exporter_disk_bytes_per_sec{host="veeam-vbr.jorgedelacruz.es",role="prx"} 13263602 1759694100000
vone_exporter_net_bytes_sent_per_sec{host="veeam-vbr.jorgedelacruz.es",role="rep",iface="vmxnet3 Ethernet Adapter"} 4136 1759694100000
vone_exporter_net_bytes_sent_per_sec{host="veeam-vbr.jorgedelacruz.es",role="rep",iface="vmxnet3 Ethernet Adapter _2"} 0 1759694100000
vone_exporter_cpu_usage_percent{host="veeam-vbr.jorgedelacruz.es",role="rep"} 27 1759694100000
vone_exporter_net_bytes_sent_per_sec{host="veeam-vbr.jorgedelacruz.es",role="rep"} 4136 1759694100000
vone_exporter_memory_used_bytes{host="veeam-vbr.jorgedelacruz.es",role="rep"} 10239712635 1759694100000
vone_exporter_memory_available_bytes{host="veeam-vbr.jorgedelacruz.es",role="rep"} 2644148869 1759694100000
vone_exporter_cpu_usage_percent{host="veeam-vbr.jorgedelacruz.es",role="rep"} 27 1759694100000
vone_exporter_net_bytes_sent_per_sec{host="veeam-vbr.jorgedelacruz.es",role="rep",iface="vmxnet3 Ethernet Adapter _2"} 0 1759694100000
vone_exporter_net_bytes_sent_per_sec{host="veeam-vbr.jorgedelacruz.es",role="rep"} 4136 1759694100000
vone_exporter_memory_available_bytes{host="vbr-v13.jorgedelacruz.es",role="serv"} 8111682124 1759694100000
vone_exporter_memory_used_bytes{host="vbr-v13.jorgedelacruz.es",role="serv"} 8647048628 1759694100000
vone_exporter_net_bytes_sent_per_sec{host="vbr-v13.jorgedelacruz.es",role="serv",iface="ens33"} 453 1759694100000
vone_exporter_net_bytes_sent_per_sec{host="vbr-v13.jorgedelacruz.es",role="serv"} 453 1759694100000
vone_exporter_disk_bytes_per_sec{host="vbr-v13.jorgedelacruz.es",role="serv",disk="sda"} 64550 1759694100000
vone_exporter_disk_bytes_per_sec{host="vbr-v13.jorgedelacruz.es",role="serv",disk="sdb"} 709894 1759694100000
vone_exporter_disk_bytes_per_sec{host="vbr-v13.jorgedelacruz.es",role="serv"} 774444 1759694100000
vone_exporter_cpu_usage_percent{host="vbr-v13.jorgedelacruz.es",role="serv"} 3 1759694100000
vone_exporter_memory_used_bytes{host="vbr-v13.jorgedelacruz.es",role="prx"} 8647048628 1759694100000
vone_exporter_memory_available_bytes{host="vbr-v13.jorgedelacruz.es",role="prx"} 8111682124 1759694100000
vone_exporter_memory_used_bytes{host="vbr-v13.jorgedelacruz.es",role="prx"} 8647048628 1759694100000
vone_exporter_memory_available_bytes{host="vbr-v13.jorgedelacruz.es",role="prx"} 8111682124 1759694100000
vone_exporter_net_bytes_sent_per_sec{host="vbr-v13.jorgedelacruz.es",role="prx",iface="ens33"} 453 1759694100000
vone_exporter_disk_bytes_per_sec{host="vbr-v13.jorgedelacruz.es",role="prx",disk="sdb"} 709894 1759694100000
vone_exporter_net_bytes_sent_per_sec{host="vbr-v13.jorgedelacruz.es",role="prx"} 453 1759694100000
vone_exporter_disk_bytes_per_sec{host="vbr-v13.jorgedelacruz.es",role="prx",disk="sda"} 64550 1759694100000
vone_exporter_disk_bytes_per_sec{host="vbr-v13.jorgedelacruz.es",role="prx",disk="sdb"} 709894 1759694100000
vone_exporter_disk_bytes_per_sec{host="vbr-v13.jorgedelacruz.es",role="prx"} 774444 1759694100000
vone_exporter_disk_bytes_per_sec{host="vbr-v13.jorgedelacruz.es",role="prx"} 774444 1759694100000
vone_exporter_cpu_usage_percent{host="vbr-v13.jorgedelacruz.es",role="prx"} 3 1759694100000
vone_exporter_net_bytes_sent_per_sec{host="vbr-v13.jorgedelacruz.es",role="prx",iface="ens33"} 453 1759694100000
vone_exporter_net_bytes_sent_per_sec{host="vbr-v13.jorgedelacruz.es",role="prx"} 453 1759694100000
vone_exporter_disk_bytes_per_sec{host="vbr-v13.jorgedelacruz.es",role="prx",disk="sda"} 64550 1759694100000
vone_exporter_cpu_usage_percent{host="vbr-v13.jorgedelacruz.es",role="prx"} 3 1759694100000
Success! Now there is one more step, collecting this node exporter data somehow.
Collecting data with Telegraf
My favourite data collector is telegraf, it has hundreds of inputs ready to collect, and as the .exe produces the output data as prometheus, we can just add this to out inputs configuration:
[[inputs.prometheus]]
  urls = ["http://127.0.0.1:9108/metrics"]
  metric_version = 2
  name_override = "vone_exporter"
Assuming once again, we have all in one box, Veeam ONE, the SQL, node exporter connecting and exposing the data, and finally telegraf collecting it.
Grafana Dashboards
I created a Dashboard from scratch by selecting the best requests to the database, finishing off colors, thinking about graphics, and how to display them, and everything is automated so that it fits our environment without any problem and without having to edit anything manually. The Dashboard can be found here, once imported, you can filter by model and time:
- https://grafana.com/grafana/dashboards/24212
- Also it can be downloaded from here.
Import Grafana Dashboards easily
I have already a wonderful Dashboard, ready just for you with everything you need to monitor our environment in a very simple way. Select the name you want and enter the ID: 22867, which is the unique ID of the Dashboard, or the URL:
 With the menus above you can display and adjust the Dashboard to your different choices:
I hope you like it, and I would like to leave you the complete series here, so you can start playing with the plugins that I have been telling you about all these years:
- Looking for the Perfect Dashboard: InfluxDB, Telegraf, and Grafana – Part I (Installing InfluxDB, Telegraf, and Grafana on Ubuntu 20.04 LTS)
- En busca del Dashboard perfecto: InfluxDB, Telegraf y Grafana – Parte II (Instalar agente Telegraf en Nodos remotos Linux)
- En busca del Dashboard perfecto: InfluxDB, Telegraf y Grafana – Parte III Integración con PRTG
- En busca del Dashboard perfecto: InfluxDB, Telegraf y Grafana – Parte IV (Instalar agente Telegraf en Nodos remotos Windows)
- En busca del Dashboard perfecto: InfluxDB, Telegraf y Grafana – Parte V (Activar inputs específicos, Red, MySQL/MariaDB, Nginx)
- En busca del Dashboard perfecto: InfluxDB, Telegraf y Grafana – Parte VI (Monitorizando Veeam)
- En busca del Dashboard perfecto: InfluxDB, Telegraf y Grafana – Parte VII (Monitorizar vSphere)
- En busca del Dashboard perfecto: InfluxDB, Telegraf y Grafana – Parte VIII (Monitorizando Veeam con Enterprise Manager)
- En busca del Dashboard perfecto: InfluxDB, Telegraf y Grafana – Parte IX (Monitorizando Zimbra Collaboration)
- En busca del Dashboard perfecto: InfluxDB, Telegraf y Grafana – Parte X (Grafana Plugins)
- En busca del Dashboard perfecto: InfluxDB, Telegraf y Grafana – Parte XI – (Monitorizando URL e IPS con Telegraf y Ping)
- Looking for the Perfect Dashboard: InfluxDB, Telegraf, and Grafana – Part XII (Native Telegraf Plugin for vSphere)
- Looking for the Perfect Dashboard: InfluxDB, Telegraf, and Grafana – Part XIII (Veeam Backup for Microsoft Office 365 v4)
- Looking for the Perfect Dashboard: InfluxDB, Telegraf, and Grafana – Part XIV – Veeam Availability Console
- Looking for the Perfect Dashboard: InfluxDB, Telegraf, and Grafana – Part XV (IPMI Monitoring of our ESXi Hosts)
- Looking for Perfect Dashboard: InfluxDB, Telegraf, and Grafana – Part XVI (Performance and Advanced Security of Veeam Backup for Microsoft Office 365)
- Looking for the Perfect Dashboard: InfluxDB, Telegraf, and Grafana – Part XVII (Showing Dashboards on Two Monitors Using Raspberry Pi 4)
- En busca del Dashboard perfecto: InfluxDB, Telegraf y Grafana – Parte XVIII – Monitorizar temperatura y estado de Raspberry Pi 4
- Looking for the Perfect Dashboard: InfluxDB, Telegraf, and Grafana – Part XIX (Monitoring Veeam with Enterprise Manager) Shell Script
- Looking for the Perfect Dashboard: InfluxDB, Telegraf, and Grafana – Part XXIV (Monitoring Veeam Backup for Microsoft Azure)
- Looking for the Perfect Dashboard: InfluxDB, Telegraf, and Grafana – Part XXV (Monitoring Power Consumption)
- Looking for the Perfect Dashboard: InfluxDB, Telegraf, and Grafana – Part XXVI (Monitoring Veeam Backup for Nutanix)
- Looking for the Perfect Dashboard: InfluxDB, Telegraf, and Grafana – Part XXVII (Monitoring ReFS and XFS (block-cloning and reflink)
- Looking for the Perfect Dashboard: InfluxDB, Telegraf, and Grafana – Part XXVIII (Monitoring HPE StoreOnce)
- Looking for the Perfect Dashboard: InfluxDB, Telegraf, and Grafana – Part XXIX (Monitoring Pi-hole)
- Looking for the Perfect Dashboard: InfluxDB, Telegraf, and Grafana – Part XXIX (Monitoring Veeam Backup for AWS)
- Looking for the Perfect Dashboard: InfluxDB, Telegraf, and Grafana – Part XXXI (Monitoring Unifi Protect)
- Looking for the Perfect Dashboard: InfluxDB, Telegraf, and Grafana – Part XXXII (Monitoring Veeam ONE – experimental)
- Looking for the Perfect Dashboard: InfluxDB, Telegraf, and Grafana – Part XXXIII (Monitoring NetApp ONTAP)
- Looking for the Perfect Dashboard: InfluxDB, Telegraf, and Grafana – Part XXXIV (Monitoring Runecast)
- Looking for the Perfect Dashboard: InfluxDB, Telegraf, and Grafana – Part XXXV (GPU Monitoring)
- Looking for the Perfect Dashboard: InfluxDB, Telegraf, and Grafana – Part XXXVI (Monitoring Goldshell Miners – JSONv2)
- Looking for the Perfect Dashboard: InfluxDB, Telegraf, and Grafana – Part XXXVII (Monitoring Veeam Backup for Google Cloud Platform)
- En Busca del Dashboard perfecto: InfluxDB, Telegraf y Grafana – Parte XXXVIII (Monitorizando Temperatura y Humedad con Xiaomi Mijia)
- Looking for the Perfect Dashboard: InfluxDB, Telegraf, and Grafana – Part XL (Veeam Backup for Microsoft 365 – Restore Audit)
- Looking for the Perfect Dashboard: InfluxDB, Telegraf, and Grafana – Part XLI (Veeam Backup for Salesforce)
- Looking for the Perfect Dashboard: InfluxDB, Telegraf, and Grafana – Part XLII (Veeam ONE v12 Audit Events)
- Looking for the Perfect Dashboard: InfluxDB, Telegraf, and Grafana – Part XLIII (Monitoring QNAP using SNMP v3)
- Looking for the Perfect Dashboard: InfluxDB, Telegraf, and Grafana – Part XLIV (Monitoring Veeam Backup & Replication API)
- Looking for the Perfect Dashboard: InfluxDB, Telegraf, and Grafana – Part XLV (Monitoring Synology using SNMP v3)
- Looking for the Perfect Dashboard: InfluxDB, Telegraf, and Grafana – Part XLVI (Monitoring NVIDIA Jetson Nano)
- Looking for the Perfect Dashboard: InfluxDB, Telegraf, and Grafana – Part XLVII (Monitoring Open WebUI)
- Looking for the Perfect Dashboard: InfluxDB, Telegraf, and Grafana – Part XLVIII (Monitoring Veeam Data Platform Advanced)
- Looking for the Perfect Dashboard: InfluxDB, Telegraf, and Grafana – Part XLIX (Monitoring Unofficial Veeam ONE Node Exporter)
Leave a Reply