
 Greetings friends, I have been telling you about the first steps with Veeam ONE in previous posts, today I come to show you how to connect to our Veeam Backup & Replication environment so that Veeam ONE can collect from there all the metrics of the jobs, protected VMs, Agents, etc.
Adding a Veeam Backup & Replication Infrastructure to Veeam ONE
The first thing we’ll do is open the Veeam ONE Monitor with a user with admin privileges in Veeam Backup & Replication, in the Data Protection View, we’ll click Add Server: Select the type of server you want to add, in our case the Veeam Backup and Replication Server type:
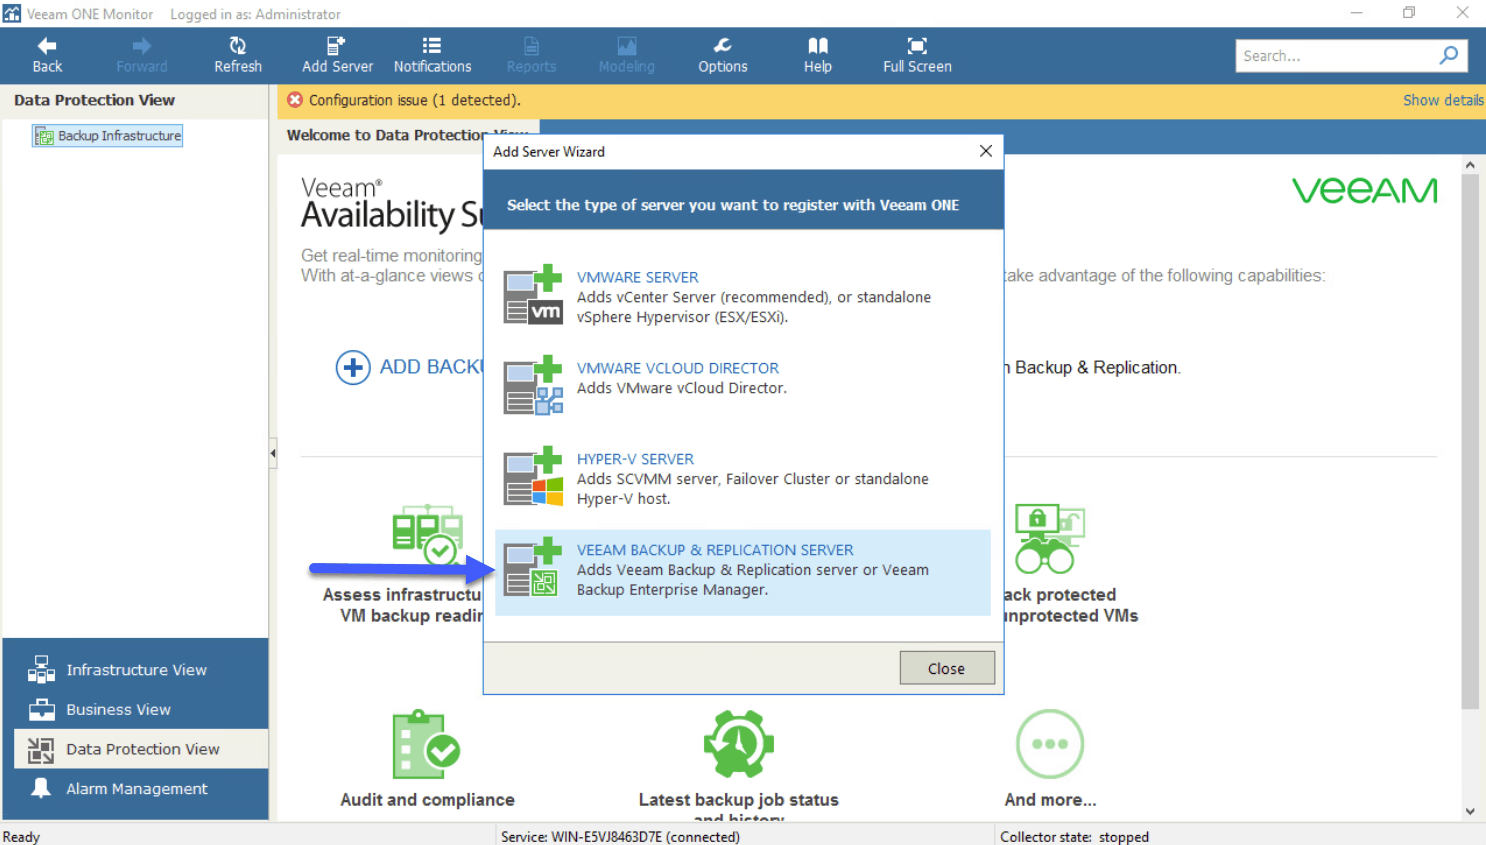 We will add the IP or FQDN of our Veeam Backup & Replication or Enterprise Manager Server, also we will select if we want to install the Veeam ONE Agent or not, which will serve to apply best practices to the components of Veeam:
 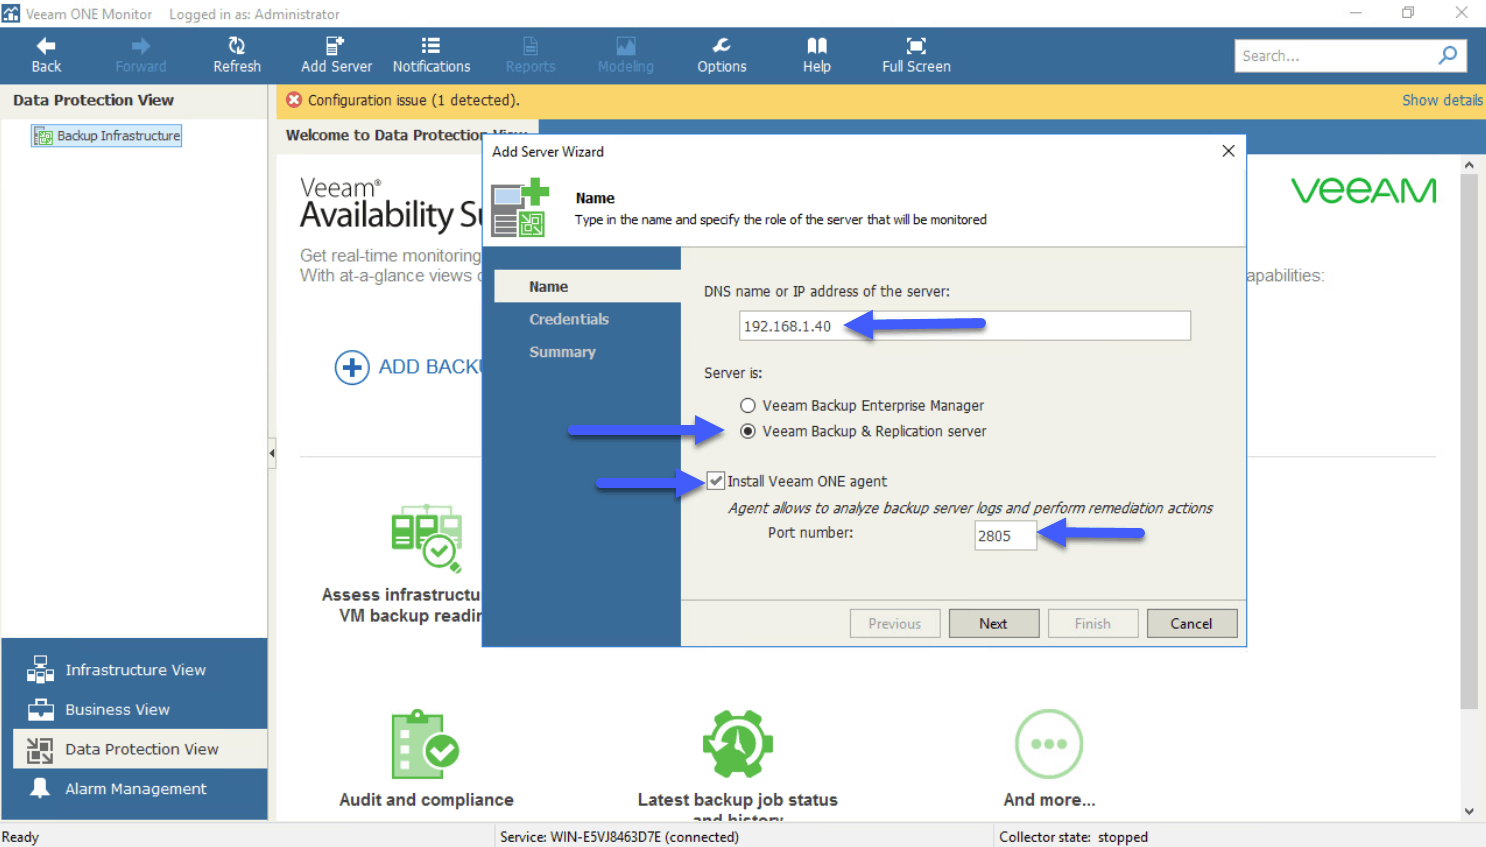 We will introduce a user with privileges within Veeam Backup & Replication so we can collect metrics:
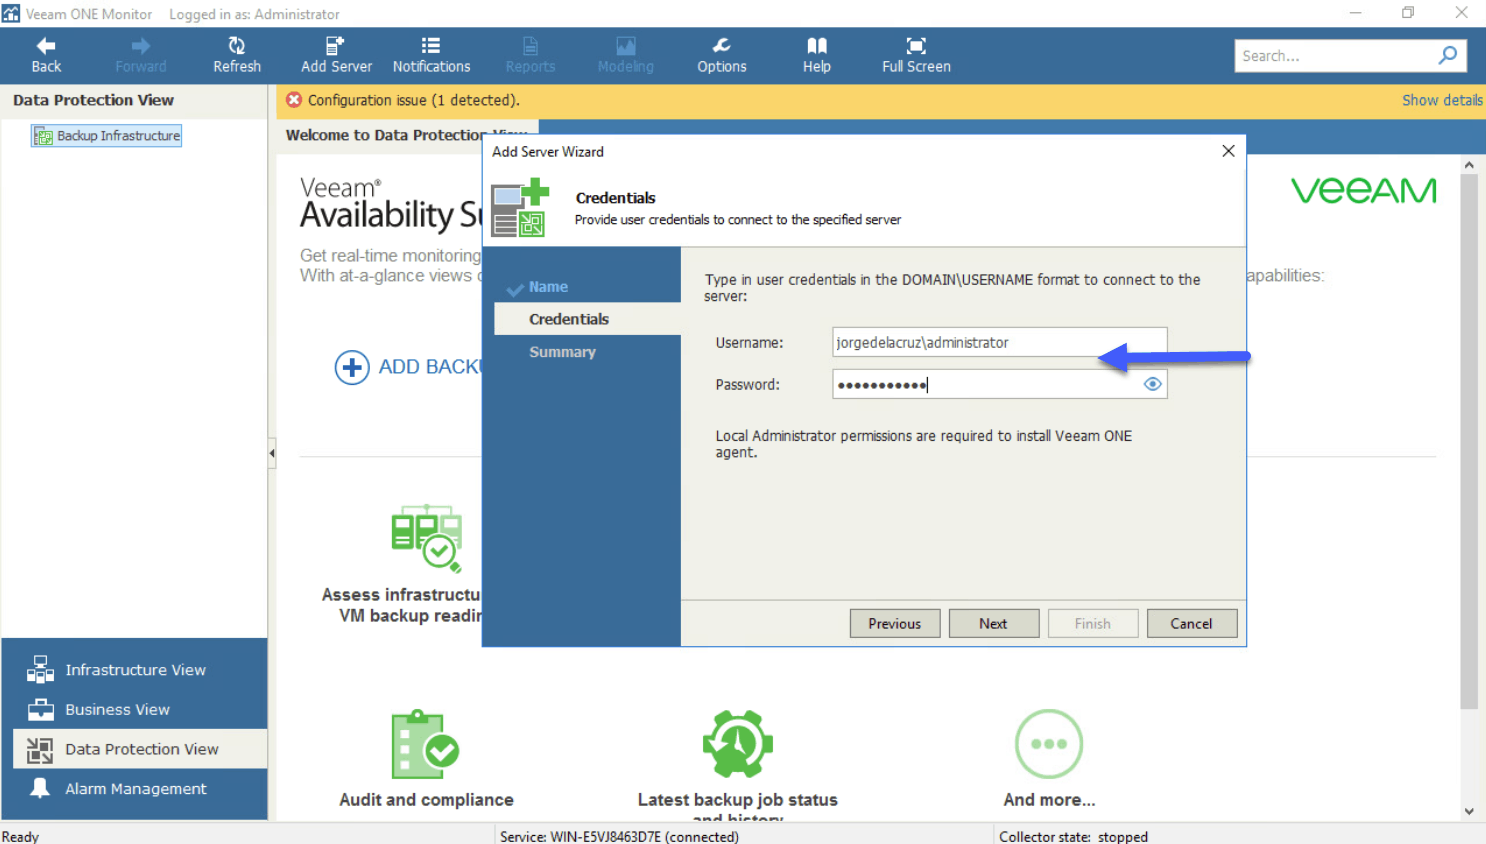 If everything went well and the credentials work, we’ll see the following:
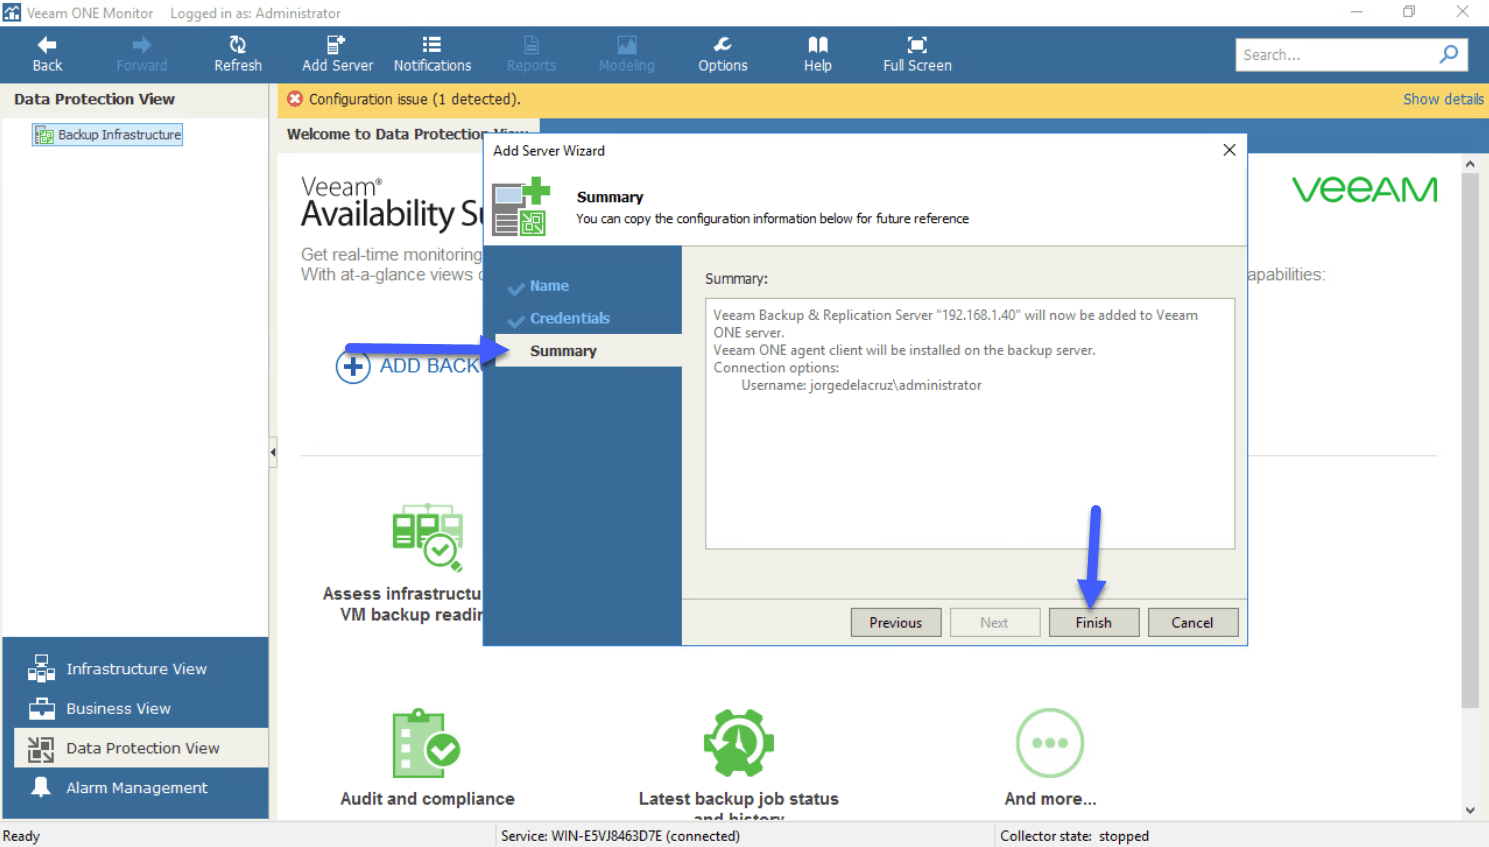 After a few seconds we can start seeing the state of our proxies, repos and more:
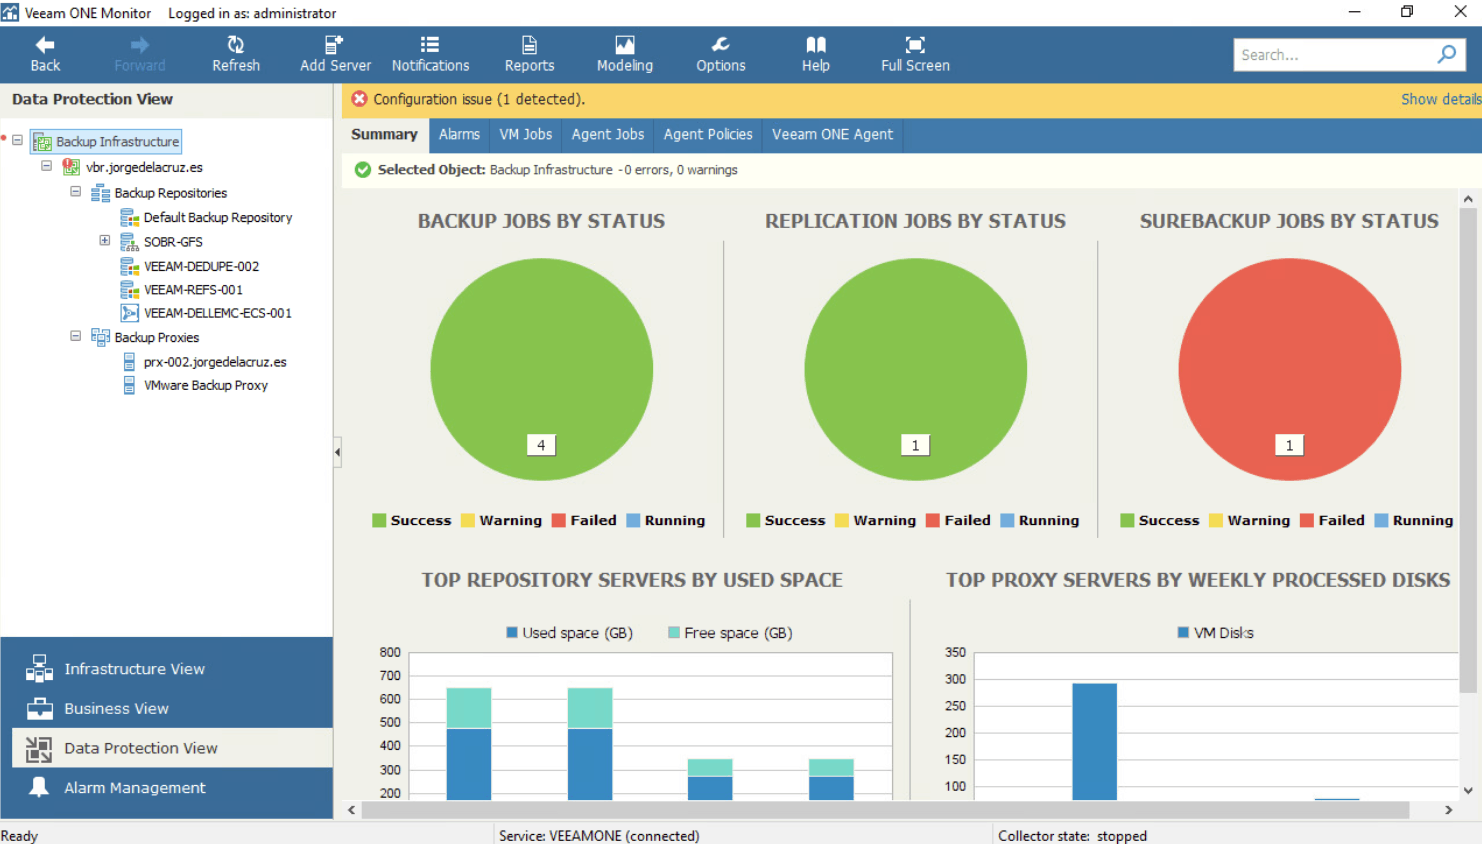
A quick overview of Veeam ONE Monitor with an associated Veeam Backup & Replication environment
Although we will see how to do troubleshooting later, I want to show you the fastest way to see consumption with Veeam ONE Monitor, for example, the view of all the Jobs: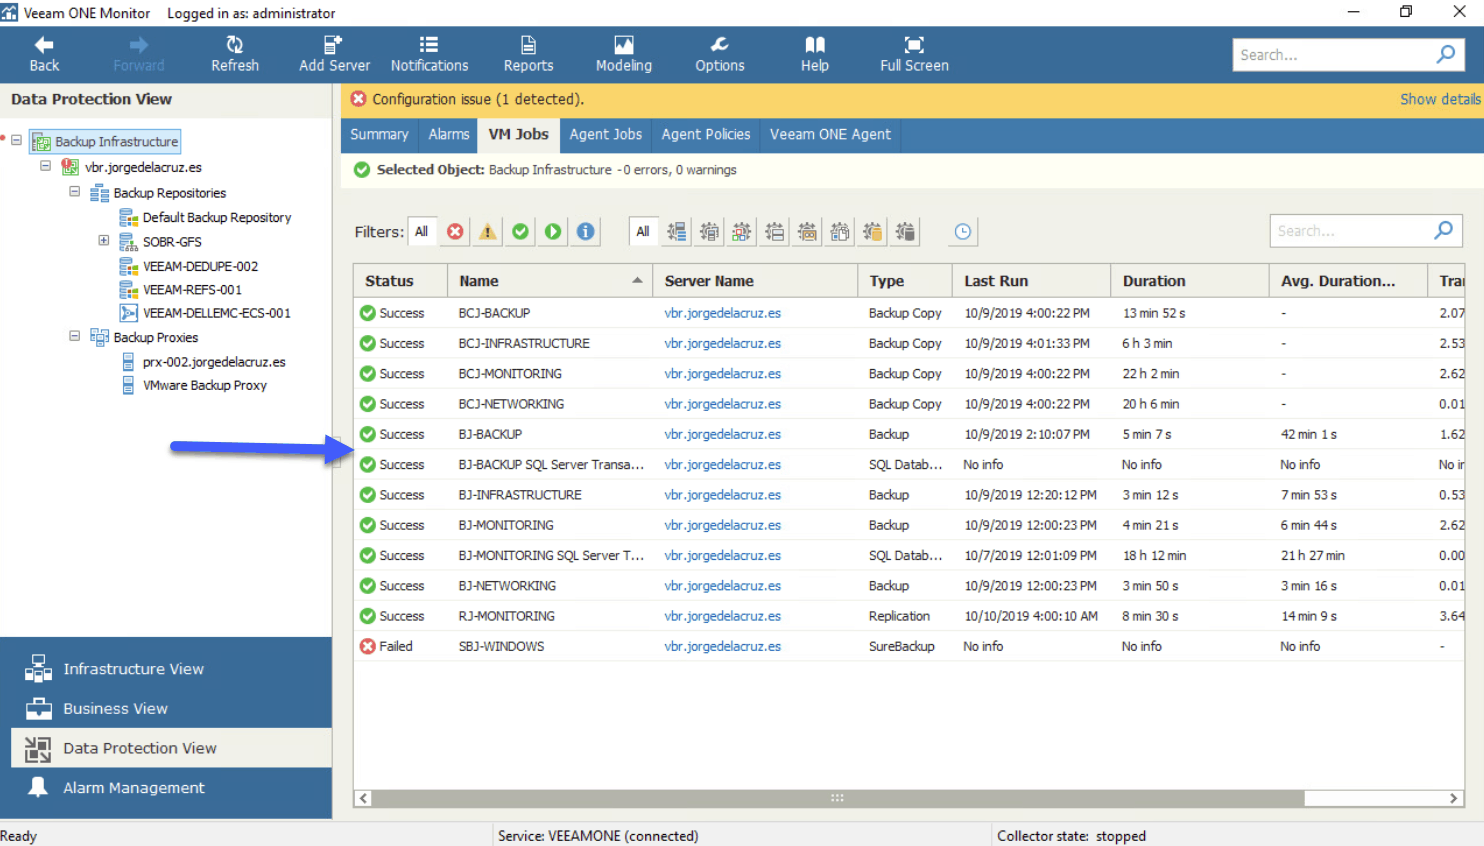 Or, for example, a quick look at one of my most used Backup Repositories:
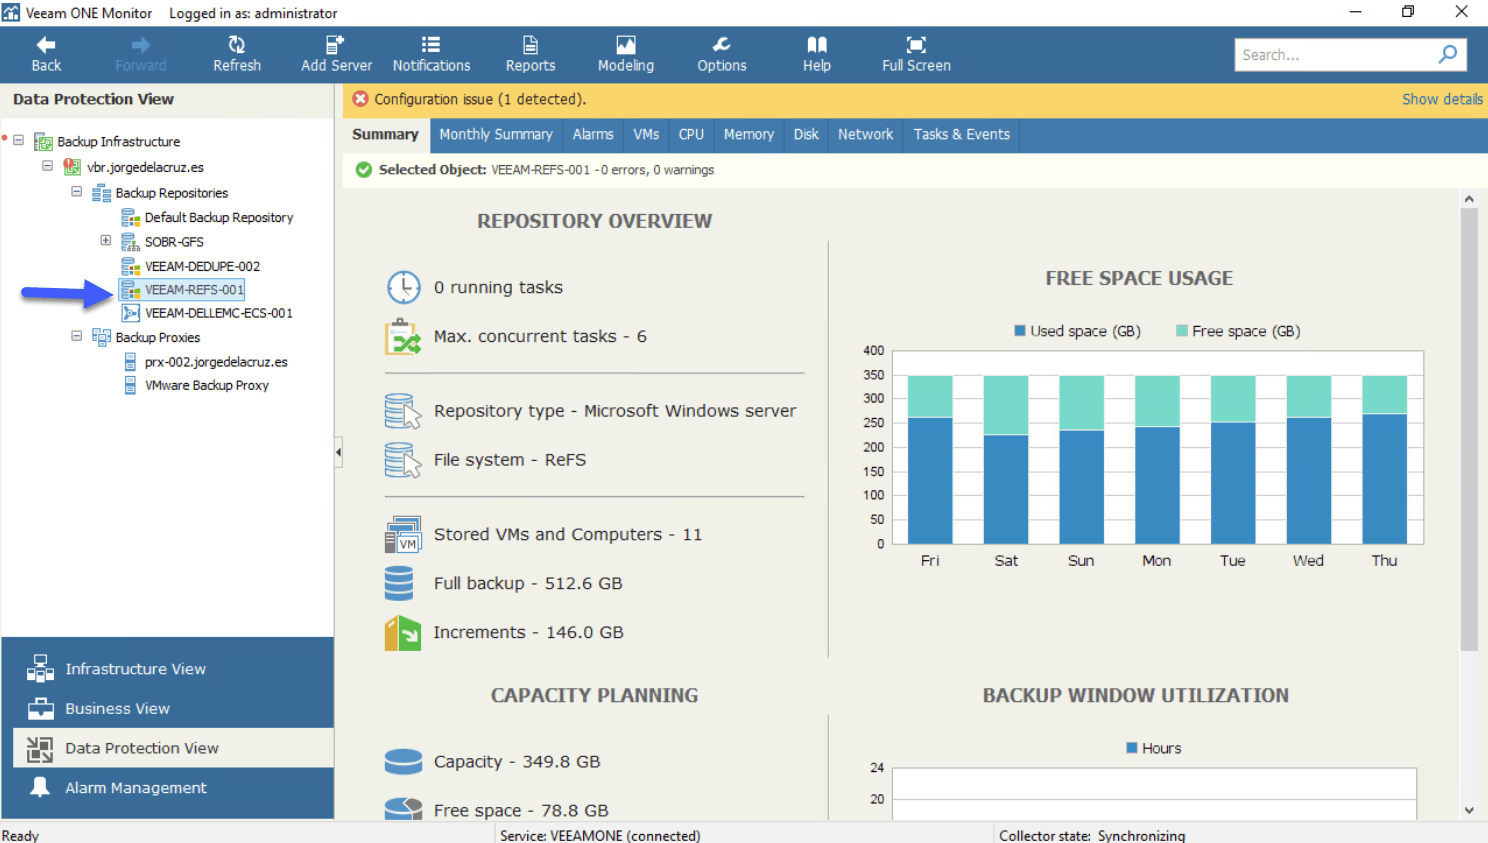 I leave you the list of all the articles that correspond to this interesting series about Veeam ONE as our monitoring and reporting system:
- Looking for the Perfect Dashboard: Veeam ONE – Part I – Introduction to Veeam ONE
- Looking for the Perfect Dashboard: Veeam ONE – Part II – Download and Install Veeam ONE
- Looking for the Perfect Dashboard: Veeam ONE – Part III – Adding a VMware vSphere Infrastructure to Veeam ONE
- Looking for the Perfect Dashboard: Veeam ONE – Part IV – Adding a Veeam Backup and Replication Infrastructure to Veeam ONE
- Looking for the Perfect Dashboard: Veeam ONE – Part V – Troubleshooting vSphere using Veeam ONE Monitor
- Looking for the Perfect Dashboard: Veeam ONE – Part VI – Troubleshooting Veeam Backup and Replication using Veeam ONE Monitor
- Looking for the Perfect Dashboard: Veeam ONE – Part VII – Dashboards at a Glance in the Veeam ONE Reporter
- Looking for the Perfect Dashboard: Veeam ONE – Part VIII – In-depth look at Reports in Veeam ONE Reporter
- Looking for the Perfect Dashboard: Veeam ONE – Part IX – Chargeback to create cost reports of our Infrastructure
Leave a Reply