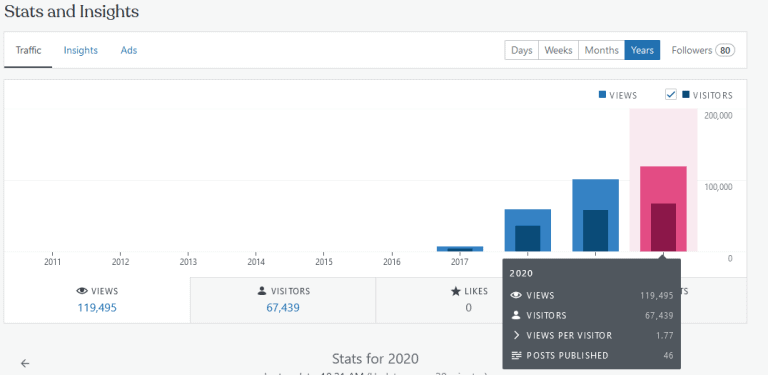
Greetings friends, like every year on the Spanish Blog, I like to show you the summary of numbers at the end of the year, articles, and so on, which in the end is simply the combined effort of you visiting this blog, and me writing the articles. Another year, another Christmas, and most likely for a lot of you it will be difficult or impossible
blog stats
The Blog in numbers, a look at mid 2021
Greetings friends, like every year on the Spanish Blog, I like to show you the summary of numbers at mid-term of the year, articles, and so on, which in the end is simply the combined effort of you visiting this blog, and me writing the articles. It's almost July! We are in the middle of the year, where have all these grey months gone? This year
The Blog in numbers, a look at 2020
Greetings friends, like every year on the Spanish Blog, I like to show you the summary of numbers, articles, and so on, which in the end is simply the combined effort of you visiting this blog, and me writing the articles. First of all, I would like to comment that it has been a very strange year, very complicated for all those who have lost not
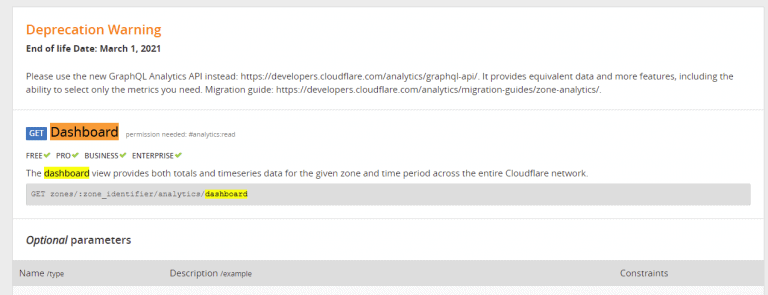
Looking for the Perfect Dashboard: InfluxDB, Telegraf, and Grafana – Part XXII (Monitoring Cloudflare, include beautiful Maps)
Greetings friends, since 2016 I have been showing you how to get the Perfect Dashboard using Grafana, InfluxDB, and Telegraf, we have come a long way together, and we have seen how to monitor a myriad of critical components, such as SSL, web page responses, VMware vSphere, Veeam, and much, much more. Today we return to the basics, exploring some


