 Greetings friends, the series on Microsoft Azure Blob comes to its last post, I hope you liked it and you find it useful when selecting an Object Storage for your Veeam Backups.
We still have this last entry about Microsoft Azure Blob monitoring with Grafana. Let’s go to it, after we follow all the steps we will be able to have a result like this: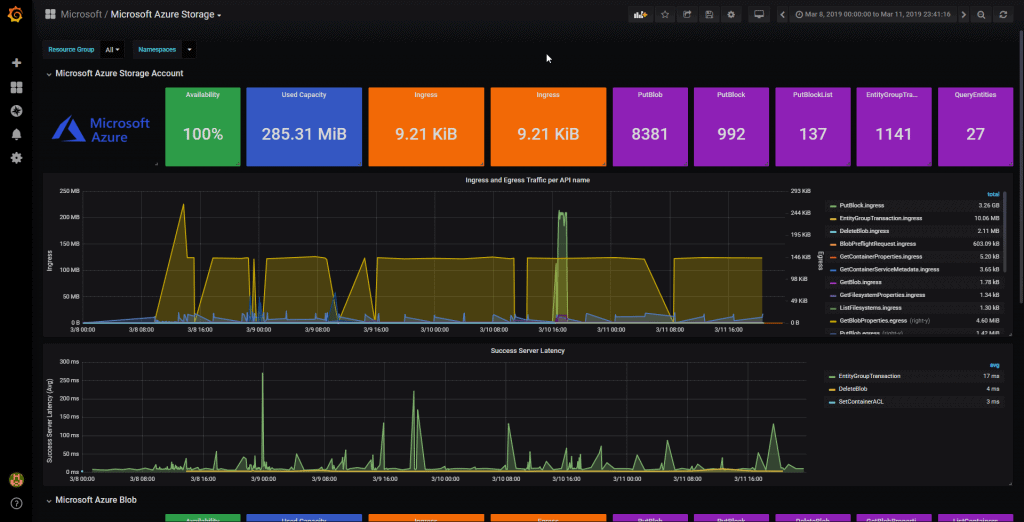
Enable the monitoring of our Storage accounts in Microsoft Azure Blob
The first step is to enable the monitoring of our Storage accounts in Microsoft Azure Blob, for it, we will do the following, from our Storage account, we will go to Monitoring – Classic, Diagnostic – Settings (classic), we have several options, such as the time we want to keep the metrics, as well as if we want to save these metrics in log format within the object storage, as well as if we want only hours or also include monitoring per minute: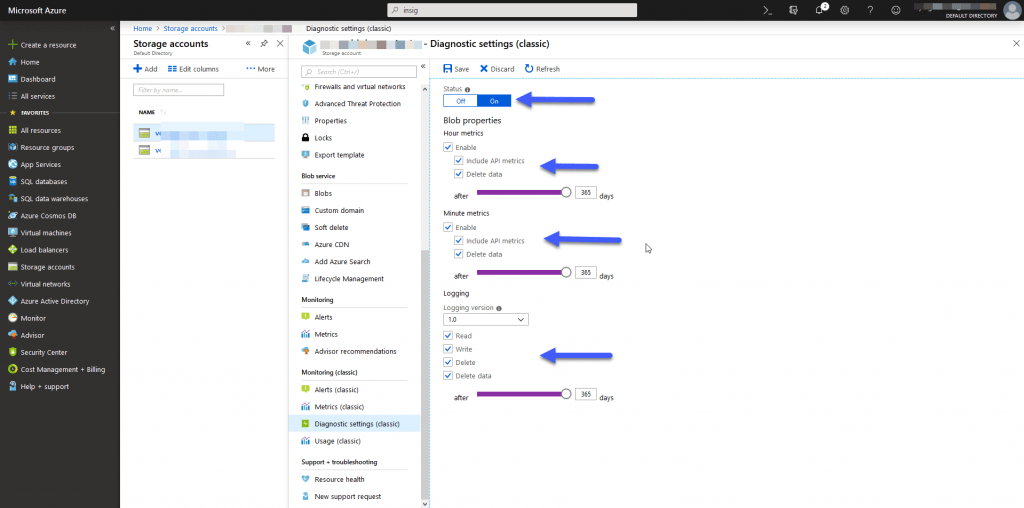
Azure Monitor available in Grafana since version 6.0
I already told you that one of the new funcionalities of Grafana 6.0, is that it includes new Data Source, and one of them is the long-awaited Azure Monitor, this means that Grafana will show us the information it receives directly from Azure Monitor, it does not go through InfluxDB or Telegraf, directly from Azure to Grafana.
If we go to our Data Source in Grafana, we can add a new Data Source from Azure Monitor: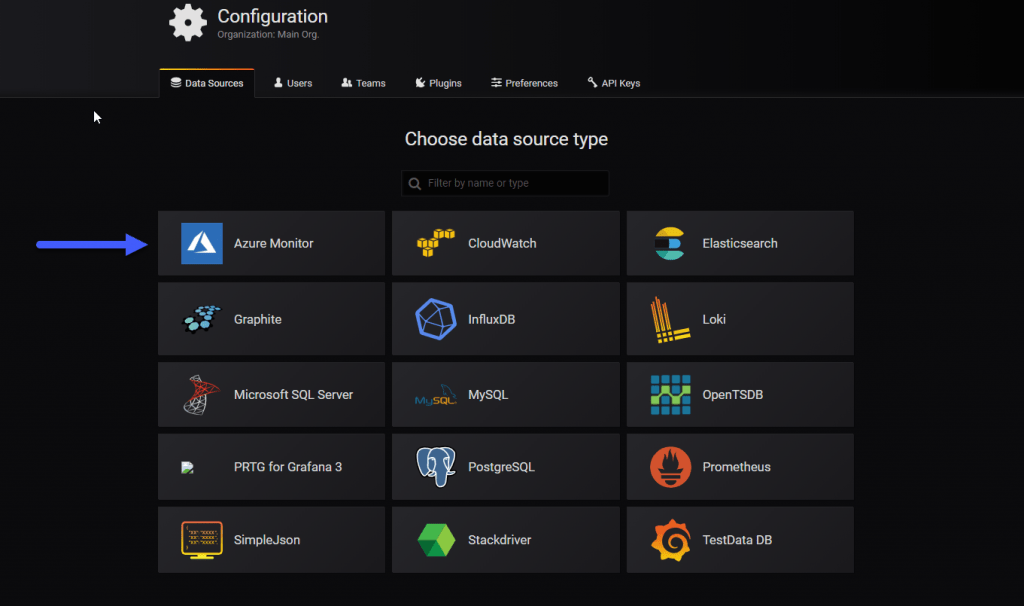
We will have to introduce the following ID of different resources of Microsoft Azure, can intimidate at first but it will not take more than 10 minutes at all: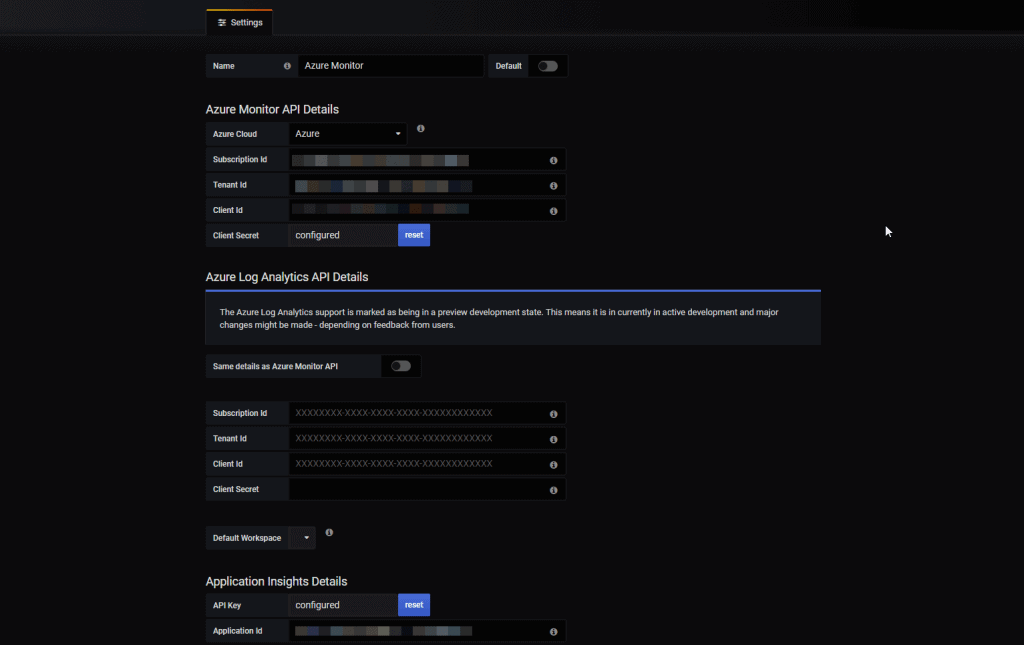
Let’s see step by step how to get each field to be able to fill everything and monitor satisfactorily.
Grafana and Azure Monitor Data Source – Subscription Id
To get the Subscription Id, it’s as simple as using the search above at all, or going to Home – Subscriptions, and there we’ll see the subscription we’re using, copy the Id:
Grafana and Azure Monitor Data Source – Tenant Id
To get the Tenant Id, we’ll have to go to Azure Active Directory (in case it’s not activated just do next – next and activate it), then we’ll go to properties and there we’ll be able to find the Id: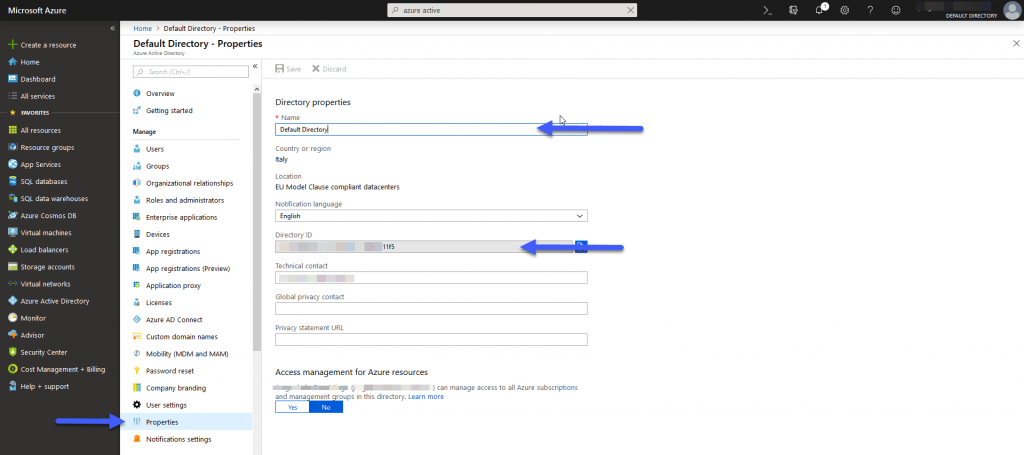
Grafana and Azure Monitor Data Source – Client Id
To get the Client Id, we’ll stay in Active Directory view, and click App Registrations:
It’s likely that we don’t have any, if so click on New application registration and fill in these three fields, if the URL is fake, put what you want:
Once we create the application we will have the Client Id: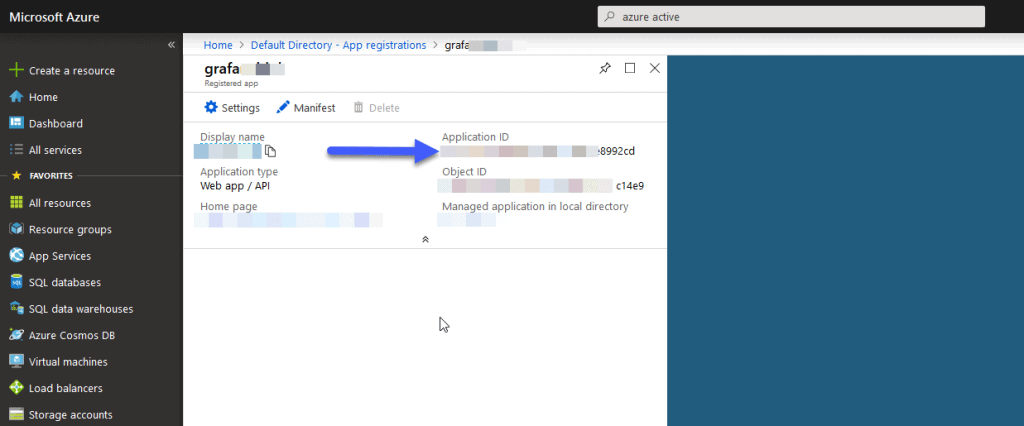
Grafana and Azure Monitor Data Source – Application Insight Details
To get the Application Insight Details, we’ll have to go to Application Insights, if we don’t have one, create it quickly:
We will now go to the settings, and we will go down until we see API key, where we will create a new one, this will be the Id we need back to Grafana: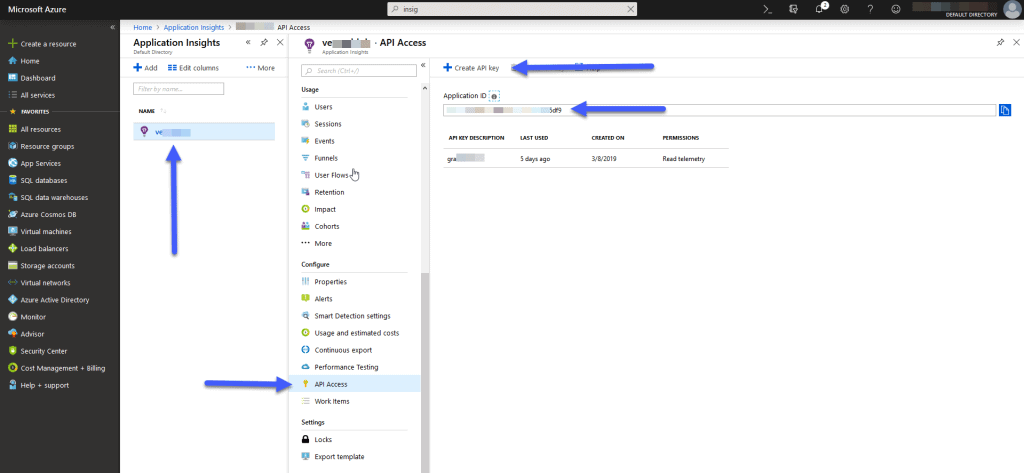
Back to Grafana, and with all the data we’ve got from Azure we’ll give Save/Test and we’ll have to see something similar to this:
Creating our Grafana Dashboard using Microsoft Azure Monitor as Data Source
As always, I already have the Dashboard ready for you to put it and work in a snap of fingers, we will go to Grafana and give it to create a new dashboard – import and enter the URL or Dashboard ID https://grafana.com/dashboards/9962 or 9962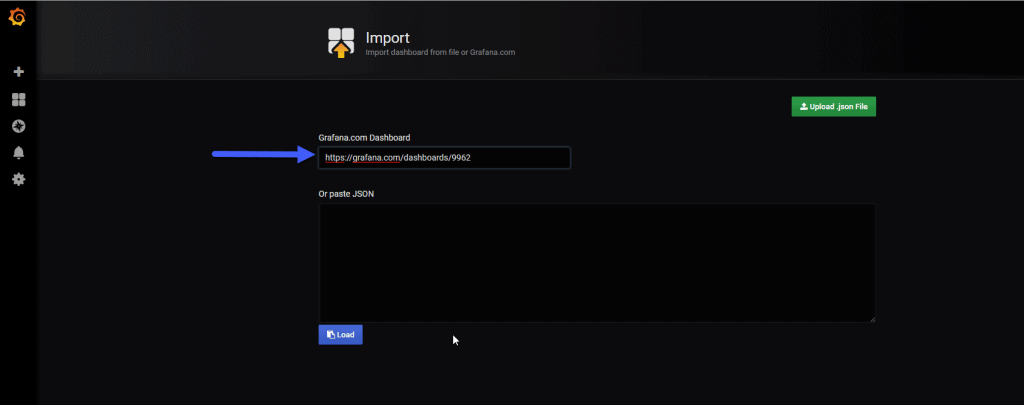
This will auto-complete us and we will be able to give this new Dashboard a name we want: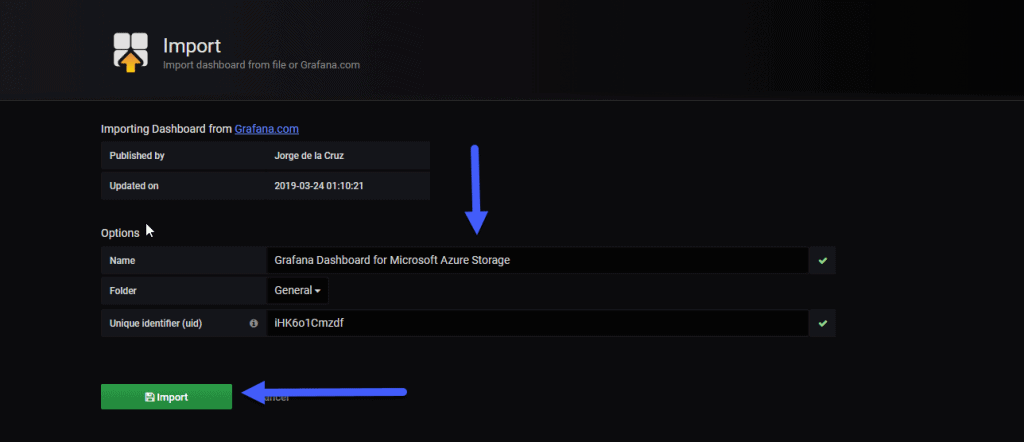
We would have everything, if some widget does not show information, make sure to select the drop down menus your accounts, in my case: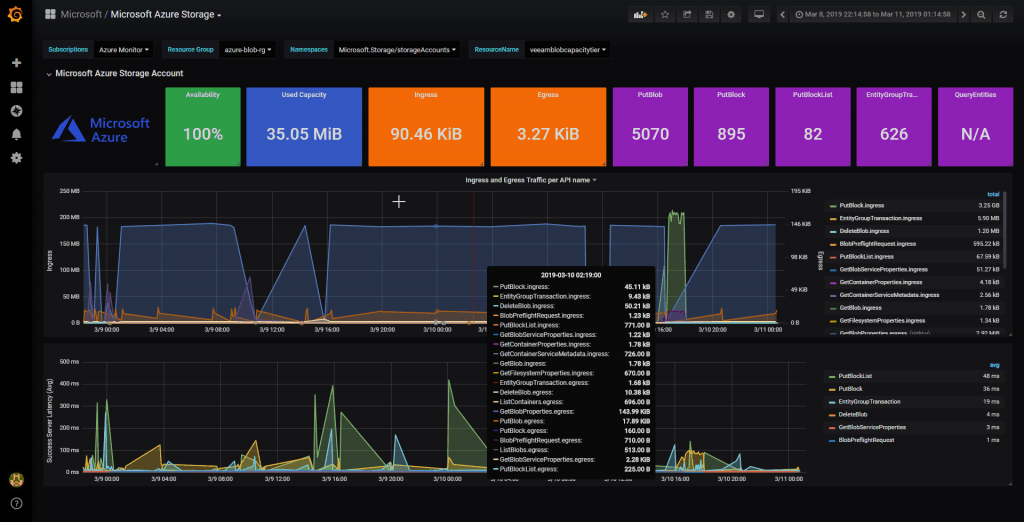
That’s it, we already have a very precise monitoring of the consumption of our Microsoft Azure Blob Storage, from here with these data, we can put it in the online calculator and know the forecast of expenditure.
I would like to leave you the list of articles that we will see throughout the series:
- Veeam: Cloud Tier/Capacity Tier in Microsoft Azure Blob – Introduction
- Veeam: Cloud Tier/Capacity Tier in Microsoft Azure Blob – How to create a Microsoft Storage Account and Azure Blob
- Veeam: Cloud Tier/Capacity Tier in Microsoft Azure Blob – How to configure a Veeam Backup & Replication Scale-Out Backup Repository
- Veeam: Cloud Tier/Capacity Tier in Microsoft Azure Blob – Quick overview to the Capacity Tier Offload task
- Veeam: Cloud Tier/Capacity Tier in Microsoft Azure Blob – Microsoft Azure Blob Monitoring with Veeam ONE
- Veeam: Cloud Tier/Capacity Tier in Microsoft Azure Blob – Microsoft Azure Blob Monitoring with Azure Monitor and Grafana

Leave a Reply