
 Greetings friends, we have spoken on numerous occasions about the power of InfluxDB, Telegraf and Grafana, if you remember not long ago I left you this fantastic post on how to monitor your vSphere for free and in less than 5 minutes:
The post, and the Dashboards ready to consume, which have several thousand downloads, are very complete, but if it is true that many of you have asked me if we could go a step further and also monitor the physical part of the ESXi Hosts, using the IPMI.
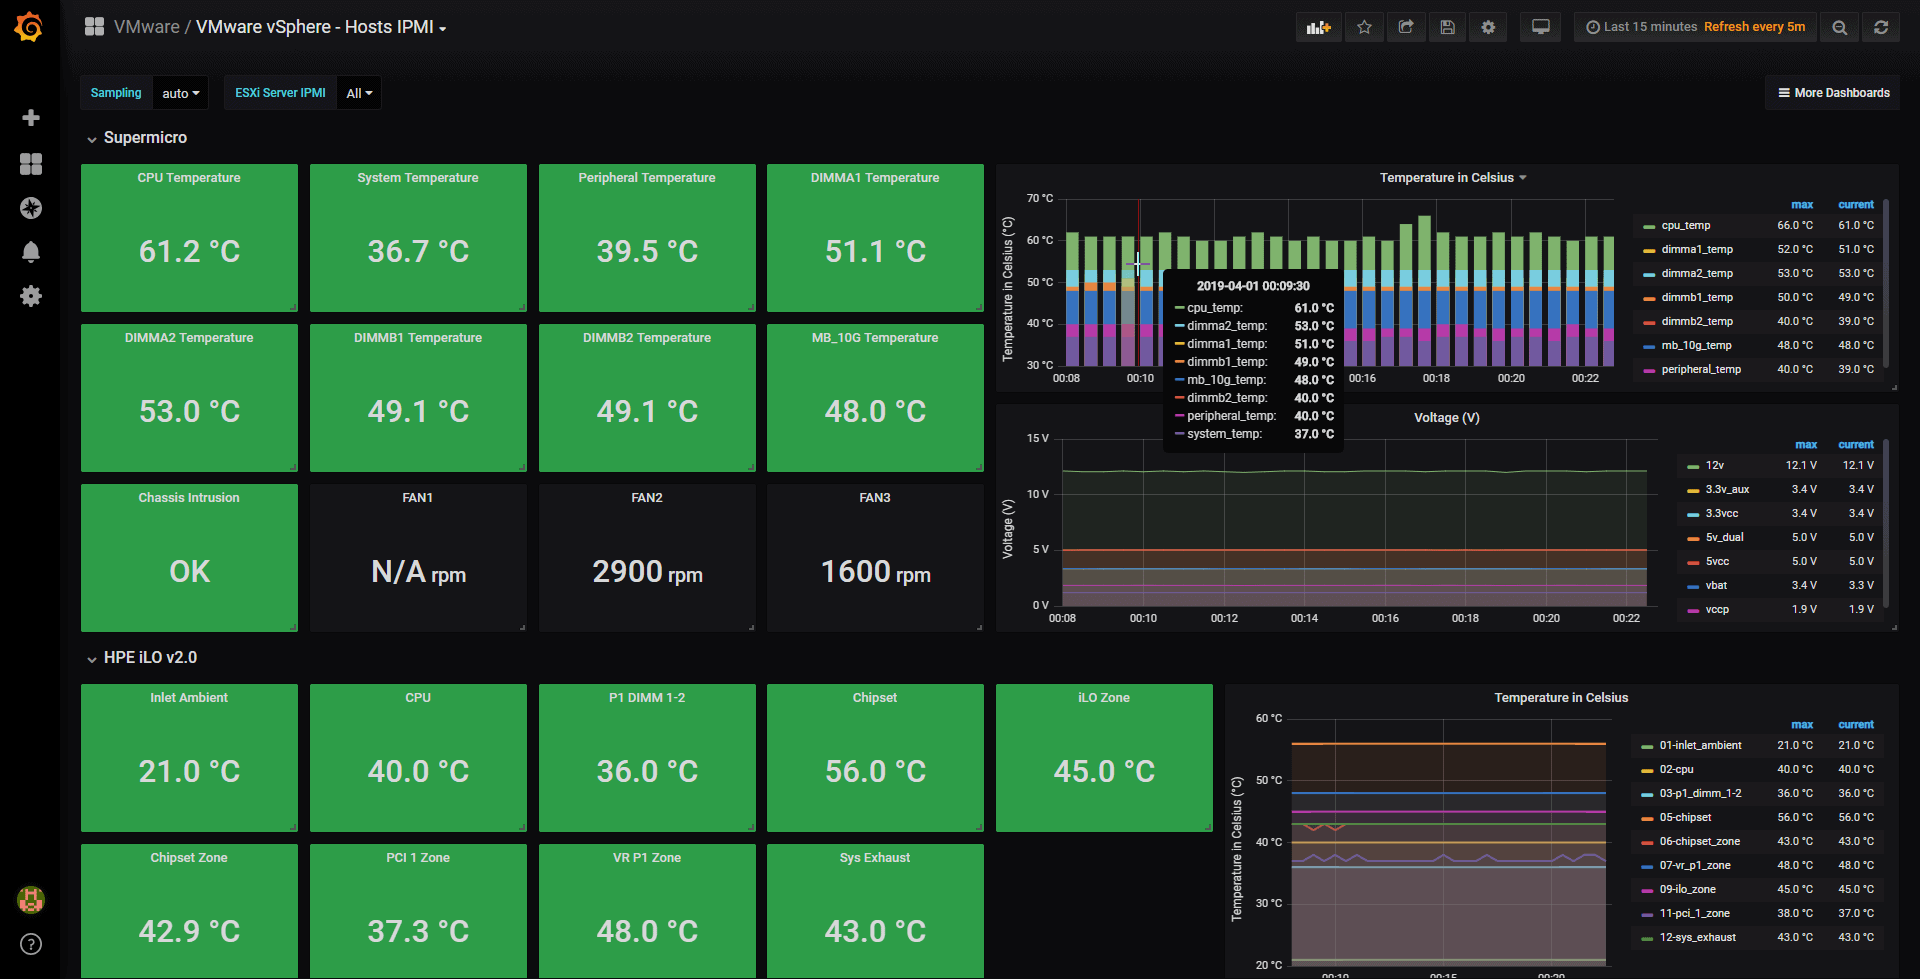
At the end of the blog posts you can have an interesting Dashboard as simple and useful as this one, where we can see the temperatures of the different components (it’s different for each manufacturer, I’ll leave you ready HPE and Supermicro):
 You can see it live without installing anything here:
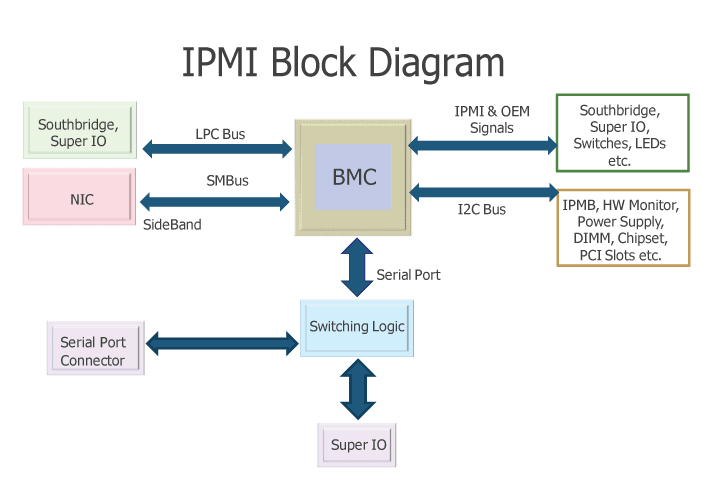
What is IPMI or Intelligent Platform Management Interface?
The IPMI chip is a stand-alone chip found on certain motherboards, typically in server architectures. This chip is responsible for monitoring the basic components of the motherboard, for example IPMI can know the temperature of different chips such as the CPU, RAM modules, network chips, as well as provide asbtraction of keyboard, mouse and monitor, allowing through an applet or HTML5 plugin, connect through a browser emulating that we have connected VGA ports, mouse and keyboard. In addition, and as if all the above were not enough, it also allows us to abstract the DVD/CD drive and we can mount our ISOS to servers that may be miles away from us, in a transparent way doing the redirection, here a diagram thanks to Wikipedia:
This IPMI is known in other manufacturers or jargon of IT administrators like iLO, RemoteKVM, remote hands, out-of-band management, etc.
Monitoring with InfluxDB, Telegraf and Grafana
Telegraf is the best agent to collect information from a lot of applications that it already supports in the inputs part in a native way, specifically Telegraf already comes with IPMI support as input, so we will go to the [input.ipmi] section and we will have to configure the section with our details, for example in my case my two Servers, one HPE and another Supermicro:
[[inputs.ipmi_sensor]]
   servers = ["MYUSER:MYPASS@lan(MYSUPERMICROIPMIIP)","MYUSER:MYPASS@lanplus(MYHPEIPMIIP)"]
   interval = "30s"
   timeout = "20s"
In addition, we will have to install ipmitool in case the telegraf server does not have it, with these steps:
apt-get install ipmitool
And it would be, if, I know, it’s so simple that it almost scares, we’ll restart the telegraph service:
service telegraf restart
And if we don’t see any error when we launch service telegraf status after a minute, we can continue with the import of the Grafana Dashboard.
Grafana Dashboards
This is where I’ve worked really hard, as I’ve created a Dashboard from scratch by selecting the best database requests, finishing off colors, thinking what graphics and how to display them, and everything is automated so that it fits your environment without any problems and without having to edit anything manually. You can find the Dashboards here, once imported, you can move between this and the other vSphere with the top menu on the right, now it’s time to download them, or know the ID at least of them:
Import the Grafana Dashboard easily
So that you don’t have to waste hours configuring a new Dashboard, and ingesting and debugging queries, I’ve already created you a stupid Dashboard with everything you need to monitor our environment in a very simple way, it will look like the image I showed you above.
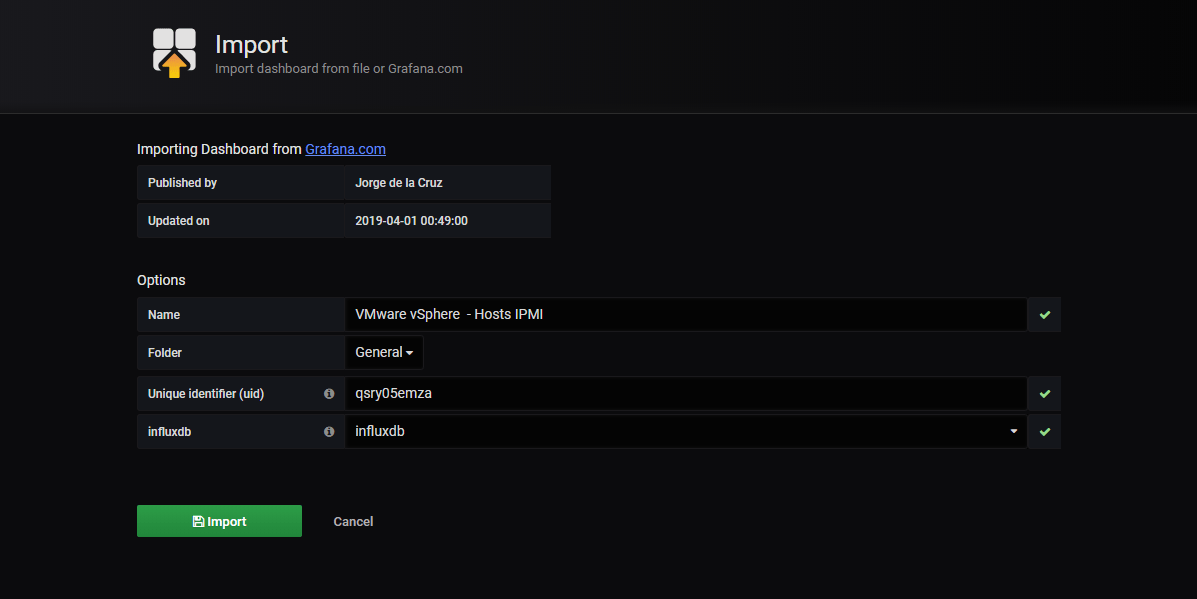
From our Grafana, we will do Create – Import
 Select the name you want and enter the ID: 9985, which is the unique ID of the Dashboard, or the URLs:
 With the menu at the top right, you can switch between the Dashboards of Hosts, Datastores, VMs and of course the main one of Overview or the latter about Temperature and more using IPMI:If you want to see them working without installing anything, here is the link to my environment:
- vSphere Overview Hosts IPMI – https://snapshot.raintank.io/dashboard/snapshot/XpKnqrTdEkdLJiWIn4eMXH1gFAPLQFdZ
I hope you like it, and I would like to leave you the complete series here, so you can start playing with the plugins that I have been telling you about all these years:
- Looking for the Perfect Dashboard: InfluxDB, Telegraf, and Grafana – Part I (Installing InfluxDB, Telegraf, and Grafana on Ubuntu 20.04 LTS)
- En busca del Dashboard perfecto: InfluxDB, Telegraf y Grafana – Parte II (Instalar agente Telegraf en Nodos remotos Linux)
- En busca del Dashboard perfecto: InfluxDB, Telegraf y Grafana – Parte III Integración con PRTG
- En busca del Dashboard perfecto: InfluxDB, Telegraf y Grafana – Parte IV (Instalar agente Telegraf en Nodos remotos Windows)
- En busca del Dashboard perfecto: InfluxDB, Telegraf y Grafana – Parte V (Activar inputs específicos, Red, MySQL/MariaDB, Nginx)
- En busca del Dashboard perfecto: InfluxDB, Telegraf y Grafana – Parte VI (Monitorizando Veeam)
- En busca del Dashboard perfecto: InfluxDB, Telegraf y Grafana – Parte VII (Monitorizar vSphere)
- En busca del Dashboard perfecto: InfluxDB, Telegraf y Grafana – Parte VIII (Monitorizando Veeam con Enterprise Manager)
- En busca del Dashboard perfecto: InfluxDB, Telegraf y Grafana – Parte IX (Monitorizando Zimbra Collaboration)
- En busca del Dashboard perfecto: InfluxDB, Telegraf y Grafana – Parte X (Grafana Plugins)
- En busca del Dashboard perfecto: InfluxDB, Telegraf y Grafana – Parte XI – (Monitorizando URL e IPS con Telegraf y Ping)
- Looking for the Perfect Dashboard: InfluxDB, Telegraf, and Grafana – Part XII (Native Telegraf Plugin for vSphere)
- Looking for the Perfect Dashboard: InfluxDB, Telegraf, and Grafana – Part XIII (Veeam Backup for Microsoft Office 365 v4)
- Looking for the Perfect Dashboard: InfluxDB, Telegraf, and Grafana – Part XIV – Veeam Availability Console
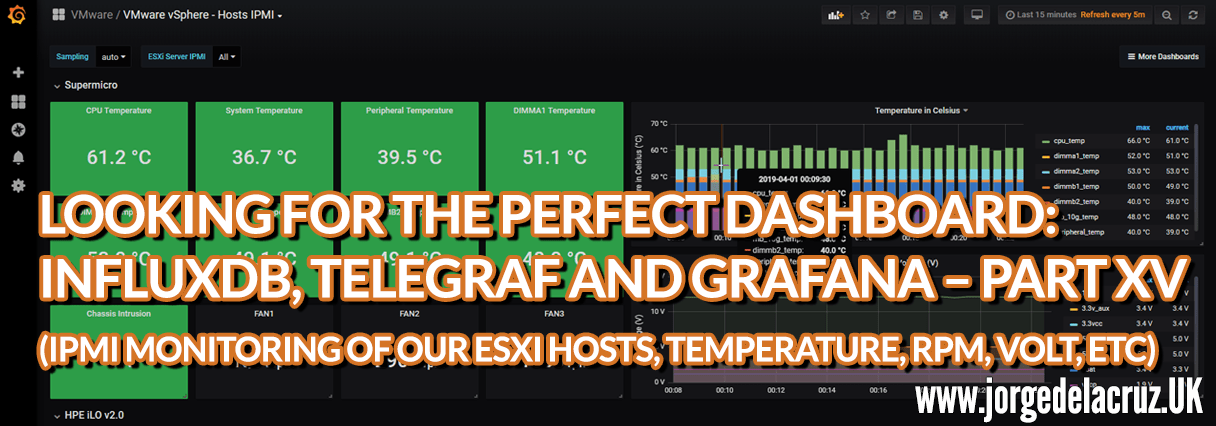
- Looking for the Perfect Dashboard: InfluxDB, Telegraf, and Grafana – Part XV (IPMI Monitoring of our ESXi Hosts)
- Looking for Perfect Dashboard: InfluxDB, Telegraf, and Grafana – Part XVI (Performance and Advanced Security of Veeam Backup for Microsoft Office 365)
- Looking for the Perfect Dashboard: InfluxDB, Telegraf, and Grafana – Part XVII (Showing Dashboards on Two Monitors Using Raspberry Pi 4)
- En busca del Dashboard perfecto: InfluxDB, Telegraf y Grafana – Parte XVIII – Monitorizar temperatura y estado de Raspberry Pi 4
- Looking for the Perfect Dashboard: InfluxDB, Telegraf, and Grafana – Part XIX (Monitoring Veeam with Enterprise Manager) Shell Script
- Looking for the Perfect Dashboard: InfluxDB, Telegraf, and Grafana – Part XXIV (Monitoring Veeam Backup for Microsoft Azure)
- Looking for the Perfect Dashboard: InfluxDB, Telegraf, and Grafana – Part XXV (Monitoring Power Consumption)
- Looking for the Perfect Dashboard: InfluxDB, Telegraf, and Grafana – Part XXVI (Monitoring Veeam Backup for Nutanix)
- Looking for the Perfect Dashboard: InfluxDB, Telegraf, and Grafana – Part XXVII (Monitoring ReFS and XFS (block-cloning and reflink)
- Looking for the Perfect Dashboard: InfluxDB, Telegraf, and Grafana – Part XXVIII (Monitoring HPE StoreOnce)
- Looking for the Perfect Dashboard: InfluxDB, Telegraf, and Grafana – Part XXIX (Monitoring Pi-hole)
- Looking for the Perfect Dashboard: InfluxDB, Telegraf, and Grafana – Part XXIX (Monitoring Veeam Backup for AWS)
- Looking for the Perfect Dashboard: InfluxDB, Telegraf, and Grafana – Part XXXI (Monitoring Unifi Protect)
- Looking for the Perfect Dashboard: InfluxDB, Telegraf, and Grafana – Part XXXII (Monitoring Veeam ONE – experimental)
- Looking for the Perfect Dashboard: InfluxDB, Telegraf, and Grafana – Part XXXIII (Monitoring NetApp ONTAP)
- Looking for the Perfect Dashboard: InfluxDB, Telegraf, and Grafana – Part XXXIV (Monitoring Runecast)
- Looking for the Perfect Dashboard: InfluxDB, Telegraf, and Grafana – Part XXXV (GPU Monitoring)
- Looking for the Perfect Dashboard: InfluxDB, Telegraf, and Grafana – Part XXXVI (Monitoring Goldshell Miners – JSONv2)
- Looking for the Perfect Dashboard: InfluxDB, Telegraf, and Grafana – Part XXXVII (Monitoring Veeam Backup for Google Cloud Platform)
- En Busca del Dashboard perfecto: InfluxDB, Telegraf y Grafana – Parte XXXVIII (Monitorizando Temperatura y Humedad con Xiaomi Mijia)
- Looking for the Perfect Dashboard: InfluxDB, Telegraf, and Grafana – Part XL (Veeam Backup for Microsoft 365 – Restore Audit)
- Looking for the Perfect Dashboard: InfluxDB, Telegraf, and Grafana – Part XLI (Veeam Backup for Salesforce)
- Looking for the Perfect Dashboard: InfluxDB, Telegraf, and Grafana – Part XLII (Veeam ONE v12 Audit Events)
- Looking for the Perfect Dashboard: InfluxDB, Telegraf, and Grafana – Part XLIII (Monitoring QNAP using SNMP v3)
- Looking for the Perfect Dashboard: InfluxDB, Telegraf, and Grafana – Part XLIV (Monitoring Veeam Backup & Replication API)
- Looking for the Perfect Dashboard: InfluxDB, Telegraf, and Grafana – Part XLV (Monitoring Synology using SNMP v3)
- Looking for the Perfect Dashboard: InfluxDB, Telegraf, and Grafana – Part XLVI (Monitoring NVIDIA Jetson Nano)
- Looking for the Perfect Dashboard: InfluxDB, Telegraf, and Grafana – Part XLVII (Monitoring Open WebUI)
- Looking for the Perfect Dashboard: InfluxDB, Telegraf, and Grafana – Part XLVIII (Monitoring Veeam Data Platform Advanced)
- Looking for the Perfect Dashboard: InfluxDB, Telegraf, and Grafana – Part XLIX (Monitoring Unofficial Veeam ONE Node Exporter)
Jorge,
Thanks for another great tutorial. I have 3 HP ESXi hosts and I wanted to know if there was a way to extend this dashboard to cover them? Also for The one HP server and my Supermicro server I am only getting inlet ambient temp and system temp. The rest of the metrics are not reporting. Any ideas why this would be?
Thanks!
Hello NJL, you will need to play with the query, as my assumption is that all different vendors, and MODELS, have different IPMI I am afraid 🙁 Let me know if you get stuck so I can help
Hi Jorge,
Fantastic information, thank you so much for sharing.
I have a Centos 8 KVM host and already have the ipmitool operating, and I would like to feed the data into an InfluxDB and Grafana dashboard. Can I assume I need to install telegraf on the Centos 8 KVM host, or can the ipmitool be run remotely?
Thanks, Mark
Hi;
dell poweredge servers are also not working. Will you make any improvements on this?
Hello Ahmet, are you using the Dell iDrac? What is the error? Can you navigate through the metrics on InfluxDB?
Hi Jorge;
Thank you for your interest,
Yes i am using idrac. The problem is that these metrics are not coming. I took a look at the fan metrics. When I changed the defined ip address, the values came, but they are not correct. Also, when I change fan A and fan B values to fan1 and fan2, the values can be read. I also edited other metrics but the values did not improve. You can see the problem in the picture in the link.
https://ibb.co/vV1xmVB
https://ibb.co/9qd7rgD
https://ibb.co/12tbS2w
Hi Jorge, THANK YOU for your dashboards, they are a work of art.
I’m fairly new to Grafana/Prometheus/Influxdb/. . .
I have you VMware dashboards working – WOW – amazing
I’m trying to get this IPMI dashboard working but was wondering if you have instructions or can direct me to another URL on how to modify this for my servers HPE ProLiant DL360 Gen10 (currently a PoC)
This is my ipmitool output :
UID | 0x0 | discrete | 0x0180| na | na | na | na | na | na
SysHealth_Stat | 0x0 | discrete | 0x0180| na | na | na | na | na | na
01-Inlet Ambient | 28.000 | degrees C | ok | na | na | na | na | 42.000 | 47.000
02-CPU 1 | 53.000 | degrees C | ok | na | na | na | na | 70.000 | na
03-CPU 2 | 48.000 | degrees C | ok | na | na | na | na | 70.000 | na
04-P1 DIMM 1-6 | 43.000 | degrees C | ok | na | na | na | na | 90.000 | na
05-PMM 1-6 | na | | na | na | na | na | na | 83.000 | na
06-P1 DIMM 7-12 | 46.000 | degrees C | ok | na | na | na | na | 90.000 | na
07-PMM 7-12 | na | | na | na | na | na | na | 83.000 | na
08-P2 DIMM 1-6 | 46.000 | degrees C | ok | na | na | na | na | 90.000 | na
09-PMM 1-6 | na | | na | na | na | na | na | 83.000 | na
10-P2 DIMM 7-12 | 48.000 | degrees C | ok | na | na | na | na | 90.000 | na
11-PMM 7-12 | na | | na | na | na | na | na | 83.000 | na
12-HD Max | 35.000 | degrees C | ok | na | na | na | na | 60.000 | na
13-Exp Bay Drive | na | | na | na | na | na | na | 57.000 | na
14-Stor Batt 1 | 26.000 | degrees C | ok | na | na | na | na | 60.000 | na
15-Front Ambient | 28.000 | degrees C | ok | na | na | na | na | 60.000 | na
16-VR P1 | 48.000 | degrees C | ok | na | na | na | na | 115.000 | 120.000
17-VR P2 | 50.000 | degrees C | ok | na | na | na | na | 115.000 | 120.000
18-VR P1 Mem 1 | 37.000 | degrees C | ok | na | na | na | na | 115.000 | 120.000
19-VR P1 Mem 2 | 34.000 | degrees C | ok | na | na | na | na | 115.000 | 120.000
20-VR P2 Mem 1 | 37.000 | degrees C | ok | na | na | na | na | 115.000 | 120.000
21-VR P2 Mem 2 | 39.000 | degrees C | ok | na | na | na | na | 115.000 | 120.000
22-Chipset | 53.000 | degrees C | ok | na | na | na | na | 100.000 | na
23-BMC | 82.000 | degrees C | ok | na | na | na | na | 110.000 | 115.000
24-BMC Zone | 51.000 | degrees C | ok | na | na | na | na | 90.000 | 95.000
26-HD Cntlr Zone | 39.000 | degrees C | ok | na | na | na | na | 85.000 | 90.000
29-I/O Zone | 43.000 | degrees C | ok | na | na | na | na | 90.000 | 95.000
31-PCI 1 Zone | 54.000 | degrees C | ok | na | na | na | na | 90.000 | 95.000
33-PCI 2 Zone | 52.000 | degrees C | ok | na | na | na | na | 90.000 | 95.000
35-PCI 3 Zone | 48.000 | degrees C | ok | na | na | na | na | 90.000 | 95.000
37-Rear HD Max | na | | na | na | na | na | na | 60.000 | na
38-Battery Zone | 45.000 | degrees C | ok | na | na | na | na | 75.000 | 80.000
39-P/S 1 Inlet | 36.000 | degrees C | ok | na | na | na | na | na | na
40-P/S 2 Inlet | 59.000 | degrees C | ok | na | na | na | na | na | na
41-P/S 1 | 45.000 | degrees C | ok | na | na | na | na | na | na
42-P/S 2 | 62.000 | degrees C | ok | na | na | na | na | na | na
43-E-Fuse | 48.000 | degrees C | ok | na | na | na | na | 100.000 | na
44-P/S 2 Zone | 55.000 | degrees C | ok | na | na | na | na | 75.000 | 80.000
49-CPU 1 PkgTmp | 81.000 | degrees C | ok | na | na | na | na | na | na
50-CPU 2 PkgTmp | 78.000 | degrees C | ok | na | na | na | na | na | na
61-AHCI HD Max | na | | na | na | na | na | na | 60.000 | na
69-PCI 1 M2 | na | | na | na | na | na | na | 80.000 | na
70-PCI 1 M2 Zn | na | | na | na | na | na | na | na | na
71-PCI 2 M2 | na | | na | na | na | na | na | 80.000 | na
72-PCI 2 M2 Zn | na | | na | na | na | na | na | na | na
73-PCI 3 M2 | na | | na | na | na | na | na | 80.000 | na
74-PCI 3 M2 Zn | na | | na | na | na | na | na | na | na
Fan 1 | 0x0 | discrete | 0x0180| na | na | na | na | na | na
Fan 1 DutyCycle | 36.848 | percent | ok | na | na | na | na | na | na
Fan 1 Presence | 0x0 | discrete | 0x0280| na | na | na | na | na | na
Fan 2 | 0x0 | discrete | 0x0180| na | na | na | na | na | na
Fan 2 DutyCycle | 36.848 | percent | ok | na | na | na | na | na | na
Fan 2 Presence | 0x0 | discrete | 0x0280| na | na | na | na | na | na
Fan 3 | 0x0 | discrete | 0x0180| na | na | na | na | na | na
Fan 3 DutyCycle | 36.848 | percent | ok | na | na | na | na | na | na
Fan 3 Presence | 0x0 | discrete | 0x0280| na | na | na | na | na | na
Fan 4 | 0x0 | discrete | 0x0180| na | na | na | na | na | na
Fan 4 DutyCycle | 36.848 | percent | ok | na | na | na | na | na | na
Fan 4 Presence | 0x0 | discrete | 0x0280| na | na | na | na | na | na
Fan 5 | 0x0 | discrete | 0x0180| na | na | na | na | na | na
Fan 5 DutyCycle | 36.848 | percent | ok | na | na | na | na | na | na
Fan 5 Presence | 0x0 | discrete | 0x0280| na | na | na | na | na | na
Fan 6 | 0x0 | discrete | 0x0180| na | na | na | na | na | na
Fan 6 DutyCycle | 36.848 | percent | ok | na | na | na | na | na | na
Fan 6 Presence | 0x0 | discrete | 0x0280| na | na | na | na | na | na
Fan 7 | 0x0 | discrete | 0x0180| na | na | na | na | na | na
Fan 7 DutyCycle | 36.848 | percent | ok | na | na | na | na | na | na
Fan 7 Presence | 0x0 | discrete | 0x0280| na | na | na | na | na | na
Power Supply 1 | 0x0 | discrete | 0x0180| na | na | na | na | na | na
PS 1 Input | 210.000 | Watts | ok | na | na | na | na | na | na
Power Supply 2 | 0x0 | discrete | 0x0180| na | na | na | na | na | na
PS 2 Input | 150.000 | Watts | ok | na | na | na | na | na | na
Power Meter | 370.000 | Watts | ok | na | na | na | na | na | na
Fans | 0x0 | discrete | 0x0180| na | na | na | na | na | na
Power Supplies | 0x0 | discrete | 0x0180| na | na | na | na | na | na
Memory Status | 0x0 | discrete | 0x4080| na | na | na | na | na | na
Megacell Status | 0x0 | discrete | 0x0480| na | na | na | na | na | na
Intrusion | na | discrete | na | na | na | na | na | na | na
CPU Utilization | 109.000 | unspecified | ok | na | na | na | na | na | na
PS 1 Output | 200.000 | Watts | ok | na | na | na | na | na | na
PS_Volt_Out_01 | 12.000 | Volts | ok | na | na | na | na | na | na
PS_Volt_In_01 | 236.000 | Volts | ok | na | na | na | na | na | na
PS_Curr_Out_01 | 17.000 | Amps | ok | na | na | na | na | na | na
PS_Curr_In_01 | 0.900 | Amps | ok | na | na | na | na | na | na
PS 2 Output | 150.000 | Watts | ok | na | na | na | na | na | na
PS_Volt_Out_02 | 12.000 | Volts | ok | na | na | na | na | na | na
PS_Volt_In_02 | 236.000 | Volts | ok | na | na | na | na | na | na
PS_Curr_Out_02 | 12.900 | Amps | ok | na | na | na | na | na | na
PS_Curr_In_02 | 0.600 | Amps | ok | na | na | na | na | na | na
25.1-HD Controll | 35.000 | degrees C | ok | na | na | na | 75.000 | 80.000 | 85.000
25.2-HD Controll | 42.000 | degrees C | ok | na | na | na | 98.000 | 103.000 | 108.000
25.3-HD Controll | 39.000 | degrees C | ok | na | na | na | 73.000 | 78.000 | 83.000
27.1-LOM-Communi | 65.000 | degrees C | ok | na | na | na | 100.000 | 110.000 | 115.000
28.1-LOM Card-Ne | 46.000 | degrees C | ok | na | na | na | 55.000 | 65.000 | 85.000
28.2-LOM Card-Ne | 46.000 | degrees C | ok | na | na | na | 55.000 | 65.000 | 85.000
28.3-LOM Card-Ne | 44.000 | degrees C | ok | na | na | na | 55.000 | 65.000 | 85.000
30.1-PCI 1-I/O m | 69.000 | degrees C | ok | na | na | na | 100.000 | 105.000 | 110.000
30.2-PCI 1-Exter | 57.000 | degrees C | ok | na | na | na | 80.000 | 85.000 | 0.000
30.3-PCI 1-Exter | 59.000 | degrees C | ok | na | na | na | 80.000 | 85.000 | 0.000
32.1-PCI 2-Netwo | 42.000 | degrees C | ok | na | na | na | 55.000 | 65.000 | 85.000
32.2-PCI 2-Netwo | 45.000 | degrees C | ok | na | na | na | 55.000 | 65.000 | 85.000
32.3-PCI 2-Netwo | 41.000 | degrees C | ok | na | na | na | 55.000 | 65.000 | 85.000
34.1-PCI 3-I/O m | 63.000 | degrees C | ok | na | na | na | 100.000 | 105.000 | 115.000
NIC_Link_02P1 | 0x0 | discrete | 0x0280| na | na | na | na | na | na
NIC_Link_02P2 | 0x0 | discrete | 0x0280| na | na | na | na | na | na
NIC_Link_03P1 | 0x0 | discrete | 0x0280| na | na | na | na | na | na
NIC_Link_03P2 | 0x0 | discrete | 0x0280| na | na | na | na | na | na
LOM_Link_P1 | na | discrete | na | na | na | na | na | na | na
LOM_Link_P2 | na | discrete | na | na | na | na | na | na | na
LOM_Link_P3 | na | discrete | na | na | na | na | na | na | na
LOM_Link_P4 | na | discrete | na | na | na | na | na | na | na
ALOM_Link_P1 | 0x0 | discrete | 0x0280| na | na | na | na | na | na
ALOM_Link_P2 | 0x0 | discrete | 0x0280| na | na | na | na | na | na
Dr_Stat_1I1_B001 | 0x0 | discrete | 0x0180| na | na | na | na | na | na
Dr_Stat_1I1_B002 | 0x0 | discrete | 0x0180| na | na | na | na | na | na
Dr_Stat_1I1_B003 | 0x0 | discrete | 0x0180| na | na | na | na | na | na
Dr_Stat_1I1_B004 | 0x0 | discrete | 0x0180| na | na | na | na | na | na
Dr_Stat_2I1_B005 | 0x0 | discrete | 0x0180| na | na | na | na | na | na
Dr_Stat_2I1_B006 | 0x0 | discrete | 0x0180| na | na | na | na | na | na
Dr_Stat_2I1_B007 | 0x0 | discrete | 0x0180| na | na | na | na | na | na
CPU_Stat_C1 | 0x0 | discrete | 0x8080| na | na | na | na | na | na
CPU_Stat_C2 | 0x0 | discrete | 0x8080| na | na | na | na | na | na
Hello, thanks for the feedback. Well as every server is different, you will need to play a bit with the queries, and point to your specific measurement. 🙂
Hi Jorge,
I am interested to use this tools, but I had tried to configure by testing it with result here:
2024-10-28T06:39:47Z W! DeprecationWarning: Value “agent_host” for option “agent_host_tag” of plugin “inputs.snmp” deprecated since version 1.29.0 and will be removed in 2.0.0: set to “source” for consistent usage across plugins or safely ignore this message and continue to use the current value
panic: runtime error: slice bounds out of range [:-1]
goroutine 33 [running]:
github.com/influxdata/telegraf/plugins/inputs/ipmi_sensor.NewConnection({0xc00285cab1, 0x25}, {0x0, 0x0}, {0x0, 0x0})
/go/src/github.com/influxdata/telegraf/plugins/inputs/ipmi_sensor/connection.go:46 +0x2c5
github.com/influxdata/telegraf/plugins/inputs/ipmi_sensor.(*Ipmi).parse(0xc0029623c0, {0xa109f40, 0xc002632f80}, {0xc00285cab1, 0x25}, {0x912b79a, 0x3})
/go/src/github.com/influxdata/telegraf/plugins/inputs/ipmi_sensor/ipmi_sensor.go:132 +0x27d
github.com/influxdata/telegraf/plugins/inputs/ipmi_sensor.(*Ipmi).Gather.func1({0xa109f40, 0xc002632f80}, {0xc00285cab1, 0x25})
/go/src/github.com/influxdata/telegraf/plugins/inputs/ipmi_sensor/ipmi_sensor.go:99 +0x9a
created by github.com/influxdata/telegraf/plugins/inputs/ipmi_sensor.(*Ipmi).Gather in goroutine 16
/go/src/github.com/influxdata/telegraf/plugins/inputs/ipmi_sensor/ipmi_sensor.go:96 +0x125
root@jhony-virtual-machine:/etc/telegraf/telegraf.d#
I used a configuration for testing the telegraf first, but failed as above log.
below is the configuration named ipmitools.conf:
## snmp v2 config
#[[inputs.snmp]]
#agents = [ “10.48.100.50” ]
#version = 1
#community = “snmpdppln”
#interval = “60s”
## snmp v3 config
[[inputs.snmp]]
agents = [ “10.48.100.50” ]
version = 3
sec_level = “authPriv”
sec_name = “snmpdppln”
auth_protocol = “sha”
auth_password = “kemalbadry”
priv_protocol = “des”
priv_password = “kemalbadry”
interval = “60s”
# # Read metrics from the bare metal servers via IPMI
[[inputs.ipmi_sensor]]
# ## Specify the path to the ipmitool executable
# # path = “/usr/bin/ipmitool”
#
# ## Use sudo
# ## Setting ‘use_sudo’ to true will make use of sudo to run ipmitool.
# ## Sudo must be configured to allow the telegraf user to run ipmitool
# ## without a password.
# # use_sudo = false
#
# ## Servers
# ## Specify one or more servers via a url. If no servers are specified, local
# ## machine sensor stats will be queried. Uses the format:
# ## [username[:password]@][protocol[(address)]]
# ## e.g. root:passwd@lan(127.0.0.1)
# # servers = [“USERID:PASSW0RD@lan(192.168.1.1)”]
#servers = [“kemal:kemalbadry@lan(10.48.100.50”]
servers = [“kemal:kemalbadry@lanplus(10.48.100.50”]
#
# ## Session privilege level
# ## Choose from: CALLBACK, USER, OPERATOR, ADMINISTRATOR
# # privilege = “ADMINISTRATOR”
#
# ## Timeout
# ## Timeout for the ipmitool command to complete.
# # timeout = “20s”
interval = “30s”
timeout = “20s”
Please advice and thanks in advanced
Regards,
Jhony
Oh, this is not expected. Would you mind to please report it on the InfluxDB Community? Also, can you try just the ipmi tool on linux, to see if it works.