
 Greetings friends, since a few years ago, Veeam has native protection for workloads in Nutanix Acropolis, I told you how to deploy the Proxy and configure jobs, also the article contained the new report of Veeam ONE.
But it is true that the monitoring of jobs, restore points, etc. in Veeam ONE can not include as much information as we need, so I decided to expand the possibilities with Grafana.
Once you have finished this tutorial, you will have something similar to this, it’s better to give it several hours or days to see the whole potential:

Veeam Backup for Nutanix – RESTful API
To get this Dashboard, I’m using the RESTFul API that Veeam Backup for Nutanix includes natively.
Attention: This RESTFul API is not supported by Veeam, we can’t ask anything in the forums or open support cases, use it only under your responsibility.
To access this RESTFul API, it’s as simple as going to the IP of our Veeam Backup for Nutanix Proxy, and adding /swagger in the URL, like this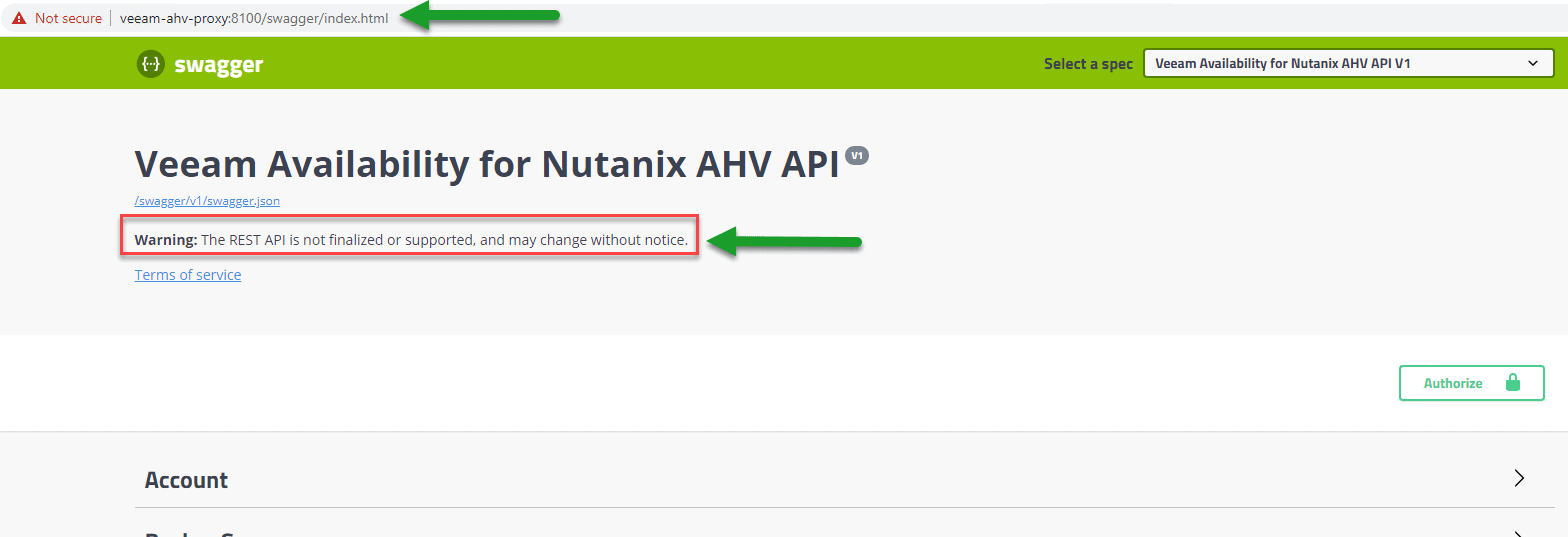
Once inside, and once we understand that it is a temporary product, and that it can change, we can click on Account to get our token: Once logged in, for example, if I go to the Sync Policy Sessions, we can see the following:
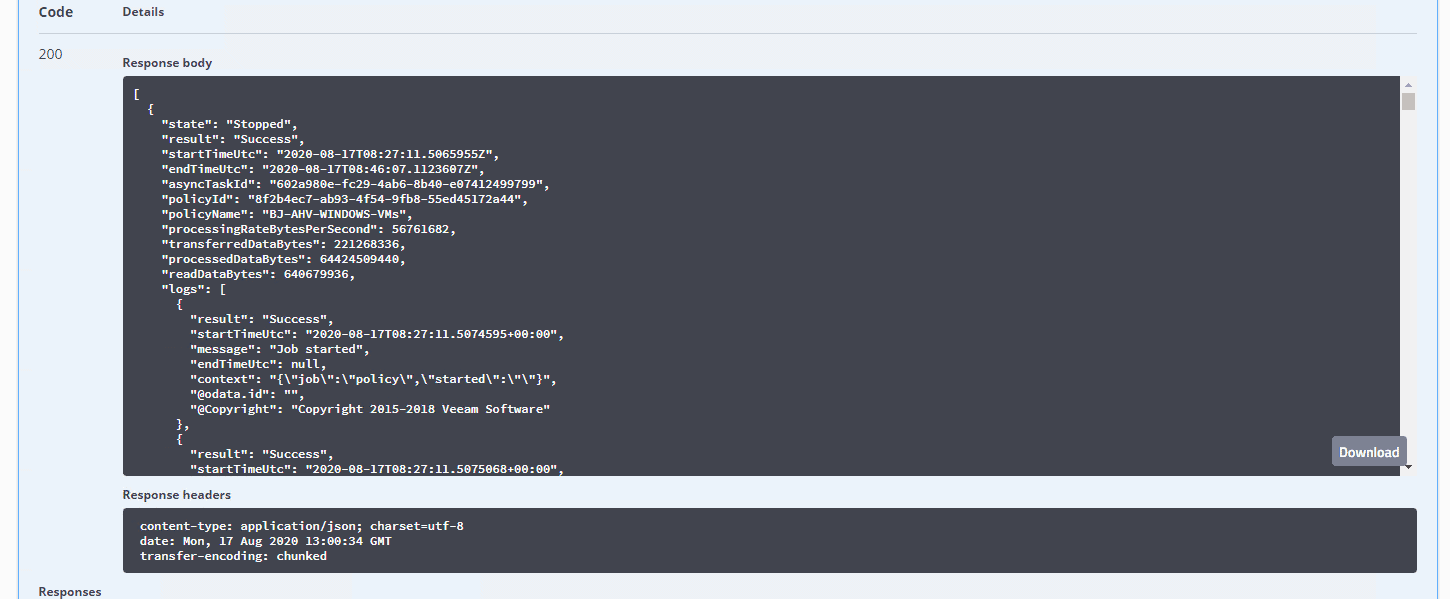 And so on with all the other endpoints that this API offers us.
Diagram of the RESTful API, InfluxDB and Grafana monitoring Veeam Backup for Nutanix AHV
Although I have already shown you on some occasions the diagram of how the monitoring would be using Grafana and InfluxDB, I leave you again the diagram, this time monitoring Veeam Backup for Nutanix AHV:
Download and configure the script veeam_nutanixahv.sh
Let’s download the script that will make all this work, we will download the latest version from the Github repository:
This shell script can be downloaded and run from the telegraf server, or InfluxDB, or any other Linux. We will have to edit the configuration parameters:
# Endpoint URL for InfluxDB
veeamInfluxDBURL="http://YOURINFLUXSERVERIP" #Your InfluxDB Server, http://FQDN or https://FQDN if using SSL
veeamInfluxDBPort="8086" #Default Port
veeamInfluxDB="telegraf" #Default Database
veeamInfluxDBUser="USER" #User for Database
veeamInfluxDBPassword='PASSWORD' #Password for Database

# Endpoint URL for login action
veeamUsername="YOURUSER"
veeamPassword="YOURPASS"
veeamRestServer="https://YOURVEEAMAHVPROXY"
We will make the script executable with this simple step:
chmod +x veeam_nutanixahv.sh
We will make sure we have jq installed, an apt-get install jq or yum install jq if we use CentOS:
sudo apt-get install jq
And when we launch it, with the typical ./veeam_nutanixahv.sh if everything went well, we will see the following:
Writing veeam_nutanix_repository to InfluxDB
HTTP/1.1 204 No Content
Content-Type: application/json
Request-Id: d8c5a770-e134-11ea-a250-dca632b112f7
X-Influxdb-Build: OSS
X-Influxdb-Version: 1.8.2
X-Request-Id: d8c5a770-e134-11ea-a250-dca632b112f7
Date: Tue, 18 Aug 2020 09:26:07 GMT
Besides, it would be nice to put it in the cron to run every 30 minutes:
crontab -e
*/30 * * * * /home/oper/veeam_nutanixahv.sh >> /var/log/veeam_nutanixahv.log 2>&1
We have everything ready, let’s move to the next step.
Grafana Dashboards
I created a Dashboard from scratch by selecting the best requests to the database, finishing off colors, thinking about graphics, and how to display them, and everything is automated so that it fits our environment without any problem and without having to edit anything manually. The Dashboard can be found here, once imported, you can see all the graphics:
How to easily Import the Grafana Dashboard
So that you don’t have to waste hours configuring a new dashboard, and ingesting and debugging you want, I have already created four wonderful dashboards with everything necessary to monitor our environment in a very simple way, it will look like the image I showed you above. Select the name you want and enter the ID: 12839, which is the unique ID of the Dashboard, or the URL:
We’ll have everything popping up without any problem:
I hope you like it, and I would like to leave you the complete series here, so you can start playing with the plugins that I have been telling you about all these years:
- Looking for the Perfect Dashboard: InfluxDB, Telegraf, and Grafana – Part I (Installing InfluxDB, Telegraf, and Grafana on Ubuntu 20.04 LTS)
- En busca del Dashboard perfecto: InfluxDB, Telegraf y Grafana – Parte II (Instalar agente Telegraf en Nodos remotos Linux)
- En busca del Dashboard perfecto: InfluxDB, Telegraf y Grafana – Parte III Integración con PRTG
- En busca del Dashboard perfecto: InfluxDB, Telegraf y Grafana – Parte IV (Instalar agente Telegraf en Nodos remotos Windows)
- En busca del Dashboard perfecto: InfluxDB, Telegraf y Grafana – Parte V (Activar inputs específicos, Red, MySQL/MariaDB, Nginx)
- En busca del Dashboard perfecto: InfluxDB, Telegraf y Grafana – Parte VI (Monitorizando Veeam)
- En busca del Dashboard perfecto: InfluxDB, Telegraf y Grafana – Parte VII (Monitorizar vSphere)
- En busca del Dashboard perfecto: InfluxDB, Telegraf y Grafana – Parte VIII (Monitorizando Veeam con Enterprise Manager)
- En busca del Dashboard perfecto: InfluxDB, Telegraf y Grafana – Parte IX (Monitorizando Zimbra Collaboration)
- En busca del Dashboard perfecto: InfluxDB, Telegraf y Grafana – Parte X (Grafana Plugins)
- En busca del Dashboard perfecto: InfluxDB, Telegraf y Grafana – Parte XI – (Monitorizando URL e IPS con Telegraf y Ping)
- Looking for the Perfect Dashboard: InfluxDB, Telegraf, and Grafana – Part XII (Native Telegraf Plugin for vSphere)
- Looking for the Perfect Dashboard: InfluxDB, Telegraf, and Grafana – Part XIII (Veeam Backup for Microsoft Office 365 v4)
- Looking for the Perfect Dashboard: InfluxDB, Telegraf, and Grafana – Part XIV – Veeam Availability Console
- Looking for the Perfect Dashboard: InfluxDB, Telegraf, and Grafana – Part XV (IPMI Monitoring of our ESXi Hosts)
- Looking for Perfect Dashboard: InfluxDB, Telegraf, and Grafana – Part XVI (Performance and Advanced Security of Veeam Backup for Microsoft Office 365)
- Looking for the Perfect Dashboard: InfluxDB, Telegraf, and Grafana – Part XVII (Showing Dashboards on Two Monitors Using Raspberry Pi 4)
- En busca del Dashboard perfecto: InfluxDB, Telegraf y Grafana – Parte XVIII – Monitorizar temperatura y estado de Raspberry Pi 4
- Looking for the Perfect Dashboard: InfluxDB, Telegraf, and Grafana – Part XIX (Monitoring Veeam with Enterprise Manager) Shell Script
- Looking for the Perfect Dashboard: InfluxDB, Telegraf, and Grafana – Part XXIV (Monitoring Veeam Backup for Microsoft Azure)
- Looking for the Perfect Dashboard: InfluxDB, Telegraf, and Grafana – Part XXV (Monitoring Power Consumption)
- Looking for the Perfect Dashboard: InfluxDB, Telegraf, and Grafana – Part XXVI (Monitoring Veeam Backup for Nutanix)
- Looking for the Perfect Dashboard: InfluxDB, Telegraf, and Grafana – Part XXVII (Monitoring ReFS and XFS (block-cloning and reflink)
- Looking for the Perfect Dashboard: InfluxDB, Telegraf, and Grafana – Part XXVIII (Monitoring HPE StoreOnce)
- Looking for the Perfect Dashboard: InfluxDB, Telegraf, and Grafana – Part XXIX (Monitoring Pi-hole)
- Looking for the Perfect Dashboard: InfluxDB, Telegraf, and Grafana – Part XXIX (Monitoring Veeam Backup for AWS)
- Looking for the Perfect Dashboard: InfluxDB, Telegraf, and Grafana – Part XXXI (Monitoring Unifi Protect)
- Looking for the Perfect Dashboard: InfluxDB, Telegraf, and Grafana – Part XXXII (Monitoring Veeam ONE – experimental)
- Looking for the Perfect Dashboard: InfluxDB, Telegraf, and Grafana – Part XXXIII (Monitoring NetApp ONTAP)
- Looking for the Perfect Dashboard: InfluxDB, Telegraf, and Grafana – Part XXXIV (Monitoring Runecast)
- Looking for the Perfect Dashboard: InfluxDB, Telegraf, and Grafana – Part XXXV (GPU Monitoring)
- Looking for the Perfect Dashboard: InfluxDB, Telegraf, and Grafana – Part XXXVI (Monitoring Goldshell Miners – JSONv2)
- Looking for the Perfect Dashboard: InfluxDB, Telegraf, and Grafana – Part XXXVII (Monitoring Veeam Backup for Google Cloud Platform)
- En Busca del Dashboard perfecto: InfluxDB, Telegraf y Grafana – Parte XXXVIII (Monitorizando Temperatura y Humedad con Xiaomi Mijia)
- Looking for the Perfect Dashboard: InfluxDB, Telegraf, and Grafana – Part XL (Veeam Backup for Microsoft 365 – Restore Audit)
- Looking for the Perfect Dashboard: InfluxDB, Telegraf, and Grafana – Part XLI (Veeam Backup for Salesforce)
- Looking for the Perfect Dashboard: InfluxDB, Telegraf, and Grafana – Part XLII (Veeam ONE v12 Audit Events)
- Looking for the Perfect Dashboard: InfluxDB, Telegraf, and Grafana – Part XLIII (Monitoring QNAP using SNMP v3)
- Looking for the Perfect Dashboard: InfluxDB, Telegraf, and Grafana – Part XLIV (Monitoring Veeam Backup & Replication API)
- Looking for the Perfect Dashboard: InfluxDB, Telegraf, and Grafana – Part XLV (Monitoring Synology using SNMP v3)
- Looking for the Perfect Dashboard: InfluxDB, Telegraf, and Grafana – Part XLVI (Monitoring NVIDIA Jetson Nano)
- Looking for the Perfect Dashboard: InfluxDB, Telegraf, and Grafana – Part XLVII (Monitoring Open WebUI)
- Looking for the Perfect Dashboard: InfluxDB, Telegraf, and Grafana – Part XLVIII (Monitoring Veeam Data Platform Advanced)
- Looking for the Perfect Dashboard: InfluxDB, Telegraf, and Grafana – Part XLIX (Monitoring Unofficial Veeam ONE Node Exporter)
I did your tutorial but came across this error:
{“code”:”unauthorized”,”message”:”Unauthorized”}Writing veeam_nutanix_dashboard to InfluxDB
HTTP/1.1 401 Unauthorized
Content-Type: application/json; charset=utf-8
X-Influxdb-Build: OSS
X-Influxdb-Version: v2.7.1
X-Platform-Error-Code: unauthorized
Date: Tue, 18 Jul 2023 20:26:15 GMT
Content-Length: 48
I need to check if this was ported to Flux language, I think is still influxql.
Let me verify
Hi,
I have this error:
./veeam_nutanixahv.sh
./veeam_nutanixahv.sh: line 1: !/bin/bash: No such file or directory
Writing veeam_nutanix_version to InfluxDB
HTTP/1.1 401 Unauthorized
Content-Type: application/json; charset=utf-8
X-Influxdb-Build: OSS
X-Influxdb-Version: v2.7.1
X-Platform-Error-Code: unauthorized
Date: Thu, 28 Sep 2023 13:24:40 GMT
Content-Length: 48
{“code”:”unauthorized”,”message”:”Unauthorized”}Writing veeam_nutanix_dashboard to InfluxDB
HTTP/1.1 401 Unauthorized
Content-Type: application/json; charset=utf-8
X-Influxdb-Build: OSS
X-Influxdb-Version: v2.7.1
X-Platform-Error-Code: unauthorized
Date: Thu, 28 Sep 2023 13:24:40 GMT
Content-Length: 48
{“code”:”unauthorized”,”message”:”Unauthorized”}
Hello,
That is very weird, what OS you using?