
 Greetings friends, before we jump into the blog post, I want to personally thank you for being here with me along with these 40 Blog Post series! Absolutely insane number of blogs regarding one topic, Observability, so the only thing I hope is that you have been enjoying them as much as I enjoyed writing them.
In the previous blog post, I wrote about how we can have a powerful Grafana Dashboard showing us the different Restore Portal Operators logins, including IP, geolocation, etc. Take a quick look at that Dashboard, as I think it complements this one as well.
Restore Audits are not new, Veeam includes a great report in Veeam ONE for VBR Restores, it is called Restore Operator Activity and it is one of my favorites without a doubt. I saw it in use in pretty much every Customer I had the pleasure to talk to about Reporting. But this report does not extend to Veeam Backup for Microsoft 365. I have been doing a lot of work on this Audit thing for a long time, speaking about Veeam Backup for Microsoft 365, like:
- Using the real-time SMTP Audit as soon as a restore happens – Veeam: Veeam Backup for Microsoft Office 365 v5 – Security Notifications for Restore operations
- Parsing Windows Logs, on the Explorer Client (pretty painful) – Performance and Advanced Security of Veeam Backup for Microsoft Office 365
But what I bring today is the usual, bash shell, simple to execute, that grabs data and writes to InfluxDB to finish with an excellent Dashboard.
Grafana Dashboard to Audit all Restores on Veeam Backup for Microsoft 365
When you finish the entry you will have something similar to this Dashboard, bear in mind this applies to either using normal Veeam Backup for Microsoft 365 Console, the API, PowerShell, Restore Portal, everything it will appear here, centralized:
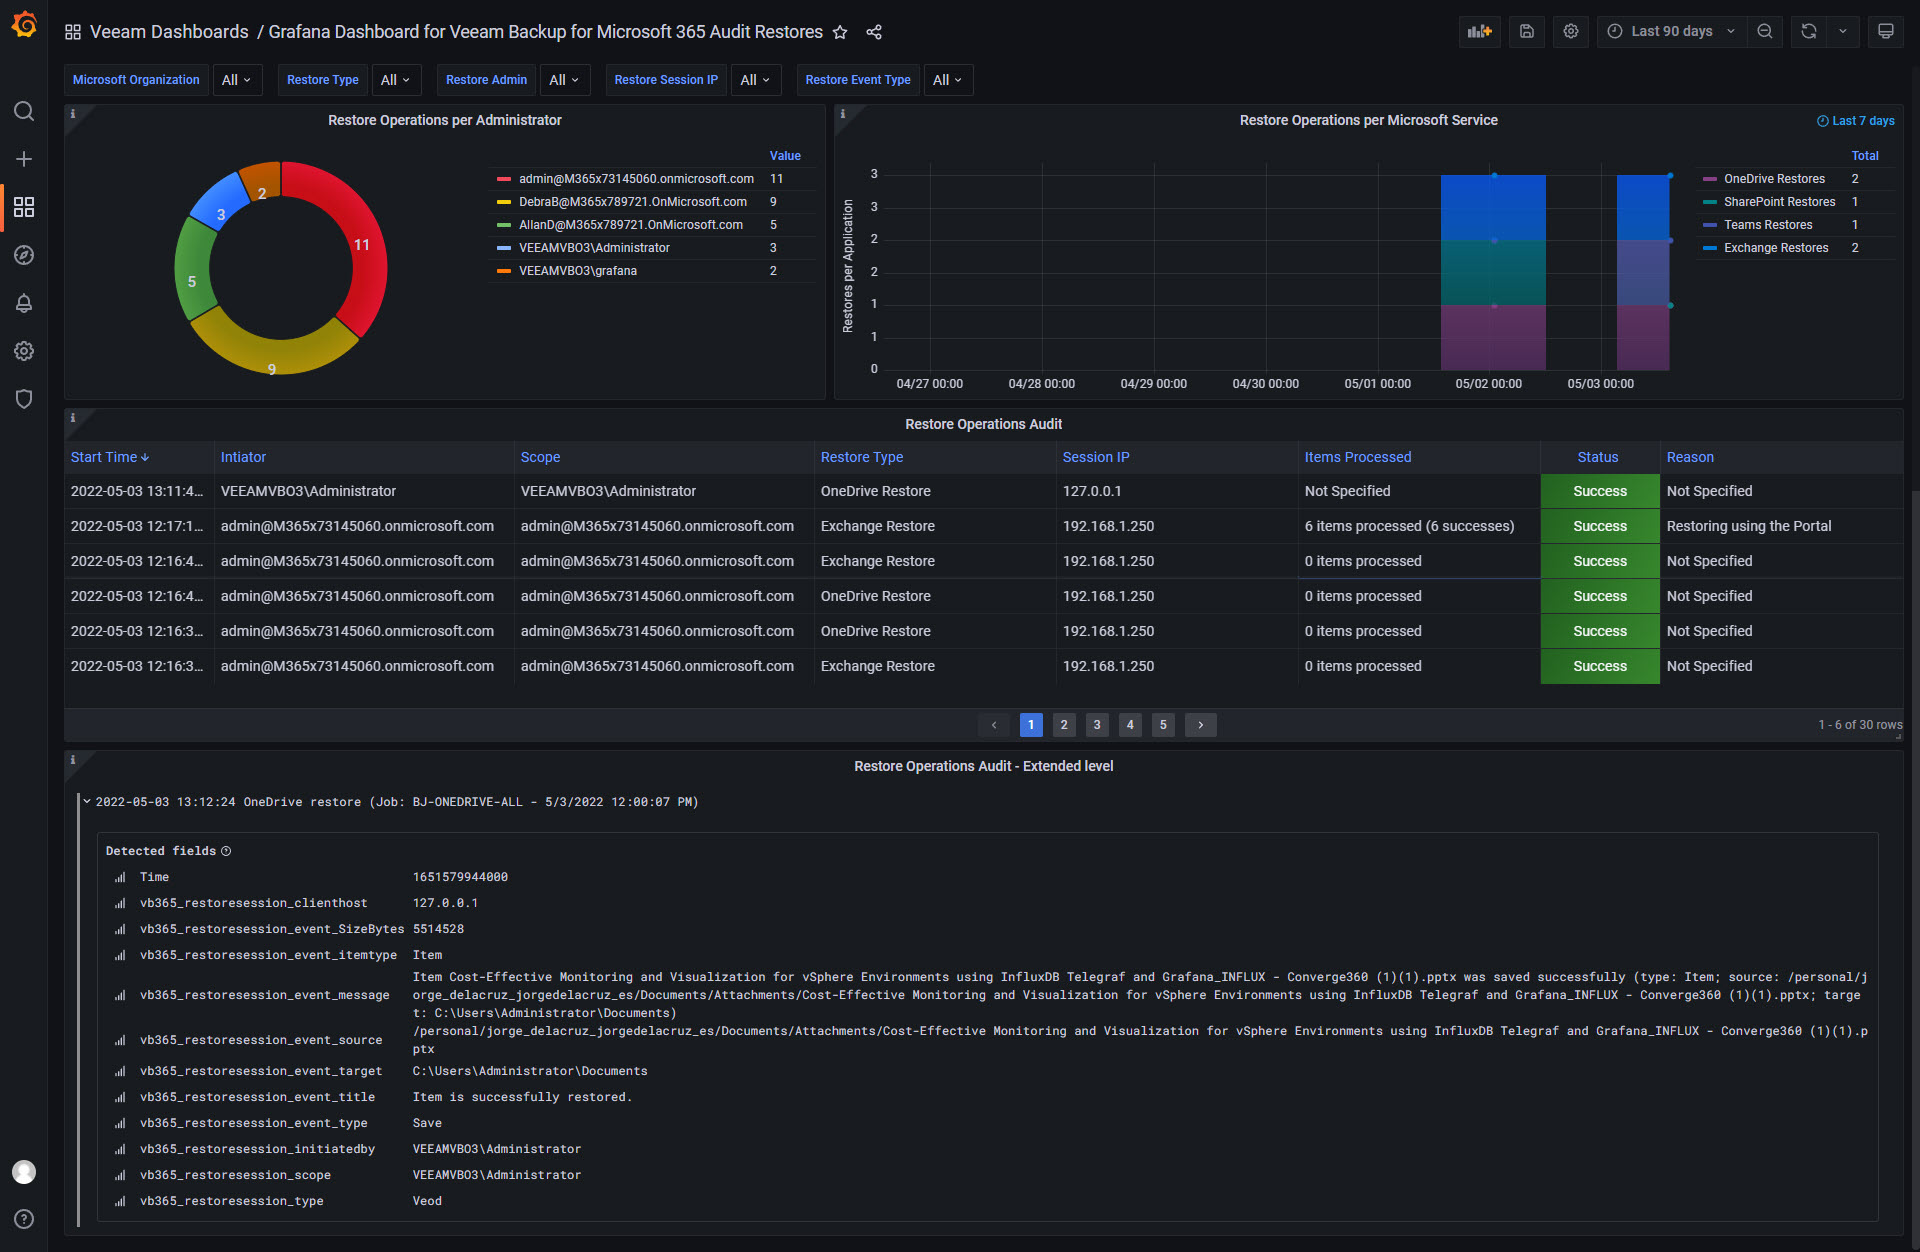 Dashboard – Summary
- Restore Operations per Operator – A pie-chart that displays the different Operators, it can be even users restoring their own stuff using Restore Portal. It does display a comfortable table at the right with the most operations operator at the top.
- Restore Operations per Microsoft Service (Widget on the right) – A time-series table that displays just the last week, you can edit this of course, with a total of restore operations, with a different colors per Microsoft 365 Service, remember that at the moment we can recover: Exchange Online, SharePoint Online, OneDrive for Business, or Microsoft Teams.
- Restore Operations Audit (Mid-table) – Now we jump into the Audit Mode, on this very first table, we can quickly see the high-level restore sessions per Operator, with some information like timestamp, who initiated the restore, scope in case it is a Restore Operator, Restore Type, IP, etc.
- Restore Operations Audit – Extended level (Bottom-table) – And we end with a really detailed Log-view, where we can expand every restore session, and take a look at what happened inside, it will include all the details we mentioned before, like whom did the operation, IP, etc. But it will also dig deep into the level of restoration that happened.
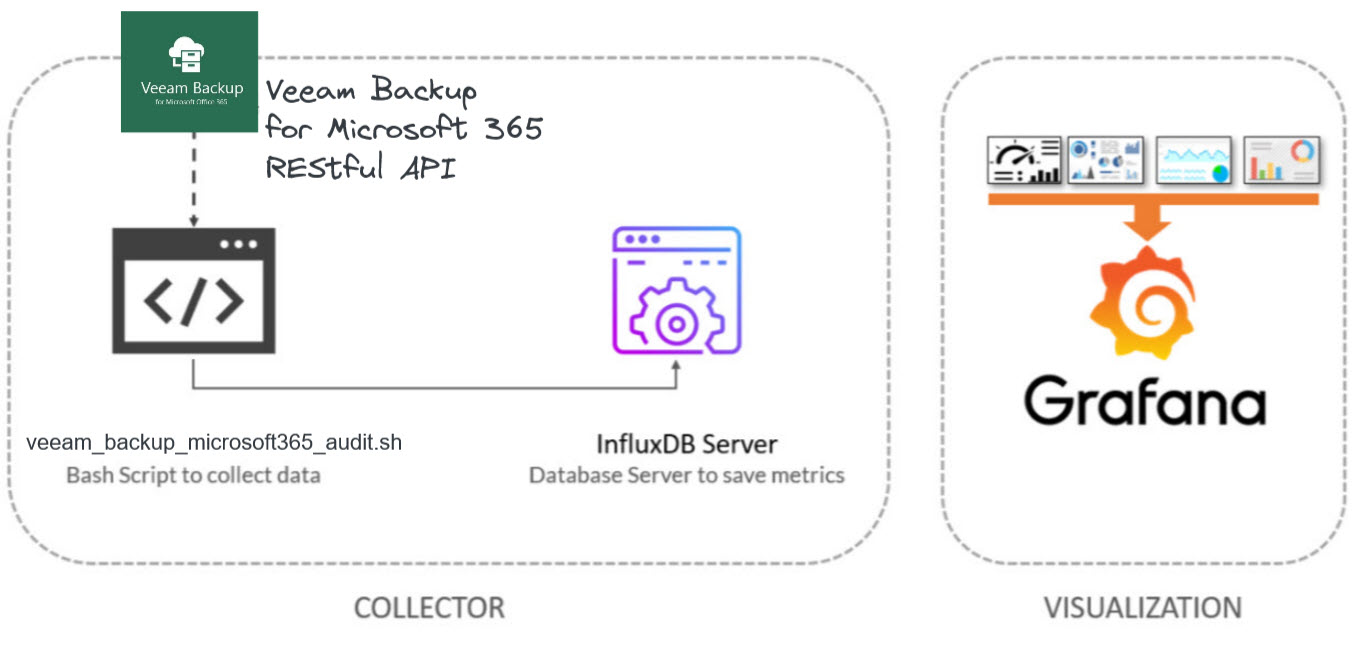
Topology with all logical components
This entry is very similar to the previous ones, we will use a shell script to collect the User Logins to our Veeam Restore Portal metrics using Azure Graph. The design would be something similar to this:
Download and configure theveeam_backup_microsoft365_audit.sh script
We have almost everything ready, we have one last step, the script that will make all this work, we will download the latest version from the Github repository:
This shell script can be downloaded and run from the telegraf server, InfluxDB, or any other Linux. We will have to edit the configuration parameters:
##
# Configurations
##
# System Variables
auditdays="7" #The number of days you want the Audit to look back (default last 7 days)
timestart=$(date --date="-$auditdays days" +%FT%TZ)

# Endpoint URL for InfluxDB
veeamInfluxDBURL="http://YOURINFLUXSERVERIP" #Your InfluxDB Server, http://FQDN or https://FQDN if using SSL
veeamInfluxDBPort="8086" #Default Port
veeamInfluxDBBucket="veeam" # InfluxDB bucket name (not ID)
veeamInfluxDBToken="TOKEN" # InfluxDB access token with read/write privileges for the bucket
veeamInfluxDBOrg="ORG NAME" # InfluxDB organisation name (not ID)

# Endpoint URL for login action
veeamUsername="YOURVBOUSER"
veeamPassword="YOURVBOPASSWORD"
veeamRestServer="https://YOURVBOSERVERIP"
veeamRestPort="4443" #Default Port
Once the changes are done, make the script executable with chmod:
chmod +x veeam_backup_microsoft365_audit.sh
The output of the command should be something like the next, without errors:
HTTP/2 204
x-influxdb-build: OSS
x-influxdb-version: v2.2.0
date: Tue, 03 May 2022 14:05:59 GMT
If so, please now add this script to your crontab, like for example every 30 minutes:
*/30 * * * * /home/oper/veeam_backup_microsoft365_audit.sh >> /var/log/veeamvb365_audit.log 2>&1
Grafana Dashboards
I created a Dashboard from scratch by selecting the best requests to the database, finishing off colors, thinking about graphics, and how to display them, and everything is automated so that it fits our environment without any problem and without having to edit anything manually. The Dashboard can be found here, once imported, you can use the top drop-down menus to select between organizations, backups, repositories and proxies, VMs, etc.:
Import Grafana Dashboards easily
So that you don’t have to waste hours configuring a new Dashboard, and ingesting and debugging what you want, I have already a wonderful Dashboard with everything you need to monitor our environment in a very simple way, you will be like the image I showed you above. Select the name you want and enter the ID: 16204, which is the unique ID of the Dashboard, or the URL:
 With the menus above you can display and adjust the Dashboard to your different choices:
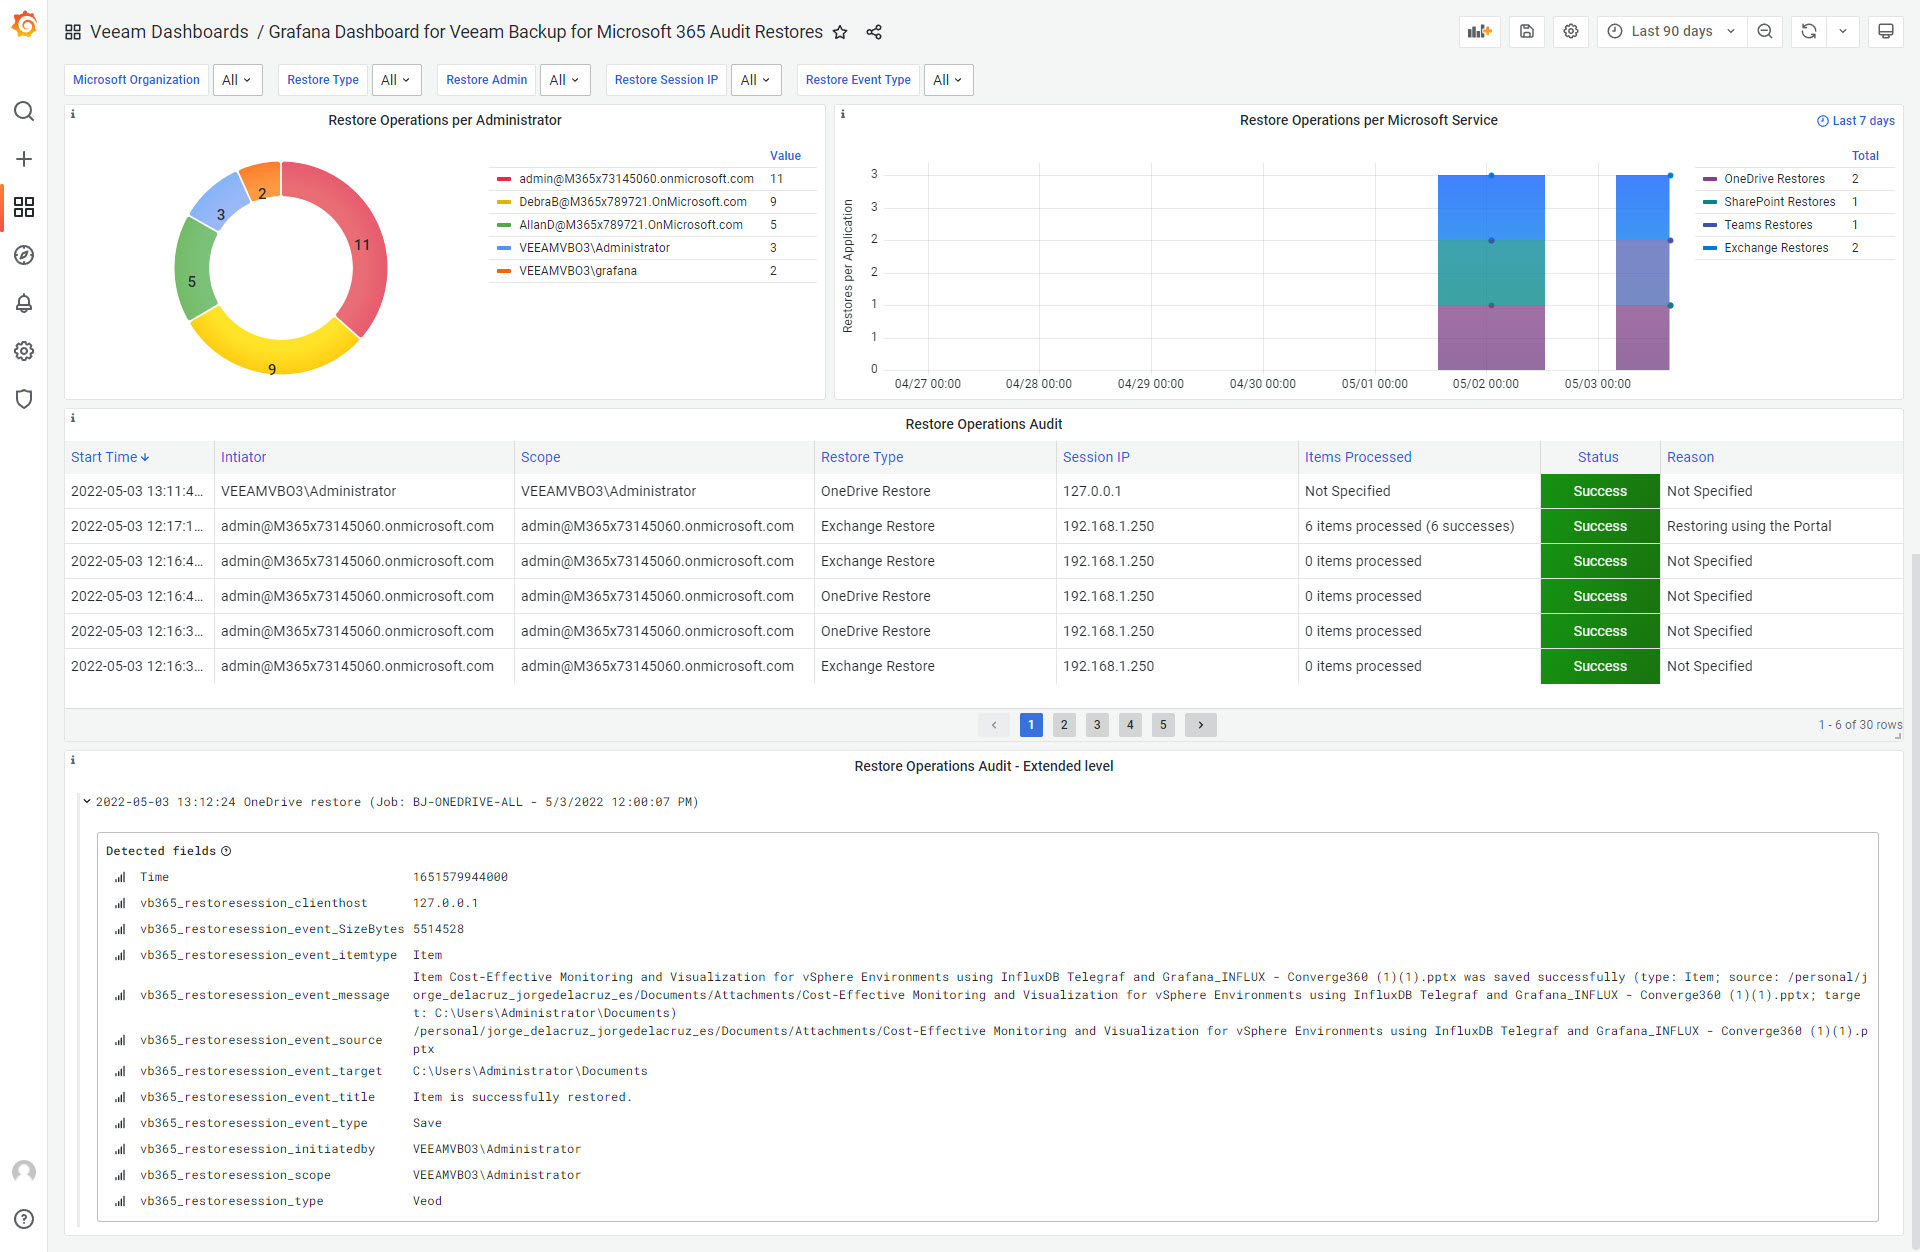
Also in light mode if you switch it on Grafana:
 Please leave your feedback in the comments, or on GitHub.
That’s all folks, if you want to follow the full Blog series about Grafana, InfluxDB, Telegraf, please click on the next links:
I hope you like it, and I would like to leave you the complete series here, so you can start playing with the plugins that I have been telling you about all these years:
- Looking for the Perfect Dashboard: InfluxDB, Telegraf, and Grafana – Part I (Installing InfluxDB, Telegraf, and Grafana on Ubuntu 20.04 LTS)
- En busca del Dashboard perfecto: InfluxDB, Telegraf y Grafana – Parte II (Instalar agente Telegraf en Nodos remotos Linux)
- En busca del Dashboard perfecto: InfluxDB, Telegraf y Grafana – Parte III Integración con PRTG
- En busca del Dashboard perfecto: InfluxDB, Telegraf y Grafana – Parte IV (Instalar agente Telegraf en Nodos remotos Windows)
- En busca del Dashboard perfecto: InfluxDB, Telegraf y Grafana – Parte V (Activar inputs específicos, Red, MySQL/MariaDB, Nginx)
- En busca del Dashboard perfecto: InfluxDB, Telegraf y Grafana – Parte VI (Monitorizando Veeam)
- En busca del Dashboard perfecto: InfluxDB, Telegraf y Grafana – Parte VII (Monitorizar vSphere)
- En busca del Dashboard perfecto: InfluxDB, Telegraf y Grafana – Parte VIII (Monitorizando Veeam con Enterprise Manager)
- En busca del Dashboard perfecto: InfluxDB, Telegraf y Grafana – Parte IX (Monitorizando Zimbra Collaboration)
- En busca del Dashboard perfecto: InfluxDB, Telegraf y Grafana – Parte X (Grafana Plugins)
- En busca del Dashboard perfecto: InfluxDB, Telegraf y Grafana – Parte XI – (Monitorizando URL e IPS con Telegraf y Ping)
- Looking for the Perfect Dashboard: InfluxDB, Telegraf, and Grafana – Part XII (Native Telegraf Plugin for vSphere)
- Looking for the Perfect Dashboard: InfluxDB, Telegraf, and Grafana – Part XIII (Veeam Backup for Microsoft Office 365 v4)
- Looking for the Perfect Dashboard: InfluxDB, Telegraf, and Grafana – Part XIV – Veeam Availability Console
- Looking for the Perfect Dashboard: InfluxDB, Telegraf, and Grafana – Part XV (IPMI Monitoring of our ESXi Hosts)
- Looking for Perfect Dashboard: InfluxDB, Telegraf, and Grafana – Part XVI (Performance and Advanced Security of Veeam Backup for Microsoft Office 365)
- Looking for the Perfect Dashboard: InfluxDB, Telegraf, and Grafana – Part XVII (Showing Dashboards on Two Monitors Using Raspberry Pi 4)
- En busca del Dashboard perfecto: InfluxDB, Telegraf y Grafana – Parte XVIII – Monitorizar temperatura y estado de Raspberry Pi 4
- Looking for the Perfect Dashboard: InfluxDB, Telegraf, and Grafana – Part XIX (Monitoring Veeam with Enterprise Manager) Shell Script
- Looking for the Perfect Dashboard: InfluxDB, Telegraf, and Grafana – Part XXIV (Monitoring Veeam Backup for Microsoft Azure)
- Looking for the Perfect Dashboard: InfluxDB, Telegraf, and Grafana – Part XXV (Monitoring Power Consumption)
- Looking for the Perfect Dashboard: InfluxDB, Telegraf, and Grafana – Part XXVI (Monitoring Veeam Backup for Nutanix)
- Looking for the Perfect Dashboard: InfluxDB, Telegraf, and Grafana – Part XXVII (Monitoring ReFS and XFS (block-cloning and reflink)
- Looking for the Perfect Dashboard: InfluxDB, Telegraf, and Grafana – Part XXVIII (Monitoring HPE StoreOnce)
- Looking for the Perfect Dashboard: InfluxDB, Telegraf, and Grafana – Part XXIX (Monitoring Pi-hole)
- Looking for the Perfect Dashboard: InfluxDB, Telegraf, and Grafana – Part XXIX (Monitoring Veeam Backup for AWS)
- Looking for the Perfect Dashboard: InfluxDB, Telegraf, and Grafana – Part XXXI (Monitoring Unifi Protect)
- Looking for the Perfect Dashboard: InfluxDB, Telegraf, and Grafana – Part XXXII (Monitoring Veeam ONE – experimental)
- Looking for the Perfect Dashboard: InfluxDB, Telegraf, and Grafana – Part XXXIII (Monitoring NetApp ONTAP)
- Looking for the Perfect Dashboard: InfluxDB, Telegraf, and Grafana – Part XXXIV (Monitoring Runecast)
- Looking for the Perfect Dashboard: InfluxDB, Telegraf, and Grafana – Part XXXV (GPU Monitoring)
- Looking for the Perfect Dashboard: InfluxDB, Telegraf, and Grafana – Part XXXVI (Monitoring Goldshell Miners – JSONv2)
- Looking for the Perfect Dashboard: InfluxDB, Telegraf, and Grafana – Part XXXVII (Monitoring Veeam Backup for Google Cloud Platform)
- En Busca del Dashboard perfecto: InfluxDB, Telegraf y Grafana – Parte XXXVIII (Monitorizando Temperatura y Humedad con Xiaomi Mijia)
- Looking for the Perfect Dashboard: InfluxDB, Telegraf, and Grafana – Part XL (Veeam Backup for Microsoft 365 – Restore Audit)
- Looking for the Perfect Dashboard: InfluxDB, Telegraf, and Grafana – Part XLI (Veeam Backup for Salesforce)
- Looking for the Perfect Dashboard: InfluxDB, Telegraf, and Grafana – Part XLII (Veeam ONE v12 Audit Events)
- Looking for the Perfect Dashboard: InfluxDB, Telegraf, and Grafana – Part XLIII (Monitoring QNAP using SNMP v3)
- Looking for the Perfect Dashboard: InfluxDB, Telegraf, and Grafana – Part XLIV (Monitoring Veeam Backup & Replication API)
- Looking for the Perfect Dashboard: InfluxDB, Telegraf, and Grafana – Part XLV (Monitoring Synology using SNMP v3)
- Looking for the Perfect Dashboard: InfluxDB, Telegraf, and Grafana – Part XLVI (Monitoring NVIDIA Jetson Nano)
- Looking for the Perfect Dashboard: InfluxDB, Telegraf, and Grafana – Part XLVII (Monitoring Open WebUI)
- Looking for the Perfect Dashboard: InfluxDB, Telegraf, and Grafana – Part XLVIII (Monitoring Veeam Data Platform Advanced)
- Looking for the Perfect Dashboard: InfluxDB, Telegraf, and Grafana – Part XLIX (Monitoring Unofficial Veeam ONE Node Exporter)
there is an article talks about monitoring Veeam Backup & Replication Community Edition by grafana