
 Greetings friends, today I bring you another one of those hidden gems that you like so much. In addition to being free and being able to display it in a few minutes, it has a potential that many commercial tools would like.
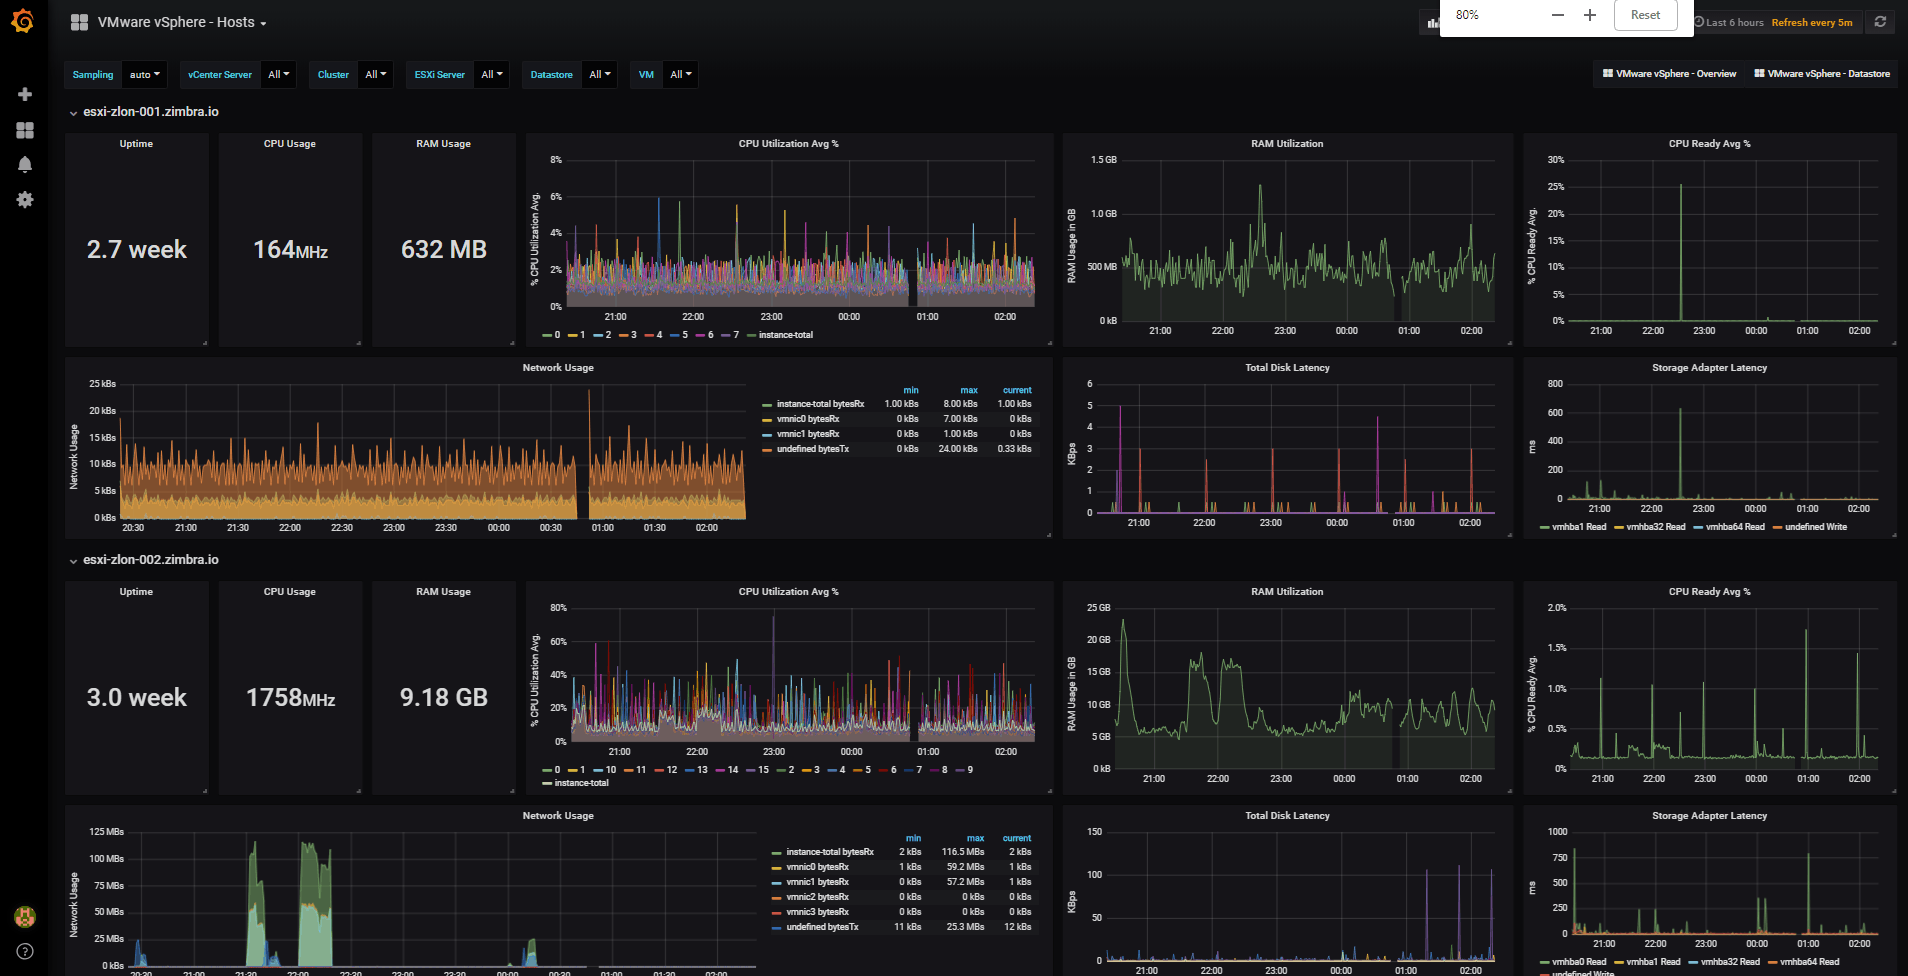
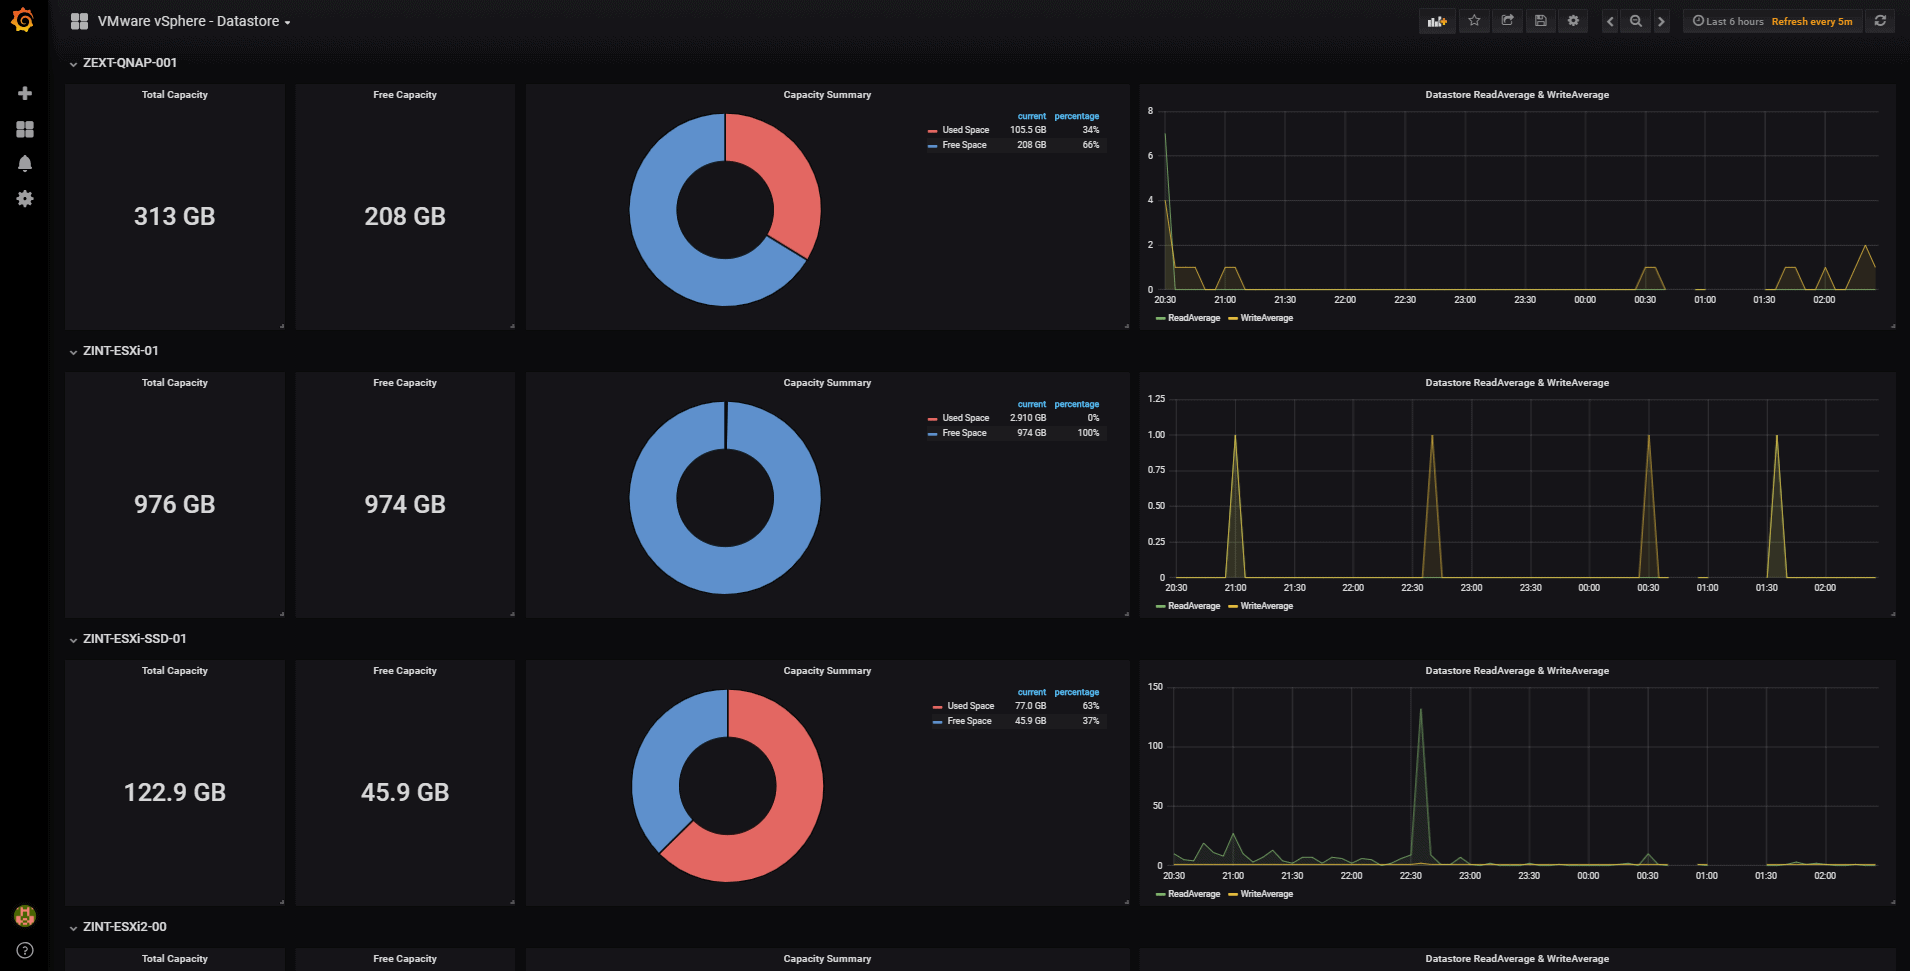
Today we are about to create four fresh Grafana Dashboards within minutes, at the end of the blog, we can have some Dashboards (in plural friends) similar to these:
vSphere Overview Dashboard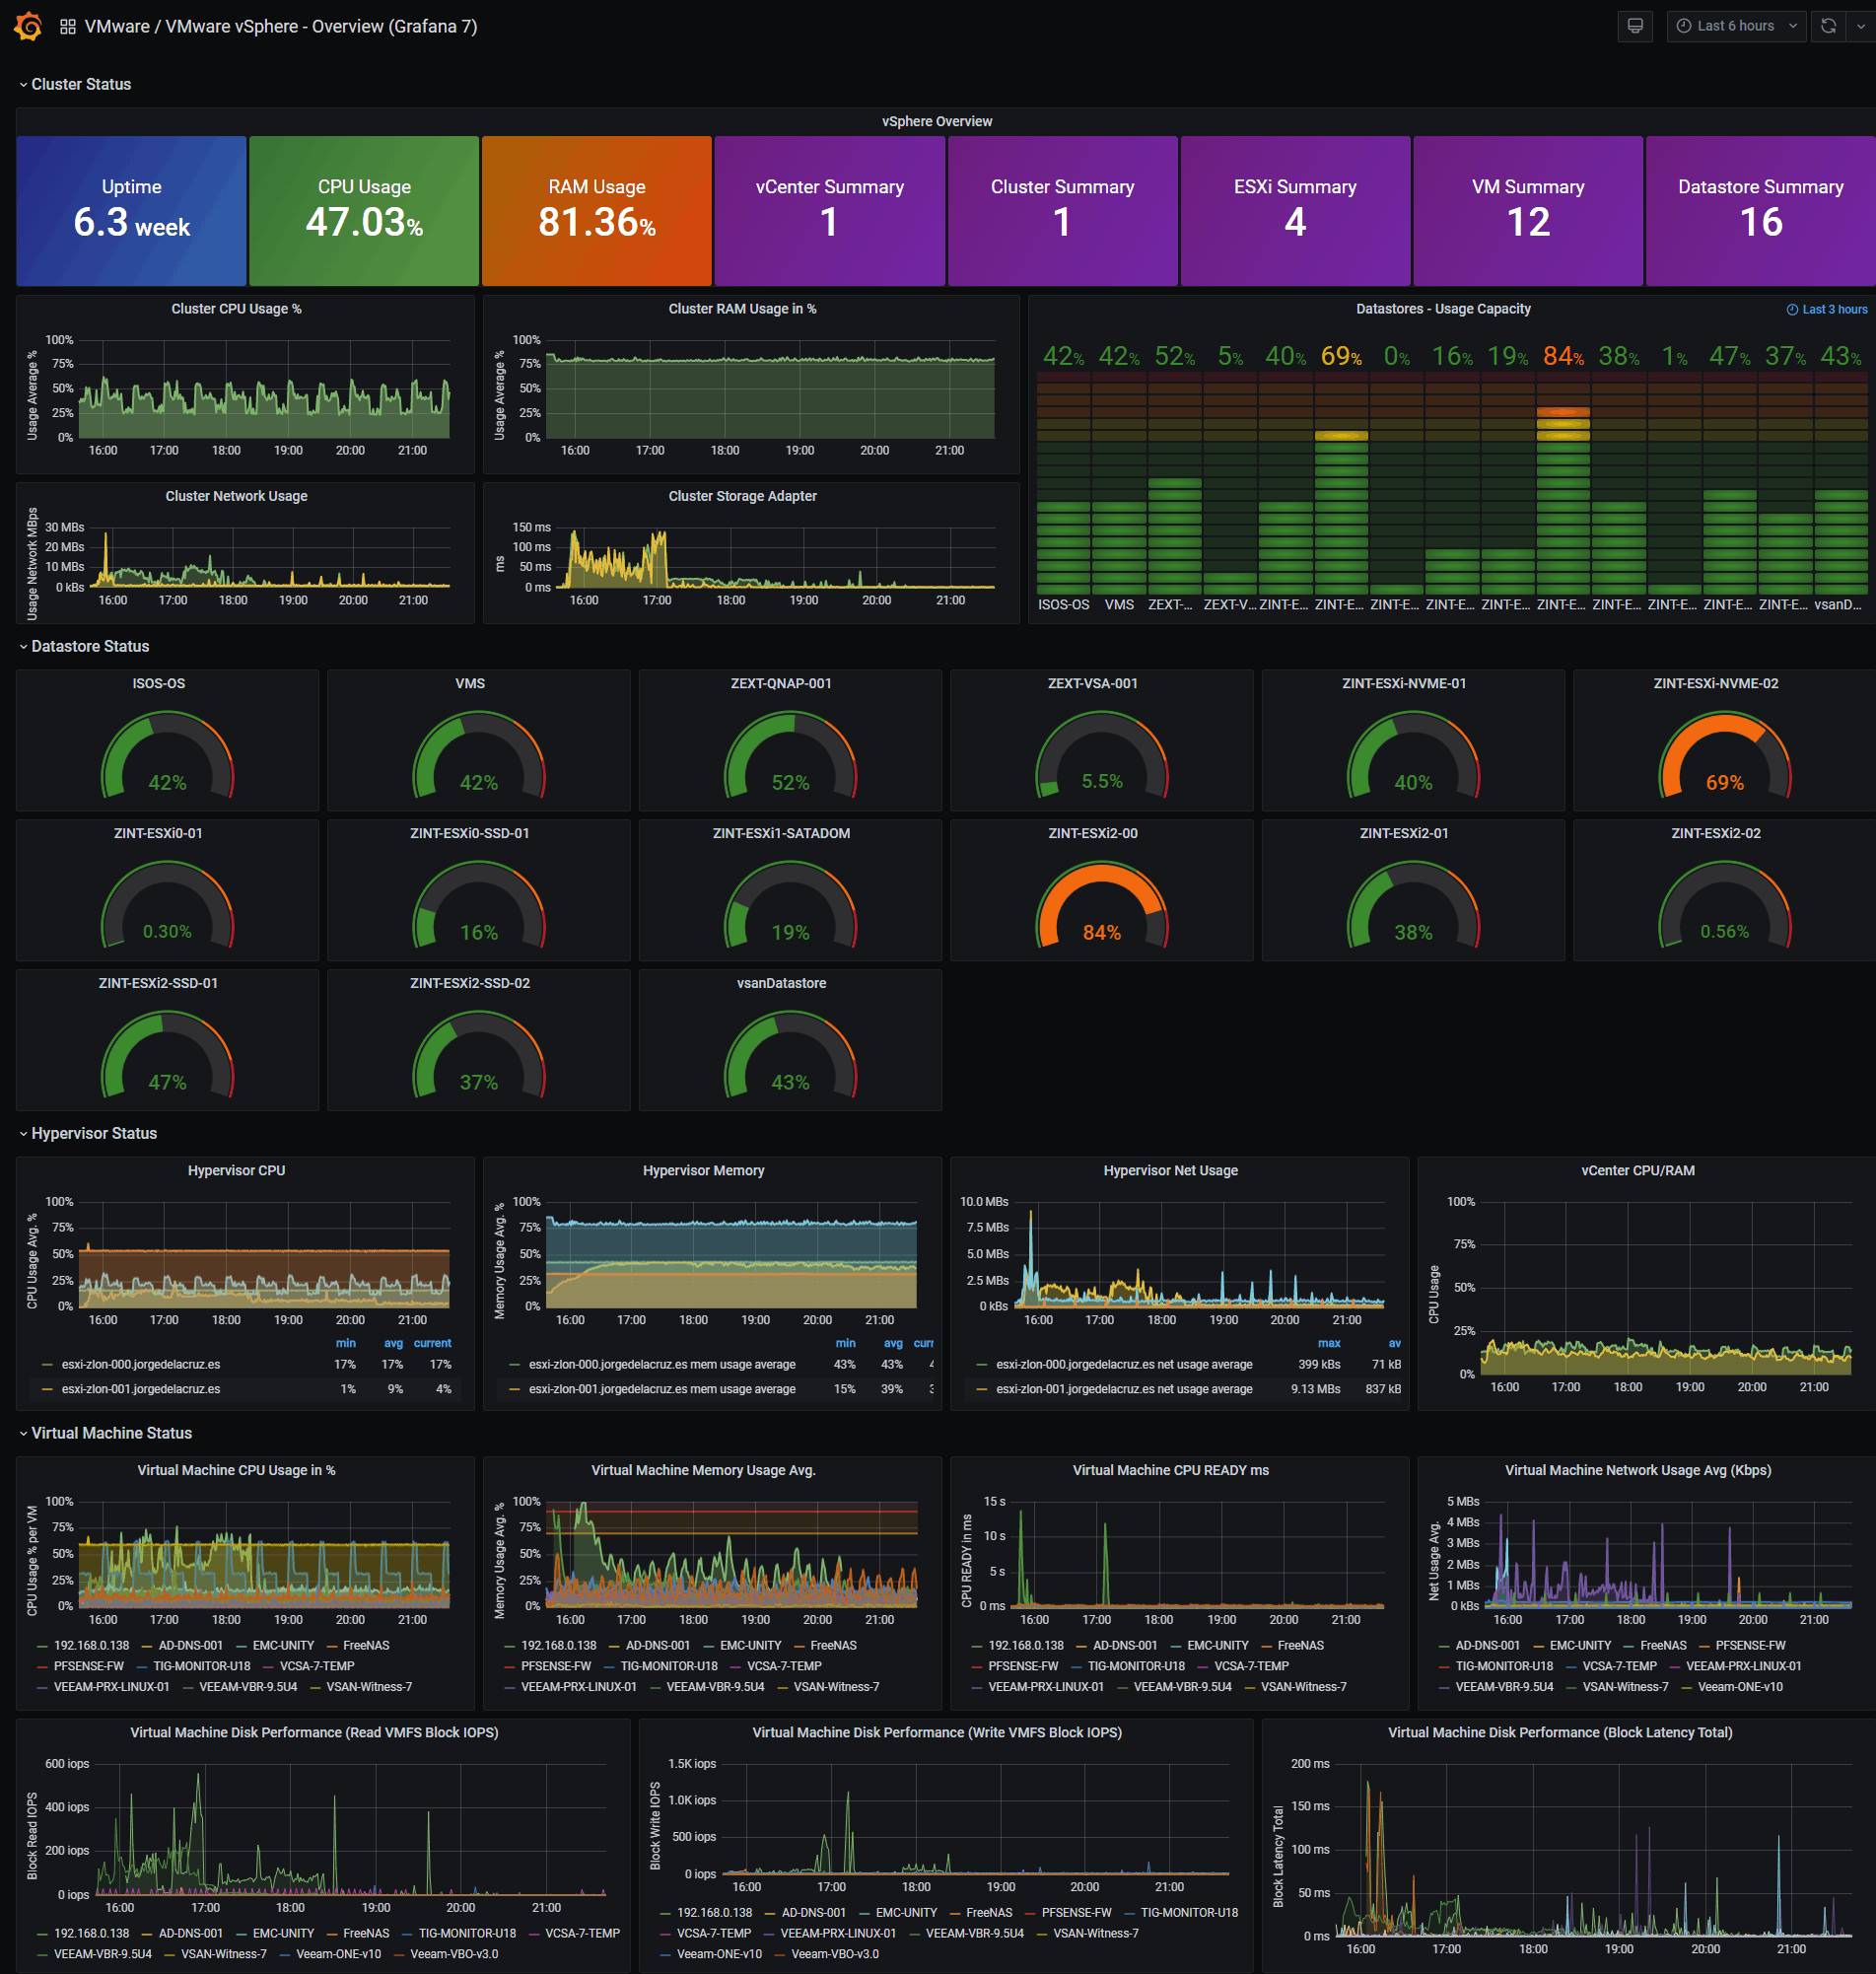
vSphere Hosts Overview Dashboard
vSphere Datastore Overview
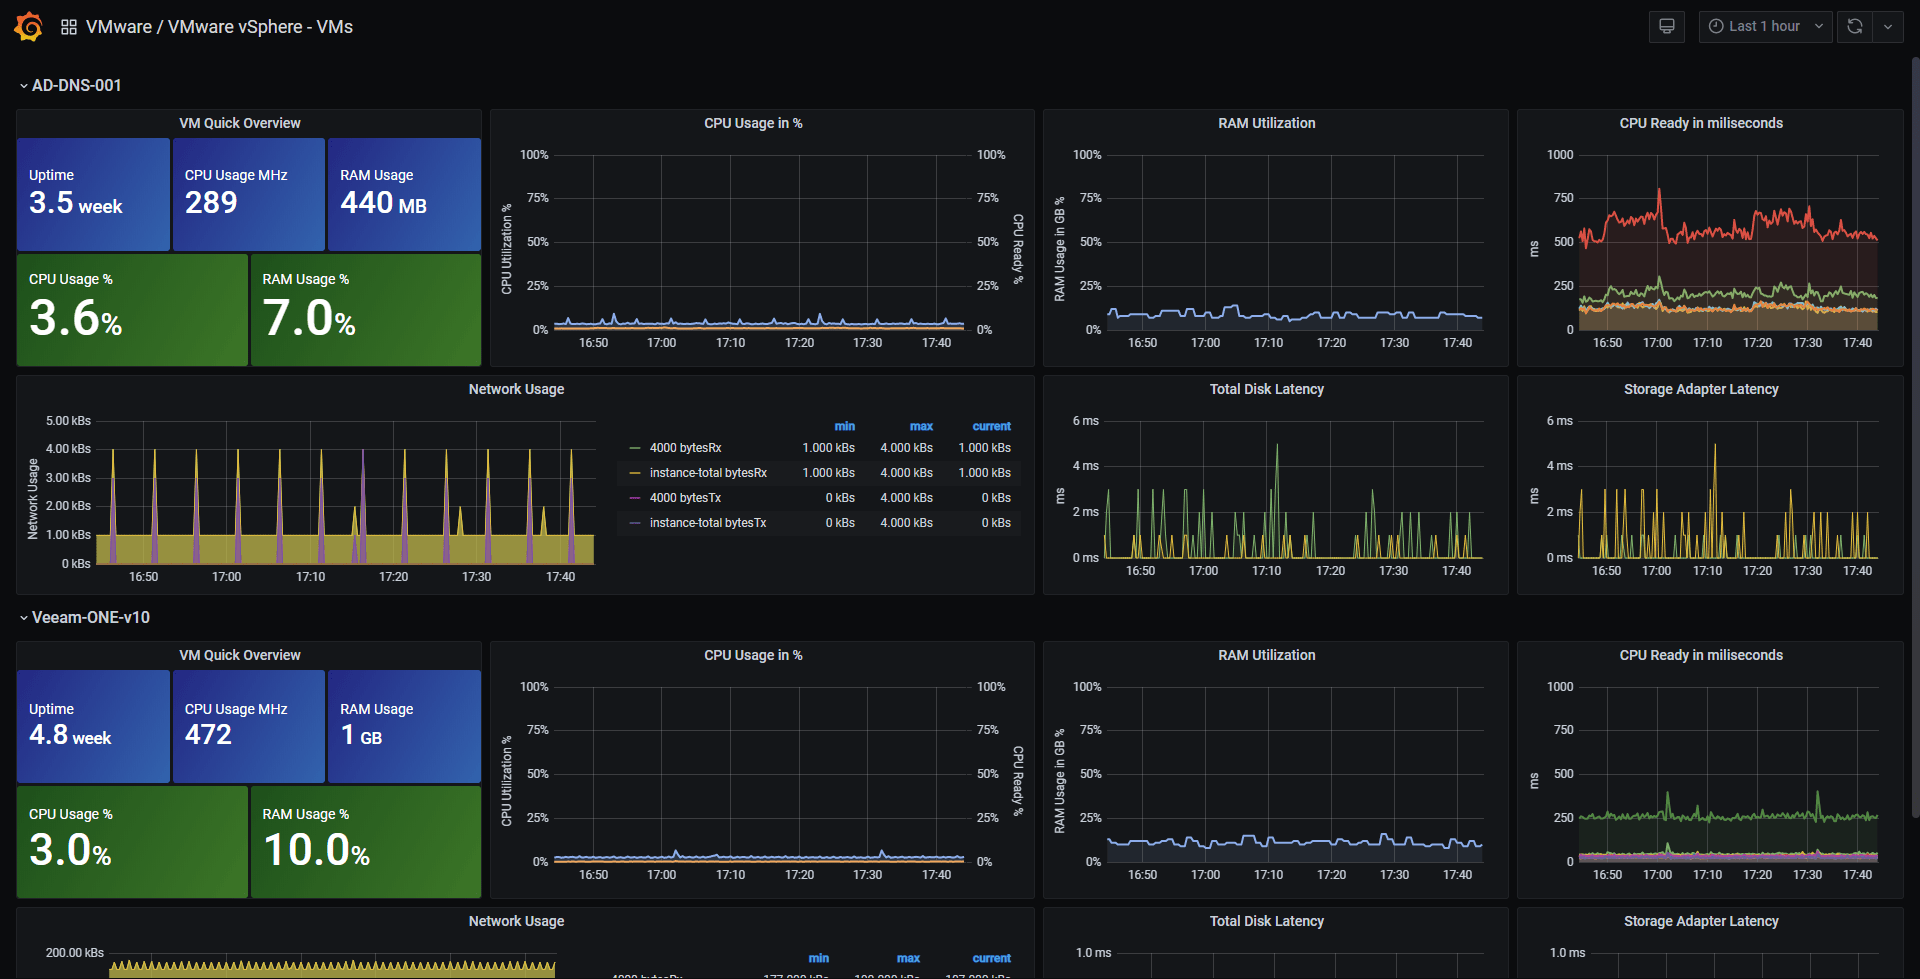
vSphere VM Overview
Telegraf Plugin for VMware vSphere
My friend Craig told me that an official Telegraf plugin for vSphere had been released a few days ago, so the first thing I did was to go to his GitHub and check it out:
The plugin is pure joy, not only because it speaks directly with the vCenter SDK, but also because we can monitor all the following parameters:
- Cluster Stats
- Cluster services: CPU, memory, failover
- CPU: total, usage
- Memory: consumed, total, vmmemctl
- VM operations: # changes, clone, create, deploy, destroy, power, reboot, reconfigure, register, reset, shutdown, standby, vmotion
- Host Stats:
- CPU: total, usage, cost, mhz
- Datastore: iops, latency, read/write bytes, # reads/writes
- Disk: commands, latency, kernel reads/writes, # reads/writes, queues
- Memory: total, usage, active, latency, swap, shared, vmmemctl
- Network: broadcast, bytes, dropped, errors, multicast, packets, usage
- Power: energy, usage, capacity
- Res CPU: active, max, running
- Storage Adapter: commands, latency, # reads/writes
- Storage Path: commands, latency, # reads/writes
- System Resources: cpu active, cpu max, cpu running, cpu usage, mem allocated, mem consumed, mem shared, swap
- System: uptime
- Flash Module: active VMDKs
- VM Stats:
- CPU: demand, usage, readiness, cost, mhz
- Datastore: latency, # reads/writes
- Disk: commands, latency, # reads/writes, provisioned, usage
- Memory: granted, usage, active, swap, vmmemctl
- Network: broadcast, bytes, dropped, multicast, packets, usage
- Power: energy, usage
- Res CPU: active, max, running
- System: operating system uptime, uptime
- Virtual Disk: seeks, # reads/writes, latency, load
- Datastore stats:
- Disk: Capacity, provisioned, used
Impressive! right?, if you do not have yet Telegraf, InfluxDB and Grafana follow these steps (these for Grafana), but for some of you, who already have followed the whole series in Spanish, we only have to update our system to receive the vSphere plugin for Telegraf:
sudo apt-get upgrade
We will be able to see the telegraf package with an update, so we will say yes when it asks us to update:
Reading package lists... Done
Building dependency tree
Reading state information... Done
Calculating upgrade... Done
The following packages have been kept back:
  linux-generic-lts-utopic linux-headers-generic-lts-utopic
  linux-image-generic-lts-utopic
The following packages will be upgraded:
  bind9-host curl dnsutils filebeat influxdb libbind9-90 libcurl3
  libcurl3-gnutls libdns100 libglib2.0-0 libglib2.0-data libisc95 libisccc90
  libisccfg90 liblwres90 telegraf tzdata
17 upgraded, 0 newly installed, 0 to remove and 3 not upgraded.
Need to get 50.8 MB of archives.
After this operation, 17.6 MB of additional disk space will be used.
Do you want to continue? [Y/n] y
Once we have the package installed, we only need to configure the telegraf.conf, let’s create a the next file under /etc/telegraf/telegraf.d/vsphere-stats.conf with the next content inside it:
## Realtime instance
[[inputs.vsphere]]
## List of vCenter URLs to be monitored. These three lines must be uncommented
## and edited for the plugin to work.
interval = "60s"
  vcenters = [ "https://someaddress/sdk" ]
  username = "[email protected]"
  password = "secret"

vm_metric_include = []
host_metric_include = []
cluster_metric_include = []
datastore_metric_exclude = ["*"]

max_query_metrics = 256
timeout = "60s"
insecure_skip_verify = true

## Historical instance
[[inputs.vsphere]]
interval = "300s"
  vcenters = [ "https://someaddress/sdk" ]
  username = "[email protected]"
  password = "secret"

  datastore_metric_include = [ "disk.capacity.latest", "disk.used.latest", "disk.provisioned.latest" ]
  insecure_skip_verify = true
  force_discover_on_init = true
  host_metric_exclude = ["*"] # Exclude realtime metrics
  vm_metric_exclude = ["*"] # Exclude realtime metrics

  max_query_metrics = 256
  collect_concurrency = 3
Of course, we will also have to un-comment all the parameters of the plugin.
Once done, if we are not using a valid SSL CA, or if the CA it is not installed on the Grafana, InfluxDB, Telegraf server, please uncomment this as well:
insecure_skip_verify = true
Another option is to download the SSL from our vCenter to our Telegraf, to trust it:
openssl s_client -servername YOURVCENTER -connect YOURVCENTER:443 </dev/null | sed -ne '/-BEGIN CERTIFICATE-/,/-END CERTIFICATE-/p' >/etc/ssl/certs/vcsa.pem
Let’s finally restart the telegraf service:
service telegraf restart
Verifying that we are ingesting information with Chronograf
The normal thing to these heights, if we have made well all the steps, is that already we are sending information compiled by Telegraf towards InfluxDB, if we realize a search using the wonderful Chronograf, we will be able to verify that we have information:
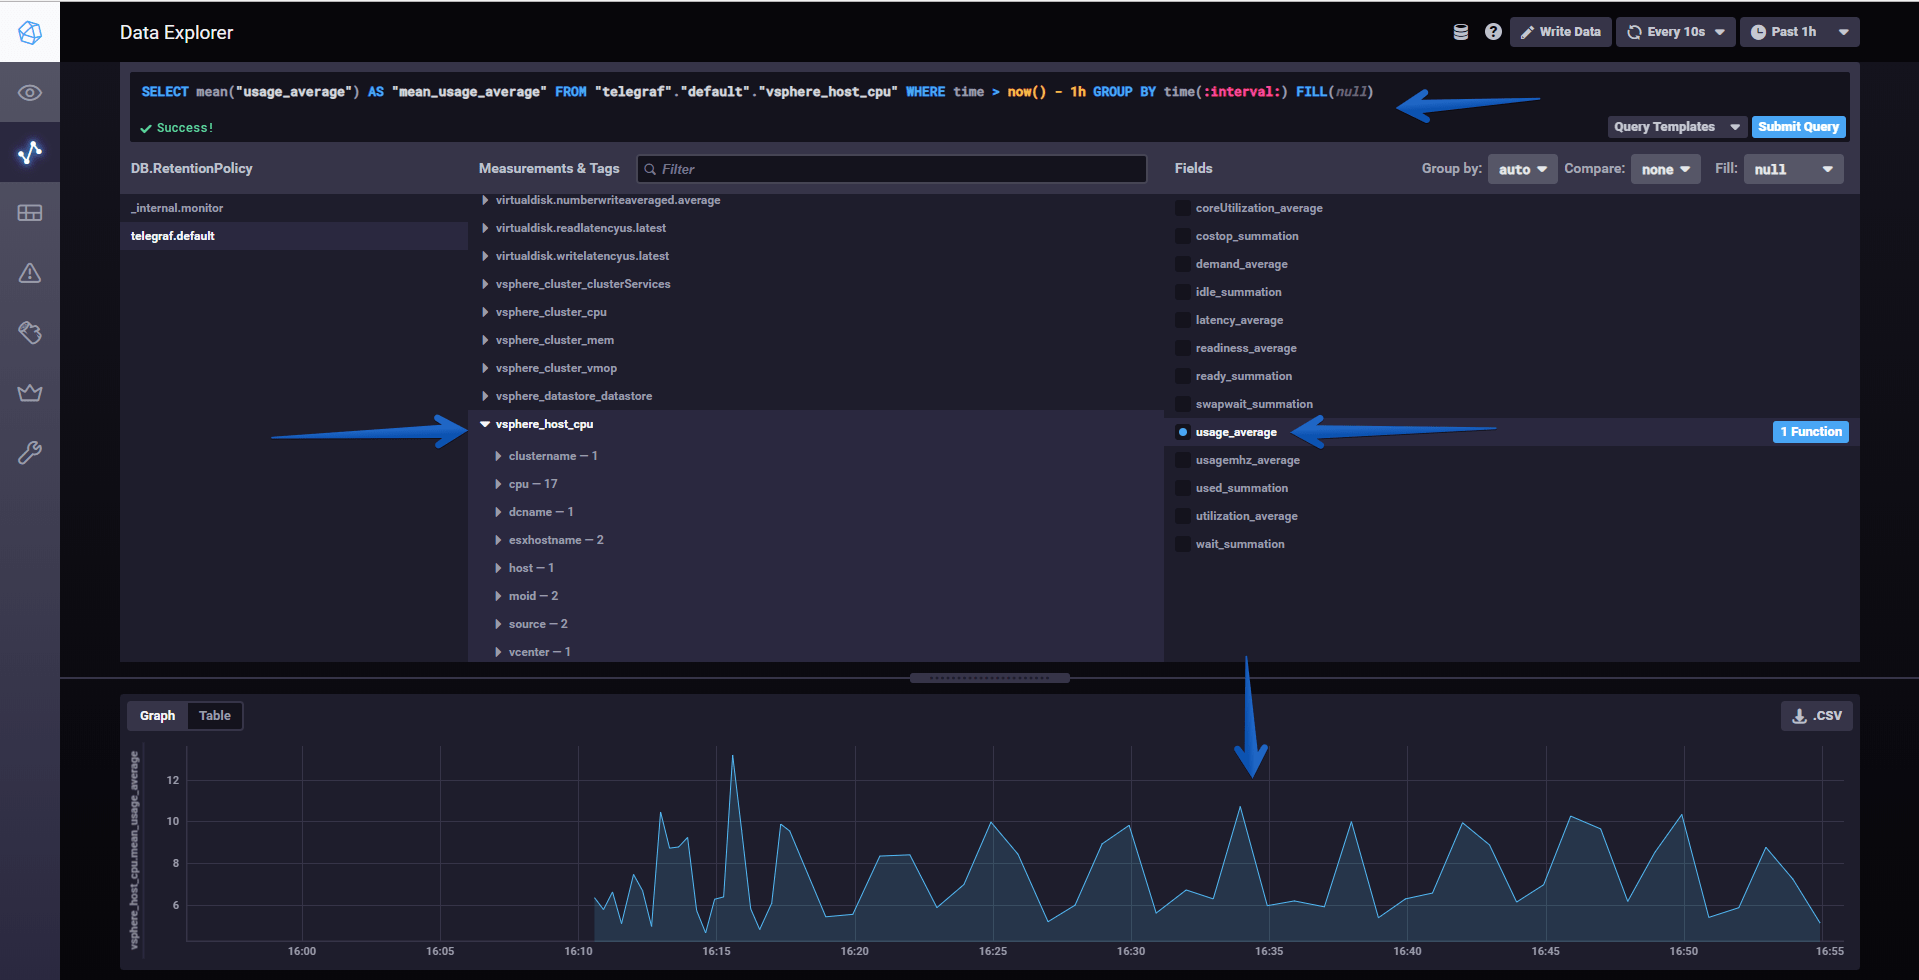 All the variables of this new vSphere plugin for Telegraf are stored in vsphere_* so it’s really easy to find them.
Grafana Dashboards
It is here where I have worked really hard, since I have created the Dashboards from scratch selecting the best requests to the database, finishing colors, thinking which graphic and how to show it, and in addition everything is automated so that it fits with your environment without any problem and without having to edit you anything manually. You can find the Dashboards here, once imported the four, you can move between them with the top menu on the right, now it’s time to download them, or know the ID at least of them:
- Grafana vSphere Overview Dashboard
- Grafana vSphere Hosts Dashboard
- Grafana vSphere Datastores Dashboard
- Grafana vSphere VMs Dashboard
How to easily import the Grafana Dashboards
So that you don’t have to waste hours configuring a new Dashboard, and ingesting and debugging queries, I’ve already created four wonderful Dashboards with everything you need to monitor our environment in a very simple way, it will look like the image I showed you above.
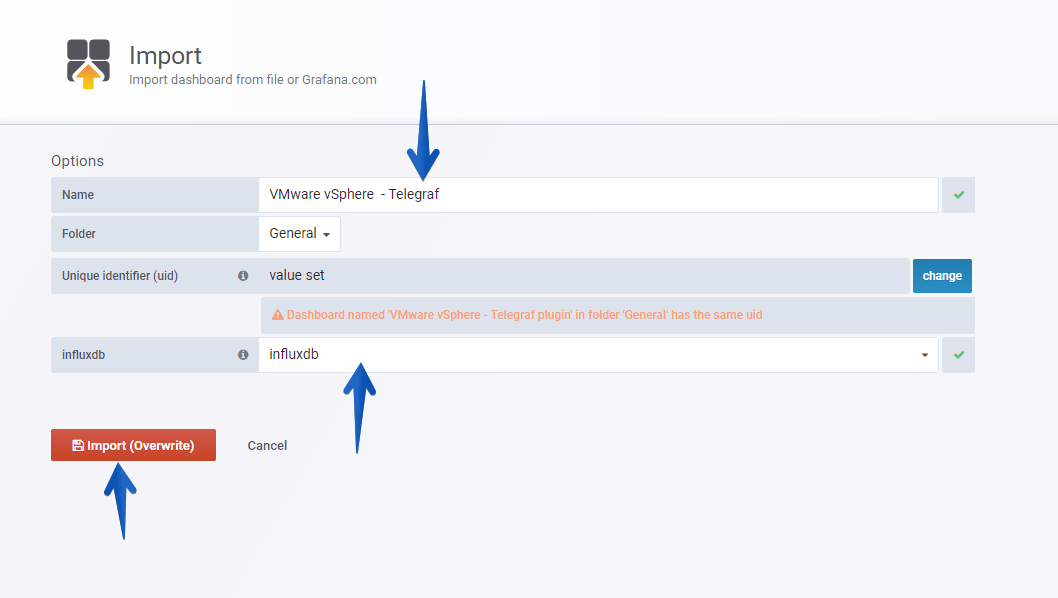
From our Grafana, we will make Create – Import
 Select the name you want and enter one by one the IDs: 8159, 8162, 8165, 8168, which are the unique IDs of the Dashboard, or the URLs:
- https://grafana.com/dashboards/8159
- https://grafana.com/dashboards/8162
- https://grafana.com/dashboards/8165
- https://grafana.com/dashboards/8168
 With the menu at the top right, you can switch between the Dashboards of Hosts, Datastores, VMs and of course the main one of Overview:
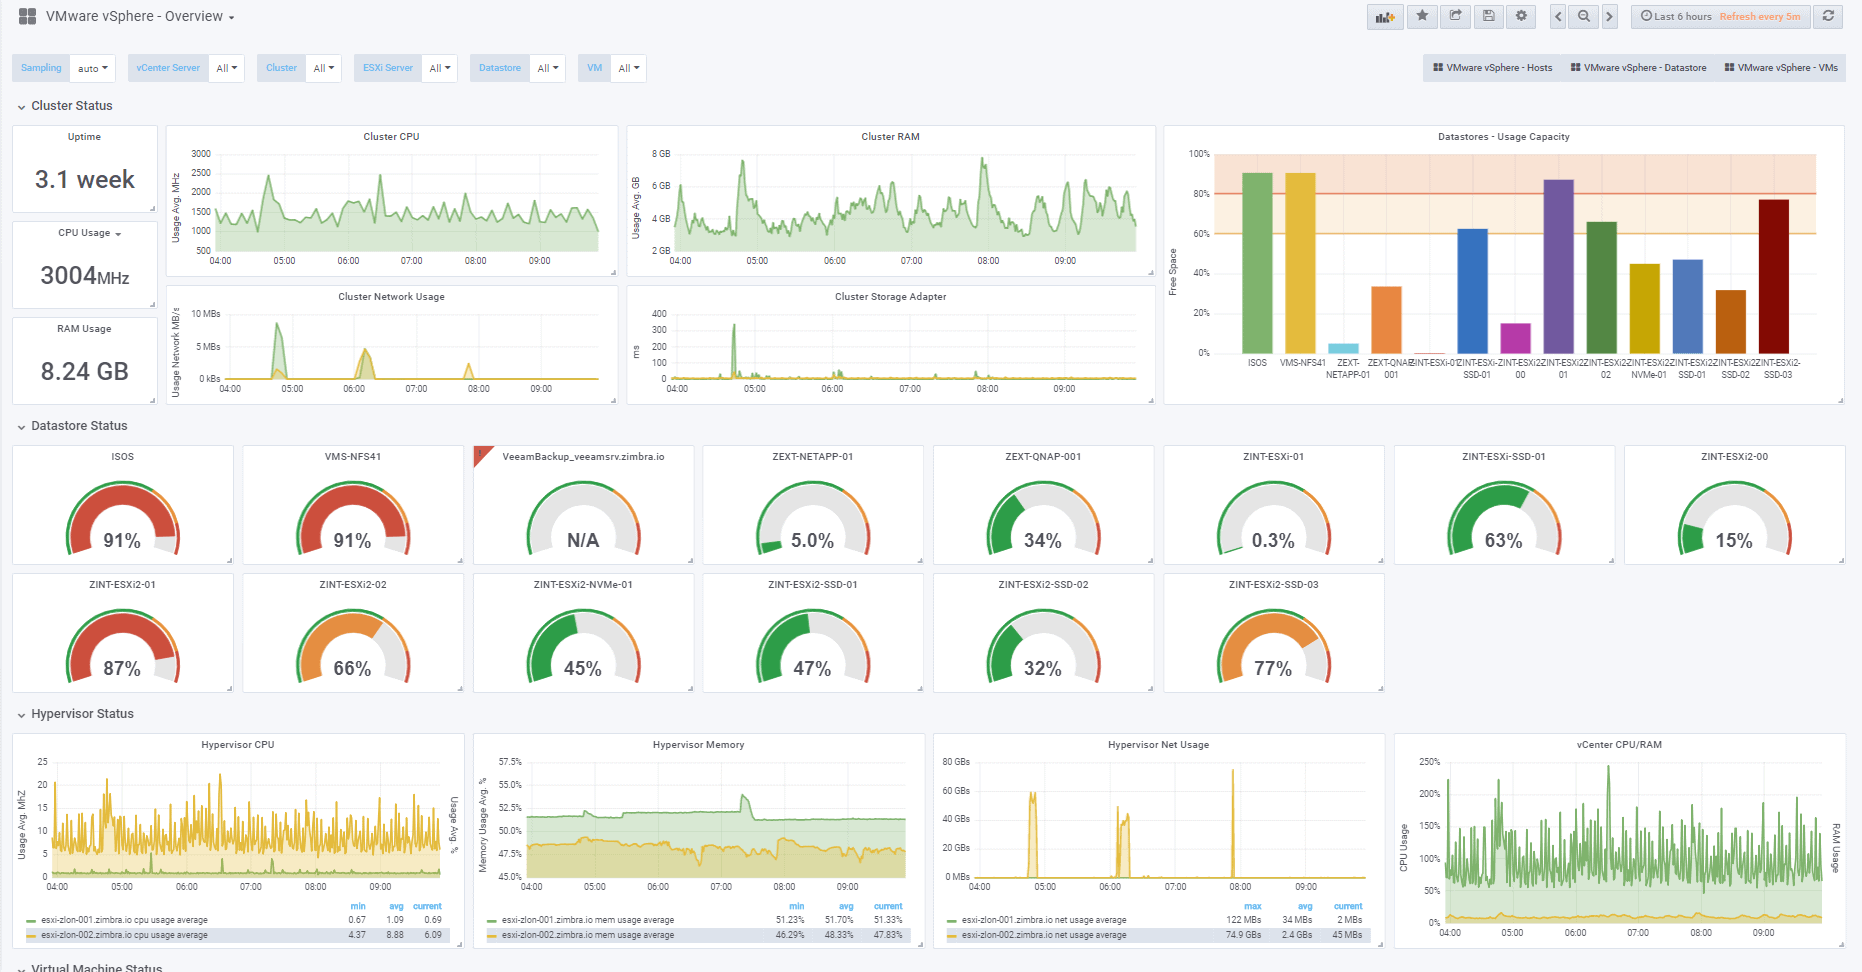 Some of the improvements that this Dashboard includes are the variable selections at the top left, depending on what you select, you will be able to see only the Cluster, ESXi, or VM you are interested in. Please leave your feedback in the comments.
I hope you like it, and I would like to leave you the complete series here, so you can start playing with the plugins that I have been telling you about all these years:
- Looking for the Perfect Dashboard: InfluxDB, Telegraf, and Grafana – Part I (Installing InfluxDB, Telegraf, and Grafana on Ubuntu 20.04 LTS)
- En busca del Dashboard perfecto: InfluxDB, Telegraf y Grafana – Parte II (Instalar agente Telegraf en Nodos remotos Linux)
- En busca del Dashboard perfecto: InfluxDB, Telegraf y Grafana – Parte III Integración con PRTG
- En busca del Dashboard perfecto: InfluxDB, Telegraf y Grafana – Parte IV (Instalar agente Telegraf en Nodos remotos Windows)
- En busca del Dashboard perfecto: InfluxDB, Telegraf y Grafana – Parte V (Activar inputs específicos, Red, MySQL/MariaDB, Nginx)
- En busca del Dashboard perfecto: InfluxDB, Telegraf y Grafana – Parte VI (Monitorizando Veeam)
- En busca del Dashboard perfecto: InfluxDB, Telegraf y Grafana – Parte VII (Monitorizar vSphere)
- En busca del Dashboard perfecto: InfluxDB, Telegraf y Grafana – Parte VIII (Monitorizando Veeam con Enterprise Manager)
- En busca del Dashboard perfecto: InfluxDB, Telegraf y Grafana – Parte IX (Monitorizando Zimbra Collaboration)
- En busca del Dashboard perfecto: InfluxDB, Telegraf y Grafana – Parte X (Grafana Plugins)
- En busca del Dashboard perfecto: InfluxDB, Telegraf y Grafana – Parte XI – (Monitorizando URL e IPS con Telegraf y Ping)
- Looking for the Perfect Dashboard: InfluxDB, Telegraf, and Grafana – Part XII (Native Telegraf Plugin for vSphere)
- Looking for the Perfect Dashboard: InfluxDB, Telegraf, and Grafana – Part XIII (Veeam Backup for Microsoft Office 365 v4)
- Looking for the Perfect Dashboard: InfluxDB, Telegraf, and Grafana – Part XIV – Veeam Availability Console
- Looking for the Perfect Dashboard: InfluxDB, Telegraf, and Grafana – Part XV (IPMI Monitoring of our ESXi Hosts)
- Looking for Perfect Dashboard: InfluxDB, Telegraf, and Grafana – Part XVI (Performance and Advanced Security of Veeam Backup for Microsoft Office 365)
- Looking for the Perfect Dashboard: InfluxDB, Telegraf, and Grafana – Part XVII (Showing Dashboards on Two Monitors Using Raspberry Pi 4)
- En busca del Dashboard perfecto: InfluxDB, Telegraf y Grafana – Parte XVIII – Monitorizar temperatura y estado de Raspberry Pi 4
- Looking for the Perfect Dashboard: InfluxDB, Telegraf, and Grafana – Part XIX (Monitoring Veeam with Enterprise Manager) Shell Script
- Looking for the Perfect Dashboard: InfluxDB, Telegraf, and Grafana – Part XXIV (Monitoring Veeam Backup for Microsoft Azure)
- Looking for the Perfect Dashboard: InfluxDB, Telegraf, and Grafana – Part XXV (Monitoring Power Consumption)
- Looking for the Perfect Dashboard: InfluxDB, Telegraf, and Grafana – Part XXVI (Monitoring Veeam Backup for Nutanix)
- Looking for the Perfect Dashboard: InfluxDB, Telegraf, and Grafana – Part XXVII (Monitoring ReFS and XFS (block-cloning and reflink)
- Looking for the Perfect Dashboard: InfluxDB, Telegraf, and Grafana – Part XXVIII (Monitoring HPE StoreOnce)
- Looking for the Perfect Dashboard: InfluxDB, Telegraf, and Grafana – Part XXIX (Monitoring Pi-hole)
- Looking for the Perfect Dashboard: InfluxDB, Telegraf, and Grafana – Part XXIX (Monitoring Veeam Backup for AWS)
- Looking for the Perfect Dashboard: InfluxDB, Telegraf, and Grafana – Part XXXI (Monitoring Unifi Protect)
- Looking for the Perfect Dashboard: InfluxDB, Telegraf, and Grafana – Part XXXII (Monitoring Veeam ONE – experimental)
- Looking for the Perfect Dashboard: InfluxDB, Telegraf, and Grafana – Part XXXIII (Monitoring NetApp ONTAP)
- Looking for the Perfect Dashboard: InfluxDB, Telegraf, and Grafana – Part XXXIV (Monitoring Runecast)
- Looking for the Perfect Dashboard: InfluxDB, Telegraf, and Grafana – Part XXXV (GPU Monitoring)
- Looking for the Perfect Dashboard: InfluxDB, Telegraf, and Grafana – Part XXXVI (Monitoring Goldshell Miners – JSONv2)
- Looking for the Perfect Dashboard: InfluxDB, Telegraf, and Grafana – Part XXXVII (Monitoring Veeam Backup for Google Cloud Platform)
- En Busca del Dashboard perfecto: InfluxDB, Telegraf y Grafana – Parte XXXVIII (Monitorizando Temperatura y Humedad con Xiaomi Mijia)
- Looking for the Perfect Dashboard: InfluxDB, Telegraf, and Grafana – Part XL (Veeam Backup for Microsoft 365 – Restore Audit)
- Looking for the Perfect Dashboard: InfluxDB, Telegraf, and Grafana – Part XLI (Veeam Backup for Salesforce)
- Looking for the Perfect Dashboard: InfluxDB, Telegraf, and Grafana – Part XLII (Veeam ONE v12 Audit Events)
- Looking for the Perfect Dashboard: InfluxDB, Telegraf, and Grafana – Part XLIII (Monitoring QNAP using SNMP v3)
- Looking for the Perfect Dashboard: InfluxDB, Telegraf, and Grafana – Part XLIV (Monitoring Veeam Backup & Replication API)
- Looking for the Perfect Dashboard: InfluxDB, Telegraf, and Grafana – Part XLV (Monitoring Synology using SNMP v3)
- Looking for the Perfect Dashboard: InfluxDB, Telegraf, and Grafana – Part XLVI (Monitoring NVIDIA Jetson Nano)
- Looking for the Perfect Dashboard: InfluxDB, Telegraf, and Grafana – Part XLVII (Monitoring Open WebUI)
- Looking for the Perfect Dashboard: InfluxDB, Telegraf, and Grafana – Part XLVIII (Monitoring Veeam Data Platform Advanced)
- Looking for the Perfect Dashboard: InfluxDB, Telegraf, and Grafana – Part XLIX (Monitoring Unofficial Veeam ONE Node Exporter)
Note: If facing the error “Task Name: Remote View Manager, Status: The request refers to an unexpected or unknown type” please read the next Blog entry.
Hi Jorge,
I am looking to setup InfluxDB, Telegraf and Grafana – Part XII (Native Telegraf Plugin for vSphere) in our environment.
Could you please provide the full installation and configuration document on windows platform.
Very cool, I set this up this morning on a large instance and your dashboards are beautiful!
I can’t seem to get datastore ‘used’ metrics though, perhaps our vSphere version 5.5 is too old ?
Hello Tom,
On which dashboard exactly? I have updated a new version, it is on the grafana.com site, please download the new version. Let me know exactly, or share some screenshots please 🙂
Thank you for the feedback!
This amazing!
Hi Guys,
i get the error in the telegraf logs,
[input.vsphere]: Error in discovery for 10.1.101.180:7444: ServerFaultCode: Request version ‘urn:vim25/6.7’ and namespace ‘urn:vim25’ are not supported
Im unable to connect to my vCenter any ideas ?
thanks in advance..
Hello David,
Let me do some digging and I will come back to you
Can you please try to do an apt-get upgrade or yum upgrade? It does look you might have some old openssl on the Telegraf side, also, would you mind to please let me know your vSphere version?
This is great work i got it install with no issues trying to update the dashboards to allow another search field data center i am having no luck to find that key value any ideals ?
Hello James, which Dashboard, and which panel trying to update? Is that DC inside the same VC?
Hi Jorge,
thanks for the blog article.
You mean “insecure_skip_verify = true” instead of “insecure_skip_verify = false”, right ?
All 4 dashboards. And yes the DC is in the same Vcenter. we have multiple vcenter with multiple DC by having this searching and filtering would be a great added value.
Yes Florian, let me fix it on the blog 🙂 Thanks!
Definitely, let me dig into it and I will let you know when the grafana.com it is updated.
Thank you!
Everything datastore related doesn’t work.. even with the newest dashboards.. on vCenter 6.7 and ESX 6.5 U2.. any ideas?
Hi Wesley, as mentioned by you on Slack, uncomment the datastore section, like this:
datastore_metric_include = []Best regards
Hey Jorge,
First, thank you for your awesome hard work!
I am getting errors in telegraf from the vsphere plugin.
[input.vsphere]: Error in discovery for : Post https:///10.1.0.43/sdk: http: no Host in request URL
Would you happen to know what the error means? I have not found anything.
HI Again,
Please can can i get some advise, I have managed to get all working (Very Awesome) but now im only getting certain datastore back,
Its only pulling -7 through but i have 16 DS,
this is what is in my config
   ## Datastores

   datastore_metric_include = [] ## if omitted or empty, all metrics are collected

   # datastore_metric_exclude = [] ## Nothing excluded by default

   # datastore_instances = false ## false by default for Datastores only
any advice would be appreciated ..
Thanks
David
Hello Sam,
Can you ping and curl that URL? It is that your vCenter right?
thank you
Hello David,
Are the ones missing NFS? Can you please try to increase the timeout, also the max_query_objects and max_query_metrics, and on Grafana try to show a wider range, like the last 3 hours or so. Let us know
Hi Jorge,
Thanks for the reply, I have done as you have asked, i have also removed some metrics and its actually getting worse less metrics are getting pulled in and yes it was NFS datastore not being pulled in… this is what i have changed in my Config..
with these change below i have all the datastore showing now but just no metrics
## Default data collection interval for all inputs
interval = “60s” –changed from 10
## This controls the size of writes that Telegraf sends to output plugins.
metric_batch_size = 10000 — changed from 1000
# ## number of go routines to use for collection and discovery of objects and metrics
collect_concurrency = 5
discover_concurrency = 3
# ## set to 64 for vCenter 5.5 and 6.0 (default: 256)
max_query_objects = 1000 changed from 256
# ## set to 64 for vCenter 5.5 and 6.0 (default: 256)
max_query_metrics = 1000 changed from 256
any help would be much appreciated
thanks
David
Hi Jorge,
Great work on this! Thank you! I was able to get it up and running quickly thanks to your documentation.
The only issue that I have is that NONE of my Datastore are showing. They are all iSCSI and here’s my current settings per your documentation:
## Datastores
datastore_metric_include = [] ## if omitted or empty, all metrics are collected
# datastore_metric_exclude = [] ## Nothing excluded by default
# datastore_instances = true ## false by default for Datastores only
If you can give me some assistance I would appreciate it.
Thanks,
Edward
Hi Edward, can you please change the timeout to something higher, and maybe the:
[agent]## Default data collection interval for all inputs
interval = "60s"
Will make the trick too
Jorge,
I’ve changed the timeout to “100s” and have updated the interval to “60s”, restarted the necessary services to reflect the changes and still NO info for all of my Datastores.
Any other recommendation that you think I should change or look into?
Just wondering, did your Dashboard work right off the bat or did you have to tweak it and made some changes to get your Datastore readings? If so, please let me know what other settings you might have updated to get the Datastore to show.
Thanks,
Edward
Hi Edward,
It does work out of the box with me, here are my config, just datastore and the tweaks:
# Configuration for telegraf agent[agent]
## Default data collection interval for all inputs
interval = "60s"
## Rounds collection interval to 'interval'
## ie, if interval="10s" then always collect on :00, :10, :20, etc.
round_interval = true
[[inputs.vsphere]]
## Datastores
datastore_metric_include = [] ## if omitted or empty, all metrics are collected
# datastore_metric_exclude = [] ## Nothing excluded by default
# datastore_instances = false ## false by default for Datastores only
# ## timeout applies to any of the api request made to vcenter
timeout = "180s"
Then on the top of Grafana I select like 1 hour, 3 or 6 , it all does work, can you check on your chronograf if you are indeed sending any data at all? And review on tail -f /var/log/telegraf/telegraf.log that not errors appear?
thank you!
Hi Jorge,
I’ve made all the changes you’ve recommended and unfortunately Datastore is still not showing.
Only errors that I see is this:
Oct 05 09:14:31 vm-stats telegraf[1110]: 2018-10-05T13:14:31Z W! [outputs.influxdb] when writing to [http://localhost:8086]: database “telegraf” creation failed: Post http://localhost:8086/query: dial tcp 127.0.0.1:8086: connect: connect
The rest of the Dashboard is working perfectly other than the Datastore status/section.
If you can think of anything else for me to look into that would be much appreciated.
Thanks,
Edward
Great work!
Question: how can we add more than one Vcenter?
Can you explain what the syntax is please, I cannot find that anywhere, I have 2 vcenters.
Something like:
vcenters = [ “https://vcenter1.local/sdk” ] [ “https://vcenter2.local/sdk” ]
Or maybe like this?
vcenters = [ “https://vcenter1.local/sdk” “https://vcenter2.local/sdk” ]
How is it done???
Thanks in advance!
Hello,
I have not 2 vcneters to try, but it should be as it always is on Telegraf:
vcenters = [ "https://vcenter1.local/sdk", "https://vcenter2.local/sdk" ]Cna you please try it?
Hello Edward, what is that vm-stats, it is maybe another plugin you had? I will recommend taking a copy of the telegraf.conf to telegraf.conf.old then cp the telegraf.conf.dpkg-dist to telegraf.conf, edit the basics of InfluxDB if needed, and then under telegraf.d create a new vsphere.conf, where you put just your new config directly from this blog, to see if that works.
Jorge,
“vm-stats” is the hostname.
I’ll copy the telegraf.conf and give that a shot. I’ll let you know how it goes.
Hello,
Thanks for the awesome guide!
Is there anyway to get used percentage of the Virtual Machine’s CPU?
Hello junior,
if you add the value cpu.usage.average to the config on the VM part, restart telegraf, and download the new version of the Dashboard https://grafana.com/dashboards/8168/revisions you will see it on %
“Hello,
I have not 2 vcneters to try, but it should be as it always is on Telegraf:
vcenters = [ “https://vcenter1.local/sdk”, “https://vcenter2.local/sdk” ]
Cna you please try it?”
Hey Jorge,
Thanks, I have configured two Vcenters and this works just fine, thank you.
” # # Read metrics from VMware vCenter
[[inputs.vsphere]]
# ## List of vCenter URLs to be monitored. These three lines must be uncommented
# ## and edited for the plugin to work.
vcenters = [ “https://192.168.1.1/sdk”, “https://192.168.1.2/sdk” ]
username = “User@Domain”
password = “P@$$w0rd”
#
# ## VMs
# ## Typical VM metrics (if omitted or empty, all metrics are collected)”
Thank you Marcel for the test! Appreciated
Hi,
how is it possible to exclude datastore metrics?
i want to exclude all local datastores which named all “hypervisorname-local”.
i tried datastore_metric_exclude = [“*-local”] but i still collect metrics for these datastores.
Hello Florian,
On Grafana, on the Datastore variables I am already not including the Veeam ones, look at them at the moment it is a regex which says /^(?!VeeamBackup_)/ add your own, so at least Grafana doesn’t show them.
I will investigate how to not ingest the data from Telegraf.
Jorge it would be all 4 dashboard each VC might have multiple DC.
Thanks a lot Jorge for your excellent work! I have couple of queries:
1. Cluster variable Filter is not working for me. Doesn’t matter which cluster I choose, it shows all the hypervisors.
2. It is taking ages to load the graphs for Hosts view as I have 100s of hosts.
Any help with the same will be appreciated man 🙂
Hi Jorge,
having more vcenter, would it be possible to have dashbord for everyone?
yeah i am testing right now i have a vcenter with 300 host and grafana keep crashing because of java. i was looking at trying to convert it to elastic search because your able to cluster for free.
jorgeuk
6th October 2018 at 4:07 pm
Hello junior,
if you add the value cpu.usage.average to the config on the VM part, restart telegraf, and download the new version of the Dashboard https://grafana.com/dashboards/8168/revisions you will see it on %
Thank you! Is it possible to get live values instead of average?
Hi Jorge, please can i ask how to connect to two vCenter on different username and password..
thanks in advance..
Why are the units for disk latency “Kbps”?
Was anyone that had Datastores not being picked up ever fix this issue? I’ve tried all the things mentioned in the comments but it still does not display.
Absolutely top notch work! Thanks so much for sharing. Those dashboards must have been a huge amount of effort! Thanks to the community for the vmware plugin also! This stuff is amazing and helps some many people.
Thanks Darragh! I am trying my best, I hope they do help, I have seen the vSphere Dashboard on so many different places and that always humble me.
Have a great day
Hello,
I have a problem. I created an alarm on Grafana but it gave this error:
“Template variables are not supported in alert queries.”
Do you have a solution?
Thank you!
Hey Jorge, thanks for this! Any chance you would be interested in helping make a top XX vm dashboard? Sorta like a NOC view of vm’s.
Hi Rob,
Thanks for the comment, sounds very interesting, I will work on it and should be ready soon.
Cheers!
Hello Jorge,
Many thanks for the articles and the dashboards are just working awesome.
I can see the data for all the dashboards but the DATASTORE dashboard does not pull up any information for some reason? Did you see this before?
I can see the data for the datastores for the Overview but not the actual datastore ones also the datstore data does not seems to refresh as i have deleted couple of old datastores but they still show up?
Thanks,
Pavan
Hello Pavan,
I think it is a known issue, so I will check when I go back home and try to make it work properly. I have not found yet why this doesn’t work in some cases and works on my case for example
Hello Jorge, Any luck with the datastore issue?Thanks
I had the same issue with the blank Datastores dashboard, the fix for me was to install the Grafana Pie Chart Panel as it’s not installed by default.
Thank You very much for an excellent blog post, and Your work on the Grafana Dashboards. The problem with the blank Datastores dashboard was solved for me by installing the Pie Chart Panel as noted above.
Hey, great post, looks really neat and useful.
Just one question, what specs would you recommend for a VM running the Ubuntu Server? I’m wondering how much RAM it will need, and if 2 vCPU’s would be suficcient?
Thanks in advance!
Hello,
Not sure how many VMs and hosts and datastore you monitor, but 2vCPU, 6GB RAM, 100GB disk to start it is more than enough.
Hi Jorge,
Thank you so much for this fantastic page. Very helpful very simple. was able to do the basic dashboard as a novice in few hours time.
One thing I noticed on the Hosts Dashboard is the memory statistics section is actually using the percentage counters in GB based graph & counter. I changed the format type percentage to get it corrected.
Hi Jorge,
I updated telegraf to 1.10.0 and noticed that after a while my datastore metrics would disappear. I don’t think its a bug in the vsphere plugin but possibly a change to how the metrics are collected. I can’t figure out what to change if anything.
Have you seen anything similar?
Hi, love the boards!!!! great work. i have the Datastore problem but i also have an issue on the VM’s board. It finds all my vm’s and lists them, but when i expand each one it comes back stating no data points available. wondering if i am just missing an easy setting. any help would be awesome! thanks in advance!
Hello Jesse,
For the Dashboards issue, the solution was to install the Pie Chart Panel plugin on Grafana, regarding the VM issue, do you have data already? I mean, on for example the main dashboard do you see stuff under the VM section?
Hi Jorge,
Great work on this! Thank you so much for your effort.
We manage to get all working and it’s really awesome.
However, I got a question to ask.
On the vCenter messages (logs), we can see there was a Task Message:
“Task Name: Remote View Manager, Status: The request refers to an unexpected or unknown type, Initiator: (our local username), and its getting on every seconds/minutes.
It this because of the pulling of data?
Thank you for your reply. i was able to install the pie chart plugin after reading through comments on here before i posted, still no luck unfortunately for the data store stuff. As for the VM dashboard saying no data points, i AM seeing vm info on the overview dashboard, so that confuses me.
Hi Jesse,
Thanks for coming back, umh, have you make sure on the top right you have selected different times, like today so far, or this week, etc? Nothing at all?
Changing the time fixed the VM issue and its now showing data. thank you! still no luck on the datastore side.
Can you post a picture, upload it somewhere and paste it? 🙂
Can you get to this: https://imgur.com/a/CICB7Kd
Yes! Can you try to change on the top right for this month, and maybe narrow on the top left the search a bit?
Excellent project. Congratulations. I just identified a problem in the log:
[inputs.vsphere] Metric name cpu.readiness.average is unknown. Will not be collected
I don’t know why…
Hi Jorge
i’ve this error on my vcenter,any idea how to solve this ?
Task Name: Remote View Manager, Status: The request refers to an unexpected or unknown type
Hello, where is this error exactly? Telegraf log? Which vCenter version do you have, and have you tried with a different user to authenticate?
Hi Jorge,
I am also seeing the same issue as Herry Kurniawan.
The error is seen inside vCenter 6.7. My previous setup was working without issue on vCenter 6.5.
https://imgur.com/a/Q8opJ7l
I will have a proper look around tonight, I appreciate everything you have done, you have saved me alot of time with the work you have done here, Thank you!
Hi Jorge,
thanks first of all for this great project and sharing all the information.
We are running a huge VDI environment with CPU overcommitment. We are using the overcommitment ratio as one of our capacity indicators. I working now to add to the dashboard a cluster overview with a summation of all vCPUs in a Cluster. So lets assume we have 500 VM with each 3 vCPUs then I would like to see 1500 vCPUs.
Unfortunatelly I wasn´t able to get this. Is that possible? If yes, could you tell me how to achieve that?
Regards
Thomas
Hi Jorge,
first of all thanks for sharing this fantastic work!!
I still have a question where I hope you can help us. We are running a huge VDI environment with CPU overcommitment. I would like to count the total amount of assigned vCPUs in a Cluster. So lets assume we have 1000 VMs with each 2 Cores in a VMWare Cluster I would like to see the Number 2000.
Is there any way to achieve that?
Regards
Thomas
Hello Stuart,
Does that error happen once you enabled the telegraf agent to retrieve your information? I have 6.7 U1 and I am not seeing this error. Let me search more about it.
Hi Thomas,
I was trying the same, the guys from Grafana told me it is not possible using Influx as a backend, so I will keep trying and see how we can achieve this, it should be a simple way. I will let you know, now that I see that there is more people interested in seeing the total counters of elements.
Hi,
How to delete old VM’s that are not in use anymore?
Great project!!
Hello, this will make the trick:
DROP SERIES FROM /.*/ WHERE “vmname” = ‘AD_restore’
Will work as well if you try to delete some storage or host, etc, just change the relevant data:
DROP SERIES FROM /.*/ WHERE “your-tag” = ‘tag-value-to-delete-data’
Best regards
Hi,
it’s amazing!!! good job.
I’ve a very big farm, 10 VC, 400 DS a many many VM. When set under monitoring all vCenter the dashboard became very slow to load. There are any trick to optimize the system and improve the performance?
regards
Getting this error in vCenter now:
Task Name: Remote View Manager, Status: The request refers to an unexpected or unknown type
vim.event.taskevent. its like multiple times a minute.
Hi guys,
Please update your telegraf version to the latest:
wget https://dl.influxdata.com/telegraf/releases/telegraf_1.10.1-1_amd64.debsudo dpkg -i telegraf_1.10.1-1_amd64.deb
Or if in RedHat:
wget https://dl.influxdata.com/telegraf/releases/telegraf-1.10.1-1.x86_64.rpmsudo yum localinstall telegraf-1.10.1-1.x86_64.rpm
Then /etc/init.d/telegraf restart, that’s it 🙂
Hello Stuart,
Look for my previous comment to find the solution
Hello Herry,
Look for my previous comment to find the solution
installed just fine, but dont see a telegraf to restart in /etc/init.d/ thoughts?
Try
service telegraf restartwas able to restart the service and the alerts stopped, but now grafana isnt pulling any info since i ran the update. thoughts? thank you for your help on this by the way.
Umh, this looks like the telegraf.conf was replaced, and you should configure it with your details again, check if that is true.
all my details are still in the telegraf.conf file…..
Umh, anything under telegraf.log about errors or so? Have you tried service telegraf restart?
i did, at first it was unable to reach vcenter, i got that fixed. now its saying that it is querying and returning objects, but still not seeing anything in grafana dashboards. I have rebooted both servers multiple times. thanks for your help again.
Hi! Jorge!
Do you know why on the cluster status the RAM Usage is not reporting correctly? also the Cluster RAM?
If im reading it correcly maybe its getting in from just one host instead of the actual cluster.
BTW I saw that you reply to somebody about Slack do you have a chat there?
Thanks for you excellent contributions!!!
Hi! Jorge under Cluster Status seems like the RAM Usage and Cluster RAM are reporting for one host instead of the wholes cluster any ideas?
Also do you have a Slack Channel? I saw you replied to a user about it….
Great work on all this!
Hi Jesse,
On the top right have you tried to change the time? It should work out of the box, do you see data on chronograf?
Hello Francisco,
I do not have any Slack myself, but I am part of the vExpert, and Grafana in case you want to reach me there. Or try jorgedlcruz on Skype
You can find now on Grafana.com and on the github a new version of the dashboard, give it a go 🙂
I have changed thte time around with no luck. what is chronograf?
On the same blog post, you can find a small section called Verifying that we are ingesting information with Chronograf, which you can install simply by following the next steps https://docs.influxdata.com/chronograf/v1.7/introduction/installation/
Let me know, could you paste some pictures or so?
Hi all,
i have this error:
[inputs.vsphere]: Error in plugin: While collecting cluster: ServerFaultCode: This operation is restricted by the administrator – ‘vpxd.stats.maxQueryMetrics’. Contact your system administrator.
and also with [email protected] the error happen
any idea?
thanks
Weird, try the next:
https://communities.vmware.com/thread/534919
Seems more as a VMware issue rather than Influx or anything. Let me know
i make the change in advanced setting of vCenter “config.vpxd.stats.maxQueryMetrics -> 1” but after the reboot, the error was not resolved.
this is the telegraf config (last version1.10.1):
[agent]
interval = “30s”
round_interval = true
metric_batch_size = 1000
metric_buffer_limit = 100000
collection_jitter = “0s”
flush_interval = “10s”
flush_jitter = “0s”
flush_buffer_when_full = true
quiet = false
debug = true
hostname = “”
[[outputs.influxdb]]
urls = [“http://127.0.0.1:8086”]
database = “vcenter”
timeout = “20s”
[[inputs.vsphere]]
vcenters = [ “https://vcenter/sdk” ]
username = “[email protected]”
password = “…..”
collect_concurrency = 4
discover_concurrency = 2
insecure_skip_verify = true
# Read metrics from one or many vCenters
……
That is odd, what vSphere version are you using ? What happens if you try to create a new vsphere user with all the admin privileges including child objects, etc?
the vsphere version are 6.7 last update/patch, and with new admin user the error happen again.
with the previous version 1.9 of telegraf the anomaly disappear… can’t be a telegraf issue?
thanks
Hi Jorge
Excellent dashboard! All works fine except the VMs, it has all the names of my VM’s but all panels are showing NA or No datapoints. this is on latest versions of telegraf and VCenter 6.7. Any idea what can be wrong? Used you config in telegraf.
thanks
jan
Hello JanPT,
Which Dashboard does fails for you? The VM one? Do you have selected on the top right your current time, like the last hour or so?
Here is my new config, try it:
[[inputs.vsphere]]## List of vCenter URLs to be monitored. These three lines must be uncommented
## and edited for the plugin to work.
vcenters = [ "https://YOURVCSA/sdk" ]
username = "[email protected]"
password = "YOURPASS"
vm_metric_include = []
host_metric_include = []
cluster_metric_include = []
datastore_metric_include = []
datacenter_metric_include = []
max_query_objects = 256
max_query_metrics = 256
timeout = "1800s"
insecure_skip_verify = true
Hi Jorge
Yes, the VM one. After changing to your new config and selecting last hour it works.
Many thanks for your help and for the great dashboards.
Un saludo
jan
Awesome, will edit it on the post 🙂
Hi Jorge
thre is one issue.. if a VM is named with an underscore i won’t show up (i.e 5209_SMR) if i change it to 5209.domain.com it works.
saludos
jan
Hello JanPT, that is because under the settings, variables I’ve excluded them, you can go here and remove my regex, why did I do this? Because the Veeam Datalabs tests register and unregister VMs with _ so I had like hundreds 😛 :

HI,
i installed everything and i can see metrics in chronograf, but in Grafana it shows “no data points” on all dashboards.
any idea?
Hello,
The only thing I can think of might be the time on the top right corner, change that to the last 24 hours, or so. And the datasource, which I am assuming you selected properly while importing them
So a remote telegraf collector pointed at ur Vsphere cluster?
I have always used local telegraf agent ….. this is interesting.
That is the idea yes, not to bother at all the vSphere environment and retrieve all the info from the SDK directly 🙂
Hi!
First I have to say thanks for the great work!
One thing which maybe would be helpful for others too: is there any way to limit the VMs shown in the overview-dashboard? With hundrets of vms this is confusing and not very useful. Maybe to show only the n number VMs with highest metrics or anything like that? I’ve tried to play around with queries, but I’m not so familiar with this and so I found no solution…
Useful too in my opinion would be some way to filter or sort the machines in the VM-dashboard using metrics like CPU-usage too… (but this one would be very complex I think?)
Thanks once again!
Hi Jorge!
Excellent Job, I have done with this setup.
Could you please help me to fetch data using telegraf.conf for
1)Switch L3 version/Cumulus Switch data
2)Fortigate firewall
3)Dell iDRAC
When I am passing snmp command I can get data but in database(influx) I can’t see those metrics
snmpwalk -v3 -l authPriv -u ##### -a SHA -A “########” -x AES -X “########” IPSwitch
If you want my telegraf.conf file, I will share.
Thank you.
Hello Mohd,
Good stuff! So, for:
1. Use SNMP, a small config about it here – https://community.influxdata.com/t/solved-telegraf-influxdb-cisco-snmp/3107/2
2. Use SNMP, a small config about it here – https://community.influxdata.com/t/solved-telegraf-influxdb-cisco-snmp/3107/2
3. Use the next blog post – https://www.jorgedelacruz.es/2019/04/01/en-busca-del-dashboard-perfecto-influxdb-telegraf-y-grafana-parte-xv-monitorizacion-ipmi-de-nuestros-hosts-esxi/ open it with chrome for auto-translation
Hello Jorge,
Thank you for your response,
I went through this
https://community.influxdata.com/t/solved-telegraf-influxdb-cisco-snmp/3107/3
This telegraf.conf is actually dealing with Switch version 2, I am also able to get those metrics. But for the Switch of version 3, I am unable to get those metrics in database(Influxdb), when I am passing snmp command I am getting metrics.
snmpwalk -v3 -l authPriv -u ##### -a SHA -A “########” -x AES -X “########” IPSwitch
My telegraf.conf
# Telegraf Configuration# Configuration for telegraf agent
##For collecting switch data version3
[[inputs.snmp]]
agents = [ "switchIp", "switchIP" ]
# ## SNMPv3 auth parameters
interval = "10s"
sec_name = "#####"
auth_protocol = "SHA" # Values: "MD5", "SHA", ""
auth_password = "########"
sec_level = "#######" # Values: "noAuthNoPriv", "authNoPriv", "authPriv"
context_name = ""
priv_protocol = "#######" # Values: "DES", "AES", ""
priv_password = "#########"
version = 3
community = "public"
name = "snmp"
[[inputs.snmp.field]]
name = "hostname"
oid = "RFC1213-MIB::sysName.0"
is_tag = true
[[inputs.snmp.table]]
name = "snmp"
inherit_tags = [ "hostname" ]
oid = "IF-MIB::ifXTable"
[[inputs.snmp.field]]
name = "load"
oid = ".1.0.0.1.3"
[[inputs.snmp.table.field]]
name = "ifName"
oid = "IF-MIB::ifName"
is_tag = true
[[inputs.snmp.field]]
name = "uptime"
oid = "SNMP-FRAMEWORK-MIB::snmpEngineTime.0"
Did not took a complete file, sending again
telegraf.conf
[[inputs.snmp]]
agents = [ “########”, “#########” ]
# ## SNMPv3 auth parameters
interval = “10s”
sec_name = “######”
auth_protocol = “SHA” # Values: “MD5”, “SHA”, “”
auth_password = “password”
sec_level = “authPriv” # Values: “noAuthNoPriv”, “authNoPriv”, “authPriv”
context_name = “”
priv_protocol = “AES” # Values: “DES”, “AES”, “”
priv_password = “password”
version = 3
community = “public”
name = “snmp”
[[inputs.snmp.field]]
name = “hostname”
oid = “RFC1213-MIB::sysName.0”
is_tag = true
[[inputs.snmp.table]]
name = “snmp”
inherit_tags = [ “hostname” ]
oid = “IF-MIB::ifXTable”
[[inputs.snmp.field]]
name = “load”
oid = “.1.0.0.1.3”
[[inputs.snmp.table.field]]
name = “ifName”
oid = “IF-MIB::ifName”
is_tag = true
[[inputs.snmp.field]]
name = “uptime”
oid = “SNMP-FRAMEWORK-MIB::snmpEngineTime.0”
[[outputs.influxdb]]
## urls will be written to each interval.
# urls = [“unix:///var/run/influxdb.sock”]
# urls = [“udp://127.0.0.1:8089”]
urls = [“http://influxdb:8086”]
Hello Jorge,
I am running on my Ubuntu 16.04.6 machine
Running on top of Docker 18.09.3, build 774a1f4
Docker compose version 1.16.1, build 6d1ac21
Great tutorial, I am having an issue where my datastore information is only collected for about the first hour after initial build then it updates to no data on both the overview dashboard and the datastore dashboard. Not sure why this is happening but any help is appreciated
It seems to e the trend, yes. I will dig into this over the weekend to see what is going on. Thank you
Hi Does this work on older versions of vcenter. i could connect fine when connecting via sdk but i get the below error when connecting to older version.
2019-06-10T11:27:21Z E! [input.vsphere]: Error in discovery for **** : expected element type but have
Works
https://*****/sdk
Doesnt Work
https://******/vsphere-client
Get below error
2019-06-10T11:27:21Z E! [input.vsphere]: Error in discovery for **** : expected element type but have
insecure_skip_verify = true as well
Hello,
It should, what old versions are we talking about? 6.0 and above, or 5.5, 5.0?
Hello Jorge,
I can get metrics now, It was with my password, could you please help me to influx query to set switch-snmp dashboard
thank you.
Hi Jorge,
Thank you so much for your excellent tutorial and the fantastic dashboards! Have you had the opportunity to fix the problem with the disappearing Datastores mentioned a few posts above? I‘m haveing the same problem that the Datastore on my host rund only for about an hour, but my second datastore on my NAS (connected via NFS) is still displayed. Thanks in advance!
Hello,
Nothing just yet, seems the storage is query less frequently, meaning you need to select last 30 minutes or more to see a better perspective of the storage I am afraid
Thanks for the great instructions. I have esxi 6.7 and none of my datastores show up. I do see a usage capacity and I do have ISOS under datastore status in the overview dashboard but the graph shows N/A. When I go to the Datastore dashboard everything is N/A or No data points. Any suggestions.
Hello John,
Give it a few more minutes, can you see the data on the InfluxDB itself, with chronograf?
yes I can see data in chronograf. specifically under vsphere_vm_datastore/dsname I can see the name of my actual datastore.
Do you have the Grafana Pie Chart Panel installed already? Try to install it and let me know
Yes I installed the Grafana Pie Chart Panel as well. How do I look at the query behind the visualization that is actually pulling in the data from the influx DB? Any other suggestions?
Any other ideas for me to try? Are the queries that populate the charts and graphs in a conf file?
Yes, please on Chronograf –
SELECT mean("capacity_latest") AS "mean_capacity_latest", mean("provisioned_latest") AS "mean_provisioned_latest", mean("used_latest") AS "mean_used_latest" FROM "telegraf"."default"."vsphere_datastore_disk" WHERE time > now() - 12h GROUP BY time(5m) FILL(null)See the results on the chart, and also click on table, so you will see how often you have data, probably every 20 minutes or more right?
You know what, I have added a new revision of the dashboard, it is on Github and on grafana.com, grab that and let me know if it works 🙂
Was the overview dashboard the only one updated. I added it but it still looks the same. I will let it run a bit longer and circle back to you tomorrow. Thanks for getting back to me.
It will use the aggregation for the last 3 hours, so take a look later. Can you share a picture at some point?
Here is a link to zipped screenshots. Let me know what you think.
https://emcc-my.sharepoint.com/:u:/g/personal/user2300_ondrive_pw/Eesp0Qvh9MNBqvfpBvM2MfIBd5BR1uTMqfZNLCWkYyXLLQ?e=s5vEee
First one looks odd, the query looks as if it was modified, and the result doesn’t show the name at the bottom, really weird, have you changed anything?
Nope I didn’t change a thing. I was wondering about that as well. Hmmmmm. The only issue on with the dashboard is datastore information and thats on both the overview and the datastore dashboards. Considering what you have seen do you have any other suggestions. When I dl it from the grafan site it says its rev20 is that correct? Do you have a link for another download location/
Since I didn’t change anything I am not really sure what else I can do. Could you maybe give me the code so I can cut and paste it? Any other ideas?
Anything else you want me to try? Could you cut and paste the query that you were expecting to see in the screenshot into a reply so I can cut and paste it into the grafana dashboard?
The query should be like this:
SELECT mean("used_latest") * (100 / mean("capacity_latest")) FROM "vsphere_datastore_disk" WHERE ("source" =~ /^$datastore$/) AND $timeFilter GROUP BY time($__interval) , "source" fill(none)Attaching image:
 On the official grafana site and on the GitHub you can find the dashboard, use the latest version if possible
When I cut and paste the query into the overview dashboard – as pictured in your screenshot – I still get No data for the graph. I don’t see a table that matches “vsphere_datastore_disk” when I look at the DB telegraf.autogen in chronograf. Not sure if the two are related. I imported the new dash and I get the same result.
Everything else works except for the datastore stuff. Not sure what else I can try.
How does your telegraf.conf or the conf where you have the plugin enabled, like this?
## Datastoresdatastore_metric_include = [] ## if omitted or empty, all metrics are collected
# datastore_metric_exclude = [] ## Nothing excluded by default
# datastore_instances = false ## false by default for Datastores only
Does your user has all the privileges on all your Datastores?
vsphere-stats.conf located here /etc/telegraf/telegraf.d
[[inputs.vsphere]]
## List of vCenter URLs to be monitored. These three lines must be uncommented
## and edited for the plugin to work.
vcenters = [ “https://IP/sdk” ]
username = “root”
password = “pass”
## VMs
## Typical VM metrics (if omitted or empty, all metrics are collected)
vm_metric_include = []
# vm_metric_exclude = [] ## Nothing is excluded by default
# vm_instances = true ## true by default
## Hosts
## Typical host metrics (if omitted or empty, all metrics are collected)
host_metric_include = []
# host_metric_exclude = [] ## Nothing excluded by default
# host_instances = true ## true by default
## Clusters
cluster_metric_include = [] ## if omitted or empty, all metrics are collected
# cluster_metric_exclude = [] ## Nothing excluded by default
# cluster_instances = true ## true by default
## Datastores
datastore_metric_include = [] ## if omitted or empty, all metrics are collected
# datastore_metric_exclude = [] ## Nothing excluded by default
# datastore_instances = false ## false by default for Datastores only
## Datacenters
datacenter_metric_include = [] ## if omitted or empty, all metrics are collected
datacenter_metric_exclude = [ “*” ] ## Datacenters are not collected by default.
datacenter_instances = false ## false by default for Datastores only
#
max_query_objects = 256
max_query_metrics = 256
timeout = “1800s”
insecure_skip_verify = true
telegraf.conf located here /etc/telegraf
https://emcc-my.sharepoint.com/:u:/g/personal/user2300_ondrive_pw/EW4opNhiOINJhSkppms6IXEBQ5P1oCCr2D777M8dwObz5Q?e=6IxRrU
I can confirm that there is no vsphere_datastore_disk in the influxdb
https://emcc-my.sharepoint.com/:i:/g/personal/user2300_ondrive_pw/EZEgCJ_1ZG9LhxqNakoAUtQBFs2jMVPKtpjzzJpmWQTkuQ?e=1cf74Q
Any other suggestions?
Hello,
Which VMware version is this? Also, can you use an SSO account instead of root? Like [email protected] or so, because I imagine that IP is a vCenter right?
Best regards
The version is 6.7.0. I will try the SSO account and get back to you. You know I am just thinking about this and I am not running vCenter I am running a standalone ESXi host. Could that be the problem?
Hello,
Yes, this has been built using vCenter 🙂
Ok, I will install it and circle back to you with my results.
Ok I am making progress. I have vCenter 6.7 installed. I have everything setup and now I get this error in the dashboards. – Templating init failed Cannot read property ‘length’ of undefined — any ideas?
Hello,
I just followed the instructions installed Grafana,Telegraf,infuxDB, but when i import the JSON and refresh the board i receiving “No data Points error”. I checked logs i couldn’t find any errors.
Do we need full admin access Vcenter “https://IP/sdk” or else i miss something.
Your help will be much appreciated.
Thanks.
Hello John,
Running latest Grafana v6.2.5? Try with that one
Best regards
Hello Ganesh,
You can try with a full-admin privileges account, I will add the detailed privileges into the blog next week. Do you have data on chronograf?
Best regards
Hi Jorge,
I confirmed that I am using Grafana v6.2.5. When I edit the Datastores-Usage Capacity section in the VMware vSphere Overview dashboard I get this error – cannot read property ‘map’ of undefined. Any ideas?
I performed a fresh install today with all the necessary components including vCenter 6.7. I am getting the majority of the information except for CPU Usage % and Utilization% per vm and no datastore information. The query is looking for vsphere_datastore_disk and I don’t see a corresponding measurement in the influxdb. Any suggestions?
I can confirm that the Datastore items are working in the dashboards. What I have found is that some of the VM metrics are not present in the Telegraf conf file so they are not pulled into Influx. This causes some “no data points” to appear in the results on some dashboards. I.E. usage_average is an item in the Grafana query in the VMs dashboard which causes No data points. I will test out my telegraf conf file and see If I can get all of the necessary metrics. Does that make sense?
I have found this to be a good resource for populating the telegraf conf file and editing queries. https://communities.vmware.com/docs/DOC-5600
Hello Geroge,
I have got most of the data coming through to grafana but seems the datastore values drop time to time and need to restart the telegraf as well as grafana service to make them work? Did you see this kind of behavior within your environment? I am running Influxdb,telegraf as well as grafana with the latest release. Also seem the average CPU utilization results are empty as well.
Any response on this will be greatly appreciated.
Thank you
Pavan, the same thing happens to me. I have gotten it the graphs pretty much running smoothly but from time to time the Datastores – Usage Capacity in the overview slide will show no data. A restart fixes those issues. Either way let me know if anyone thinks of any way to remediate those issues and thanks Jorge for your work.
I wanted to mention I just updated my vsphere and esxi host to 6.7 update 2 and everything is still working.
Jorge, if you get a chance could you copy and paste the script for the Datastores – Usage Capacity panel from the VMware vSphere – Overview dashboard into a reply here on this forum? I need to insert iit nto my dash because the code seems to have disappeared. Thanks in advance.
Hi, here you go:
SELECT mean("used_latest") * (100 / mean("capacity_latest")) FROM "vsphere_datastore_disk" WHERE ("source" =~ /^$datastore$/) AND $timeFilter GROUP BY time($__interval) , "source" fill(none)When in doubt, you can just download the latest version from grafana.com or github 🙂
I know I know 🙂 I am just being mentally lazy. Thanks!
Hello John,
So updating to vsphere 6.7 U2 fixes the datastore as well as the CPU utilization issue?
Everything works except for the Datastore info in the Overview dash.
https://emcc-my.sharepoint.com/:i:/g/personal/user2300_ondrive_pw/EUxn-YLHJMlIvmcMFWWcxIkBYyl5VXh3CZRcxyIH_qsPxw?e=gCVcM5
Hello,
And you have it working for a couple of hours, or days, right? Meaning ingesting data, how does it look your telegraf.conf, or the conf with this enabled? VMware version?
I have had it running for a few days. Using Vcenter server appliance version 6.7update 2. Telegraf is below.
# Read metrics from VMware vCenter
[[inputs.vsphere]]
## List of vCenter URLs to be monitored. These three lines must be uncommented
## and edited for the plugin to work.
vcenters = [ “https://asdfasfasdfasf/sdk” ]
username = “[email protected]”
password = “asdfasdfasdfa”
#
## VMs
## Typical VM metrics (if omitted or empty, all metrics are collected)
vm_metric_include = [
“cpu.demand.average”,
“cpu.idle.summation”,
“cpu.demandEntitlementRatio.latest”,
“cpu.usage.average”,
“cpu.usage.none”,
“cpu.usage.minimum”,
“cpu.usage.maximum”,
“cpu.used.summation”,
“cpu.latency.average”,
“cpu.readiness.average”,
“cpu.ready.summation”,
“cpu.run.summation”,
“cpu.usagemhz.average”,
“cpu.used.summation”,
“cpu.wait.summation”,
“mem.active.average”,
“mem.granted.average”,
“mem.latency.average”,
“mem.swapin.average”,
“mem.swapinRate.average”,
“mem.swapout.average”,
“mem.swapoutRate.average”,
“mem.usage.average”,
“mem.vmmemctl.average”,
“net.bytesRx.average”,
“net.bytesTx.average”,
“net.droppedRx.summation”,
“net.droppedTx.summation”,
“net.usage.average”,
“power.power.average”,
“virtualDisk.numberReadAveraged.average”,
“virtualDisk.numberWriteAveraged.average”,
“virtualDisk.read.average”,
“virtualDisk.readOIO.latest”,
“virtualDisk.throughput.usage.average”,
“virtualDisk.totalReadLatency.average”,
“virtualDisk.totalWriteLatency.average”,
“virtualDisk.write.average”,
“virtualDisk.writeOIO.latest”,
“sys.uptime.latest”,
]
# vm_metric_exclude = [] ## Nothing is excluded by default
# vm_instances = true ## true by default
#
## Hosts
## Typical host metrics (if omitted or empty, all metrics are collected)
host_metric_include = [
“cpu.coreUtilization.average”,
“cpu.costop.summation”,
“cpu.demand.average”,
“cpu.idle.summation”,
“cpu.latency.average”,
“cpu.readiness.average”,
“cpu.ready.summation”,
“cpu.swapwait.summation”,
“cpu.usage.average”,
“cpu.usagemhz.average”,
“cpu.used.summation”,
“cpu.utilization.average”,
“cpu.wait.summation”,
“disk.deviceReadLatency.average”,
“disk.deviceWriteLatency.average”,
“disk.kernelReadLatency.average”,
“disk.kernelWriteLatency.average”,
“disk.numberReadAveraged.average”,
“disk.numberWriteAveraged.average”,
“disk.read.average”,
“disk.totalReadLatency.average”,
“disk.totalWriteLatency.average”,
“disk.write.average”,
“mem.active.average”,
“mem.latency.average”,
“mem.state.latest”,
“mem.swapin.average”,
“mem.swapinRate.average”,
“mem.swapout.average”,
“mem.swapoutRate.average”,
“mem.totalCapacity.average”,
“mem.usage.average”,
“mem.vmmemctl.average”,
“net.bytesRx.average”,
“net.bytesTx.average”,
“net.droppedRx.summation”,
“net.droppedTx.summation”,
“net.errorsRx.summation”,
“net.errorsTx.summation”,
“net.usage.average”,
“power.power.average”,
“storageAdapter.numberReadAveraged.average”,
“storageAdapter.numberWriteAveraged.average”,
“storageAdapter.read.average”,
“storageAdapter.write.average”,
“sys.uptime.latest”,
]
# host_metric_exclude = [] ## Nothing excluded by default
# host_instances = true ## true by default
#
## Clusters
cluster_metric_include = [] ## if omitted or empty, all metrics are collected
# cluster_metric_exclude = [] ## Nothing excluded by default
# cluster_instances = false ## false by default
#
## Datastores
datastore_metric_include = [] ## if omitted or empty, all metrics are collected
# datastore_metric_exclude = [] ## Nothing excluded by default
# datastore_instances = false ## false by default for Datastores only
#
## Datacenters
datacenter_metric_include = [] ## if omitted or empty, all metrics are collected
# datacenter_metric_exclude = [ “*” ] ## Datacenters are not collected by default.
# datacenter_instances = false ## false by default for Datastores only
#
## Plugin Settings
## separator character to use for measurement and field names (default: “_”)
# separator = “_”
#
## number of objects to retreive per query for realtime resources (vms and hosts)
## set to 64 for vCenter 5.5 and 6.0 (default: 256)
# max_query_objects = 256
#
## number of metrics to retreive per query for non-realtime resources (clusters and datastores)
## set to 64 for vCenter 5.5 and 6.0 (default: 256)
# max_query_metrics = 256
#
## number of go routines to use for collection and discovery of objects and metrics
# collect_concurrency = 1
# discover_concurrency = 1
#
## whether or not to force discovery of new objects on initial gather call before collecting metrics
## when true for large environments this may cause errors for time elapsed while collecting metrics
## when false (default) the first collection cycle may result in no or limited metrics while objects are discovered
# force_discover_on_init = false
#
## the interval before (re)discovering objects subject to metrics collection (default: 300s)
# object_discovery_interval = “300s”
#
## timeout applies to any of the api request made to vcenter
# timeout = “60s”
#
## Optional SSL Config
# ssl_ca = “/path/to/cafile”
# ssl_cert = “/path/to/certfile”
# ssl_key = “/path/to/keyfile”
## Use SSL but skip chain & host verification
insecure_skip_verify = true
Hi Jorge, thank you for the amazing tutorials!! One quick question, you graph for “Datastore Read & Write Average”, what do those numbers represent? MB/s, Kilobytes, kilobits?
Jorge,
If I wanted to add additional panels to the vm view how would I go about doing that?
Hello,
You can go to the top, and add any panel you like 🙂 And then search for the info, you can clone a bit, and work from there.
Once I add it to a single vm using variables will it be dynamic or do I have to add it to each host? I have a mixed environment between nodes with and without GPU’s if I can get it to dynamically add the additional panels as new hosts and vm’s Are added I can then work on hiding them if no GPU’s exist.
I followed all instructions, but when I try to go to Data Explorer on Chronograf, I just get a message “A Chronograf error has occurred.”
Hello David,
That is odd, anything on the telegraf.log? Have you connected to your local influxdb correctly from your chronograf?
First of all, thank you for an awesome job! I love the dashboards!
I recently implemented them on a pretty big vmware environment, and while it works perfectly (after some tweaking of the telegraf service) the massive volume of data makes Grafana close to unusable.
We have thousands of VM’s and close to a thousand datastores, and using the full dashboards makes every web browser just grind to a halt.
Is there some way to limit the dashboards? For instance to show only the top 20 datastores with lowest free space?
I’ve played around a bit with the queries and tried to implement some kind of SORT BY and LIMIT, but I have to accept that my SQL-fu is not anywhere near what it should be.
Any tips or suggestions would be greatly appreciated.
Data Stores are not working. When I “SHOW MEASURMENTS” in the influxDB I don’t get any of the following.
vsphere_cluster_clusterServices
vsphere_cluster_mem
vsphere_cluster_vmop
vsphere_datacenter_vmop
vsphere_datastore_datastore
vsphere_datastore_disk
Would this be something wrong in my telegraf.conf? I am only running a single ESXi host.
Hello EricB,
To make this work, you should have a vCenter, as this uses all the extensive API vCenter has. I am working on standalone monitoring for ESXi, let’s hope I can finish it by this year.
Hello Roger,
Are you using last dashboards I have on Grafana.com? I guess you can edit the querys to obtain just the top 10, or top x. I will work on them and upload them on a separate Github folder.
Best regards
Hi Jorge,
I wanted to say I have been using your dashboards in my lab for quite some time and they have been working admirably. The only issues is still the Datastore dashboard. the Total/Free/Capacity Summary always disappear (Display N/A) after some time while the Datastore ReadAverage & WriteAverage continues to report information. Not sure why it happens but if you can give me some suggestions on how to troubleshoot this I will take them and report back with my results.
Hello John,
I have uploaded a new Dashboard trying to fix that particular issue, will you be able to download the new version and let me know? https://grafana.com/grafana/dashboards/8162
Thank you!
I uploaded the new Datastore dashboard (rev 6) and the same behavior was observed. Let me know if there is something else you want me to try.
Awesome work Jorge. Love your dashboards and your easy to follow blog post.
Hello Dear,
Thanks for this great documentation, i tried this but it doesn’t work for me, I have VMware 6.7, when i do show measurements it doesn’t displays any thing related to vsphere.
For Vcenter admin account: could you please let me know the priveleges that it need? i used vcenter admin with read only right.
Could you please help me to solve that.
Regards,
agroua
Hello,
If you have followed all the steps, you should be able to see if you are ingesting data using Chronograf, or the new Grafana Explore, also please debug the telegraf.log, maybe enable the debug mode and see what is going on. If you are using a read-only admin should be enough, I need to write a blog with the required privileges anyways.
Best regards
Many thanks Jorge,
I could get the vsphere information with Read Only permission.
I have another question please: i have some vcenters 6.5 and other 6.7, but i could just got the information of 6.5 but not 6.7. Could you please help? do i have to add additional configs?
Thanks,
Abdelkrime,
Hello Abdelkrime,
You will need an extra config for each vcenter, try it and let me know 🙂
Thanks Jorge,
Which extra config i will need? and how i can do it?
Many thanks,
Hello,
If your vCenter have the same credentials, then you can use:
[[inputs.vsphere]]## List of vCenter URLs to be monitored. These three lines must be uncommented
## and edited for the plugin to work.
vcenters = [ "https://vcenter1.local/sdk","https://vcenter2.local/sdk" ]
username = "[email protected]"
password = "secret"
Try and let me know
Thanks Jorge,
It has been already done, but i retrieve information only from some vcenters 6.5 not from vcenters 6.7.
Could you please help?
Thanks,
Abdelkrime
Please help,
Thanks,
I will need to try with 2 vcenters, will get back to you soon
Ok, Many thanks,
i don’t have problem with vencters 6.5, only with vcenters 6.7
I’m using telegraf version : 1.12.2
Best regards,
Below my telegraf logs for vcenter 6.7.
Thanks for your collaboration,
2019-10-04T16:37:41Z D! [inputs.vsphere]: Creating client: 172.29.161.30
2019-10-04T16:37:41Z D! [inputs.vsphere] Option query for maxQueryMetrics failed. Using default
2019-10-04T16:37:41Z D! [inputs.vsphere] vCenter version is: 6.7.0
2019-10-04T16:37:41Z D! [inputs.vsphere] vCenter says max_query_metrics should be 256
2019-10-04T16:37:41Z D! [inputs.vsphere]: Discover new objects for 172.29.161.30
2019-10-04T16:37:41Z D! [inputs.vsphere] Discovering resources for vm
2019-10-04T16:37:41Z D! [inputs.vsphere] Find(VirtualMachine, /*/vm/**) returned 0 objects
2019-10-04T16:37:41Z D! [inputs.vsphere] Using fast metric metadata selection for vm
2019-10-04T16:37:41Z D! [inputs.vsphere] Discovering resources for datastore
2019-10-04T16:37:41Z D! [inputs.vsphere] Find(Datastore, /*/datastore/**) returned 0 objects
2019-10-04T16:37:41Z D! [inputs.vsphere] Discovering resources for datacenter
2019-10-04T16:37:41Z D! [inputs.vsphere] Find(Datacenter, /*) returned 0 objects
2019-10-04T16:37:41Z D! [inputs.vsphere] Discovering resources for cluster
2019-10-04T16:37:41Z D! [inputs.vsphere] Find(ClusterComputeResource, /*/host/**) returned 0 objects
2019-10-04T16:37:41Z D! [inputs.vsphere] Discovering resources for host
2019-10-04T16:37:41Z D! [inputs.vsphere] Find(HostSystem, /*/host/**) returned 0 objects
2019-10-04T16:37:41Z D! [inputs.vsphere] Using fast metric metadata selection for host
2019-10-04T16:38:00Z D! [outputs.influxdb] Buffer fullness: 0 / 100000 metrics
2019-10-04T16:38:00Z D! [inputs.vsphere] Interval estimated to 1m0s
2019-10-04T16:38:00Z D! [inputs.vsphere]: Collecting metrics for 0 objects of type vm for 172.29.161.30
2019-10-04T16:38:00Z D! [inputs.vsphere] Latest sample for vm set to 0001-01-01 00:00:00 +0000 UTC
2019-10-04T16:38:00Z D! [inputs.vsphere] Interval estimated to 1m0s
2019-10-04T16:38:00Z D! [inputs.vsphere]: Collecting metrics for 0 objects of type datastore for 172.29.161.30
2019-10-04T16:38:00Z D! [inputs.vsphere] Latest sample for datastore set to 0001-01-01 00:00:00 +0000 UTC
2019-10-04T16:38:00Z D! [inputs.vsphere] Interval estimated to 1m0s
2019-10-04T16:38:00Z D! [inputs.vsphere]: Collecting metrics for 0 objects of type datacenter for 172.29.161.30
2019-10-04T16:38:00Z D! [inputs.vsphere] Latest sample for datacenter set to 0001-01-01 00:00:00 +0000 UTC
2019-10-04T16:38:00Z D! [inputs.vsphere] Interval estimated to 1m0s
2019-10-04T16:38:00Z D! [inputs.vsphere]: Collecting metrics for 0 objects of type cluster for 172.29.161.30
2019-10-04T16:38:00Z D! [inputs.vsphere] Latest sample for cluster set to 0001-01-01 00:00:00 +0000 UTC
2019-10-04T16:38:00Z D! [inputs.vsphere] Interval estimated to 1m0s
2019-10-04T16:38:00Z D! [inputs.vsphere]: Collecting metrics for 0 objects of type host for 172.29.161.30
2019-10-04T16:38:00Z D! [inputs.vsphere] Latest sample for host set to 0001-01-01 00:00:00 +0000 UTC
2019-10-04T16:38:00Z D! [inputs.vsphere] Purged timestamp cache. 0 deleted with 0 remaining
2019-10-04T16:38:10Z D! [outputs.influxdb] Wrote batch of 15 metrics in 6.9704ms
2019-10-04T16:38:10Z D! [outputs.influxdb] Buffer fullness: 0 / 100000 metrics
Hello Bro,
I hope that you are doing very well,
As am i very interested by your solution, sorry if i disturb you,
Is there any news?
Regards,
Hello,
I can confirm, I have created another file under /etc/telegraf/telegraf.d/ called mysecondvcenter, with the usual config inside:
[[inputs.vsphere]]## List of vCenter URLs to be monitored. These three lines must be uncommented
## and edited for the plugin to work.
vcenters = [ "https://YOURSECONDVCENTERSDK/sdk" ]
username = "[email protected]"
password = "YOURPASS"
vm_metric_include = []
host_metric_include = []
cluster_metric_include = []
datastore_metric_include = []
datacenter_metric_include = []
max_query_objects = 256
max_query_metrics = 256
timeout = "1800s"
insecure_skip_verify = true
Restarted telegraf service, and all worked fine, no problem at all, seeing both vcenters stats, you can filter on the dashboards.
Hello,
Thanks a lot for your help,
I tried this solution but it doesn’t work for me.
For me even if i put only one vcenter 6.7 it doesn’t work. but vcenter 6.5 works well with tree vcenters.
when i choose only one vcenter 6.7 it doesn’t collecect metrics as in the telegraf log below:
2019-10-12T00:24:09Z D! [inputs.vsphere]: Collecting metrics for 0 objects of type vm for 172.28.161.30
2019-10-12T00:24:09Z D! [inputs.vsphere] Latest sample for vm set to 0001-01-01 00:00:00 +0000 UTC
2019-10-12T00:24:09Z D! [inputs.vsphere] Purged timestamp cache. 0 deleted with 0 remaining
2019-10-12T00:24:09Z D! [inputs.vsphere] Interval estimated to 1m0s
Could you please help, why this configuration doesn’t work for my vcenter 6.7.
Best regards,
Hi Jorge! I love this dashboard, it works really great for monitoring my lab environments etc! Great job!
I know this was designed and planned for vCenter usage; however- I don’t like to waste my resources at home by using even minimal instances of VCSA at home, and I only have two servers at home, one is more or less a NAS while the otherone is running VMware.. However. I noticed that you commented above that you’re working on a standalone version for ESXi… That is great, really looking forward to testing that! meanwhile, do you have any tip/suggestions on how to approach monitoring standalone hosts using Grafana toady? Thanks
Hello, as part of your vsphere config, add this
force_discover_on_init = trueDid you share your config here? I do not remember seeing it
Thakns Jorge,
the parameter is configured,
Below my log, it can discover object from 6;5, but not form 6.7 vcenters, as in the log below.
Is there a difference between Vcenter 6;5 and 6.7 configuratin files?
Many thanks,
2019-10-13T18:17:23Z D! [agent] Successfully connected to outputs.influxdb
2019-10-13T18:17:23Z D! [agent] Starting service inputs
2019-10-13T18:17:23Z D! [inputs.vsphere]: Starting plugin
2019-10-13T18:17:23Z D! [inputs.vsphere]: Creating client: 172.28.161.30
2019-10-13T18:17:23Z D! [inputs.vsphere] Option query for maxQueryMetrics failed. Using default
2019-10-13T18:17:23Z D! [inputs.vsphere] vCenter version is: 6.7.0
2019-10-13T18:17:23Z D! [inputs.vsphere] vCenter says max_query_metrics should be 256
2019-10-13T18:17:23Z D! [inputs.vsphere]: Running initial discovery and waiting for it to finish
2019-10-13T18:17:23Z D! [inputs.vsphere]: Discover new objects for 172.28.161.30
2019-10-13T18:17:23Z D! [inputs.vsphere] Discovering resources for datacenter
2019-10-13T18:17:23Z D! [inputs.vsphere] Find(Datacenter, /*) returned 0 objects
2019-10-13T18:17:23Z D! [inputs.vsphere] Discovering resources for cluster
2019-10-13T18:17:23Z D! [inputs.vsphere] Find(ClusterComputeResource, /*/host/**) returned 0 objects
2019-10-13T18:17:23Z D! [inputs.vsphere] Discovering resources for host
2019-10-13T18:17:23Z D! [inputs.vsphere] Find(HostSystem, /*/host/**) returned 0 objects
2019-10-13T18:17:23Z D! [inputs.vsphere] Discovering resources for vm
2019-10-13T18:17:23Z D! [inputs.vsphere] Find(VirtualMachine, /*/vm/**) returned 0 objects
2019-10-13T18:17:23Z D! [inputs.vsphere] Discovering resources for datastore
2019-10-13T18:17:23Z D! [inputs.vsphere] Find(Datastore, /*/datastore/**) returned 0 objects
2019-10-13T18:17:23Z D! [inputs.vsphere]: Starting plugin
2019-10-13T18:17:23Z D! [inputs.vsphere]: Creating client: 192.168.10.30
2019-10-13T18:17:23Z D! [inputs.vsphere] Option query for maxQueryMetrics failed. Using default
2019-10-13T18:17:23Z D! [inputs.vsphere] vCenter version is: 6.5.0
2019-10-13T18:17:23Z D! [inputs.vsphere] vCenter says max_query_metrics should be 256
2019-10-13T18:17:23Z D! [inputs.vsphere]: Running initial discovery and waiting for it to finish
2019-10-13T18:17:24Z D! [inputs.vsphere]: Discover new objects for 192.168.10.30
2019-10-13T18:17:24Z D! [inputs.vsphere] Discovering resources for vm
2019-10-13T18:17:24Z D! [inputs.vsphere] Find(VirtualMachine, /*/vm/**) returned 19 objects
2019-10-13T18:17:24Z D! [inputs.vsphere] Found 149 metrics for MARAB0-PSN01
2019-10-13T18:17:24Z D! [inputs.vsphere] Found 149 metrics for MARAB0-MAN02
2019-10-13T18:17:24Z D! [inputs.vsphere] Found 149 metrics for MARAB01-CMS01
2019-10-13T18:17:24Z D! [inputs.vsphere] Found 149 metrics for Marab01-SVM01.workplace.local
Hello, can you please paste your config? This works great with either vSphere 6.5 or 6.7, I have 6.7 U3, and I have been using it on all, 6.5, 6.7, 6.7U1, 6.7U2 and now on 6.7 U3.
Hello,
Many thanks Jorge,
Please find below the link to download the config files :
https://wetransfer.com/downloads/0d5d7434ce7e1baad89a74e13971cb8f20191014090419/b6e562dc37bdd22ca371f6e7c0ad40a420191014090419/c79408
3 items
mysecondvcenter.conf
499 Bytes
telegraf.conf
207 KB
vsphere-stats.conf
2.71 KB
I remain at your disposal for any further information,
Best regards,
Abdelkirme
Dear Jorge,
I hope that you are doing very well,
Is there some thing wrong in my config?
Many thanks,
Hello,
I can see they have different IPs, the vCenters, other than that, all looks good, maybe if you put the debug on telegraf you will see more detailed messages? I can confirm this works with vCenter 6.7 latest update, no problem at all.
Let me know
Many thanks,
Yes those are my vcenters, even if i put only one vcenter 6.7 in the config, it doesn’t work.
The Debug is enbaled you can find the log in my previous messages.
2019-10-13T18:17:23Z D! [inputs.vsphere]: Creating client: 172.28.161.30
2019-10-13T18:17:23Z D! [inputs.vsphere] Option query for maxQueryMetrics failed. Using default
2019-10-13T18:17:23Z D! [inputs.vsphere] vCenter version is: 6.7.0
2019-10-13T18:17:23Z D! [inputs.vsphere] vCenter says max_query_metrics should be 256
2019-10-13T18:17:23Z D! [inputs.vsphere]: Running initial discovery and waiting for it to finish
2019-10-13T18:17:23Z D! [inputs.vsphere]: Discover new objects for 172.28.161.30
2019-10-13T18:17:23Z D! [inputs.vsphere] Discovering resources for datacenter
2019-10-13T18:17:23Z D! [inputs.vsphere] Find(Datacenter, /*) returned 0 objects
2019-10-13T18:17:23Z D! [inputs.vsphere] Discovering resources for cluster
Can i check other points?
Thanks
Abdelkrime
Hello Jorge,
I hope that you are doing well.
Is there ana news regarding my issue?
Regards,
HI I really enjoy your dashboards and it seems at least a few of us are having issues with the VM CPU Usage %. Is there a known fix for this?
I’m on
Grafana 4.5
Influx 1.7.8
Telegraf 1.12.3
I have these enabled but every single VM CPU usage on all dashboards are showing “no data”
vm_metric_include = [
“cpu.demand.average”,
“cpu.idle.summation”,
“cpu.latency.average”,
“cpu.readiness.average”,
“cpu.ready.summation”,
“cpu.run.summation”,
“cpu.usagemhz.average”,
“cpu.used.summation”,
“cpu.wait.summation”,
Thanks!
Hello DJ,
For the latest edition of the dashboards, which you can find on Grafana.com or github, I am using cpu.usage.average, please add that into your telegraf conf.
Best regards
Thanks Jorge! That took care of it for VMCPU.
Seems I’m also seeing the same for Datastores (no data) for capacity as well as read/write. Can you confirm which entries should be active in the conf to gather the required datastore info for the dashboards? Looks like I have the following:
## Datastores
datastore_metric_include = [] ## if omitted or empty, all metrics are collected
# datastore_metric_exclude = [] ## Nothing excluded by default
# datastore_instances = false ## false by default for Datastores only
Hello Jorge,
Hello Everybody,
I can confirm that we also have issues with the datastore metrics being shown in the dashboards.
In the Overview dashboard and in the Datastore dashboard the capacity metrics are showing “No Data”.
Once you dig into these dashboards in the Grafa explore view you can see only a few datapoints available for the last couple of days.
For testing I set Telegraf to debug mode but as far as I can see for now, no errors are shown in the logs.
An interesting fact is that restarting telegraf seems to trigger another collection of datapoints after a few minutes, but that does not work in any case.
Any ideas or solutions for this?
We are using the vmware-vsphere-datastore_rev6.json, Telegraf 1.12.3 and vCenter Server Appliance 6.5.0 in our test setup.
Best Regards
Hello,
I will debug this issue, as I am facing it too.
Best regards
Just confirming that I have the same problem with datastore metrics, only a few datapoints gets inserted at what seems to be random intervals.
Jorge, have there been any updates to the Datastore issue/
Yes I have,
Please go to the vsphere.conf, and remove the next:
datastore_metric_include = []And replace it for:
datastore_metric_include = [ "disk.capacity.latest", "disk.used.latest", "disk.provisioned.latest" ]Then just restart the telegraf and influxdb services
sudo service influxdb restartsudo service telegraf restart
It has been working for me for quite some time
I’m getting
[agent] Service for [inputs.vsphere] failed to start: Post https://192.168.1.148/sdk: context deadline exceeded
Can’t get around it.
Esxi 6.7 and vcenter
Telegraf 1.13 on Ubuntu
Tried interval at 6000s – didn’t help
Hello,
Can you please confirm you have the proper configuration on the timeout? I use timeout = “1800s” as you can see on the config, what do you have? How big it is your environment?
Try as well under [agent] to increase the metric buffer limit to something like metric_buffer_limit = 50000
Found the problem. I had to move the interval = “60s” to just before the vcenters = config line. Now all is working. I have a small Esxi – 5 VMs.
Also – the parsing error msg is not very helpful if you have duplicate “interval” records in the same stanza. I had 60s in the beginning and 1800s from you example toward the bottom.
Thanks for letting us know! Glad it is working
Hello Jorge, thx for your work, I love it 🙂
I have a question/request.
On the VMs dashboard, do you know if it is possible to display number of core/cpu for each VM ?
I try to add this panel but i don’t know why, but I can’t do it …
Thx for your help.
Tom
I am getting [agent] Service for [inputs.vsphere] failed to start: Post https://xxx/sdk: context deadline exceeded. But I run telegraf -debug, agent starts to run and its able to write to Influx DB. I am on telegraf 1.13.2, VCSA 6.7 and Centos 7.3
Hello, how big it is your environment? It should work perfectly fine using that configuration.
Hola Jorge!
Gracias por tu trabajo.
Tengo una pregunta:
En que medida estan las gráficas “Datastore Read & Write Average”?
Son iops? MB/sec?
Loving this concept and tutorial! Got everything setup except importing the graphs. When I import the JSON into Grafana, I get error message below.
Dashboard init failed
Template variables could not be initialized: Cannot read property ‘indexOf’ of undefined
Hello,
Oh, that it is weird, try to download the file and upload it manually. Or just try the ID. You using latest Grafana stable version?
I manually downloaded the JSON file and tried to import that way which generated the error. I don’t see an option for using an ID in my Grafana dashboard dialog. This is the output on grafana -v:
root@vmdashboard:~# grafana -v
Version master (commit: NA)
Hello,
Are you running Grafana from a container or so? That it is super weird. Please download the latest from grafana.com 🙂
I installed Grafana on the same Ubuntu box that has the TICK stack, using the instructions from your link:
http://docs.grafana.org/installation/
Yes, that should be fine! It is super weird, not sure what else to do really let me find out.
Hi, first of all thanks for a great tutorial! I’ve been using this for a while but ran into some issues in Telegraf:
Basically I see a lot of this in the telegraf log:
2020-02-28T10:39:15Z W! [outputs.influxdb] Metric buffer overflow; 966 metrics have been dropped
2020-02-28T10:39:15Z W! [outputs.influxdb] Metric buffer overflow; 3734 metrics have been dropped
2020-02-28T10:39:15Z W! [outputs.influxdb] Metric buffer overflow; 3926 metrics have been dropped
2020-02-28T10:39:15Z W! [outputs.influxdb] Metric buffer overflow; 648 metrics have been dropped
2020-02-28T10:39:16Z W! [outputs.influxdb] Metric buffer overflow; 2103 metrics have been dropped
2020-02-28T10:39:16Z W! [outputs.influxdb] Metric buffer overflow; 2676 metrics have been dropped
I use the inputs vsphere recommend config you published. And in the Agent config:
[agent]
interval = “300s”
round_interval = true
metric_batch_size = 2000
metric_buffer_limit = 20000
and default under
[outputs.influxdb]
only set url, database and user/pass.
We have about 1000 running VMs so I think these settings would be enough. Any ideas on what we could try?
Hello,
Try to increase the buffer to 25000, as you are dropping around 4K max sometimes.
Increase that and restar telegraf service.
Best regards
Thanks for your reply, it got rid of the metrics have been dropped error. But I’m still having issues in Grafana using the VMs dashboard, I can’t seem to find the majority of the VMs that we have, only like 10% of the total amount, but I can see all the clusters and hosts that I know the VMs are hosted on. Any idea on this one?
Regards
Carl
Let me take a look, maybe Grafana has some soft limit to do not make crash your Browser by loading 1000VMs metrics. I think vSphere shows you a limit as well, and if you want more you can use the Advanced view and filter, isn’t?
Let me know
Hi, I think I found the reason why, the regexp under variables for the query looks like this:
/^(?![a-zA-Z0-9-_]+_)/ and it doesn’t match fully with our naming convention.
I was thinking that the line above with sampling, vcenter server, cluster and so on would allow me to filter to display the content of that object (like host 1 would display VMs of that esxi server). Is that how it’s supposed to work?
Regards
Carl
Hhehe, Nope, that it is a regex I have to avoid to show my Veeam restored VMs which are usually NAME_restored, so I didn’t want those on the dashboard, but maybe your name convention it is actually like that! Remove it, and let me know.
Hi, after removing it and creating our own we got it to match our needs. However the “default view” when loading the dashboard the first time seems to load all matches, is it possible to start with a blank dashboard and only display what we pick out in the filter?
Regards
Carl
Hello Carl,
Yes, make the view you like, and click Save on the top, it should honor that search, if not, you can always go to variables and play with the search there.
Hi, has anyone got this working with vCenter 6.7 and can help me to get it working? I’ve done the base setup and all is well, I can log the stats of the VM okay, but I just cant seem to get the VMWare vCenter 6.7 working. I know that /sdk has now gone from vcenter so no login / auth is possible in the telegraf config unless i’m missing a essential trick. I’m not a developer by a mear system engineer.
Hello,
This works perfectly with 6.7, what are the errors you are facing in the logs? SDK it is not gone, not in 6.7, not even in 7, which it is not GA still. Please let us know the error, following the step by step, this works out of the box 🙂
Hi, if followed the standard out of the box setup and perhaps I’m a little confused about why it will not talk to vcenter. I’ve placed the vsphere config file I do Telegraf.d and made sure my creds are correct which they are, but I don’t know how to trouble shot the issue from here.
Hello Mark,
Do you have influxdb up and running? And grafana? what does your service status tells you? Like
systemctl grafana status
systemctl influxdb status
systemctl telegraf status
Looks like its the telegraf service that has not started and will not start. If i delete the vsphere-stats.conf and restart the service all is well in the world and telegraf start up okay. I can blow away the environment and reconfigure in case I’ve missed something, but I’m sure I’ve not missed a trick so far.
If you enable the logging on the telegraf config you will see much more details, look for this, and make sure looks like this:
## Log target controls the destination for logs and can be one of "file",## "stderr" or, on Windows, "eventlog". When set to "file", the output file
## is determined by the "logfile" setting.
logtarget = "file"
## Name of the file to be logged to when using the "file" logtarget. If set to
## the empty string then logs are written to stderr.
logfile = "/var/log/telegraf/telegraf.log"
mark@solgrfweb01:/var/log$ service telegraf status
● telegraf.service – The plugin-driven server agent for reporting metrics into InfluxDB
Loaded: loaded (/lib/systemd/system/telegraf.service; enabled; vendor preset: enabled)
Active: failed (Result: exit-code) since Fri 2020-03-13 13:30:40 UTC; 1min 0s ago
Docs: https://github.com/influxdata/telegraf
Process: 1477 ExecStart=/usr/bin/telegraf -config /etc/telegraf/telegraf.conf -config-directory /etc/telegraf/telegraf.d $TELEGRAF_OPTS (code=exited, status=1/FAILURE)
Main PID: 1477 (code=exited, status=1/FAILURE)
Mar 13 13:30:40 solgrfweb01 systemd[1]: telegraf.service: Service hold-off time over, scheduling restart.
Mar 13 13:30:40 solgrfweb01 systemd[1]: telegraf.service: Scheduled restart job, restart counter is at 5.
Mar 13 13:30:40 solgrfweb01 systemd[1]: Stopped The plugin-driven server agent for reporting metrics into InfluxDB.
Mar 13 13:30:40 solgrfweb01 systemd[1]: telegraf.service: Start request repeated too quickly.
Mar 13 13:30:40 solgrfweb01 systemd[1]: telegraf.service: Failed with result ‘exit-code’.
Mar 13 13:30:40 solgrfweb01 systemd[1]: Failed to start The plugin-driven server agent for reporting metrics into InfluxDB.
No telefraf log generated.
telegraf.conf file content
# Global Agent Configuration
[agent]
hostname = “SOLGRFWEB01”
flush_interval = “5s”
interval = “5s”
# Input Plugins
[[inputs.cpu]]
percpu = true
totalcpu = true
collect_cpu_time = true
report_active = true
[[inputs.disk]]
ignore_fs = [“tmpfs”, “devtmpfs”, “devfs”]
[[inputs.io]]
[[inputs.mem]]
[[inputs.net]]
[[inputs.system]]
[[inputs.swap]]
[[inputs.netstat]]
[[inputs.processes]]
[[inputs.kernel]]
# Output Plugin InfluxDB
[[outputs.influxdb]]
database = “telegraf”
urls = [ “http://127.0.0.1:8086” ]
username = “telegraf”
password = “PASSWORD”
## Log target controls the destination for logs and can be one of “file”,

## “stderr” or, on Windows, “eventlog”. When set to “file”, the output file

## is determined by the “logfile” setting.

logtarget = “file”
## Name of the file to be logged to when using the “file” logtarget. If set to
## the empty string then logs are written to stderr.
logfile = “/var/log/telegraf/telegraf.log”
Maybe I’m missing something here?
Now that you have added the log, you need to see what is inside the /var/log/telegraf.log it might be a reason there
no content not even a log file generated under /var/log/telegraf/telegraf.log
Wait, so you have your /etc/telegraf/telegraf.d/vsphere.conf with your config for vSphere, all good, now on the main telegraf.conf you added the next:
## Log target controls the destination for logs and can be one of “file”,## “stderr” or, on Windows, “eventlog”. When set to “file”, the output file
## is determined by the “logfile” setting.
logtarget = “file”
## Name of the file to be logged to when using the “file” logtarget. If set to
## the empty string then logs are written to stderr.
logfile = "/var/log/telegraf/telegraf.log"
Then you restart telegraf service, and then, there is still not telegraf.log file?
still no log file generated.
I am using the latest telegraf version of 1.13.4.
its strange why I see the “failed to start the plugin-driven server agent for reporting metrix info InfluxDB” when checking the status of the telegraf service. The OS us Ubuntu 18.4 in case this helps?
Nope, it will only help when you have data on /var/log/telegraf/telegraf.log
Hi Jorge, i cant seem to get telegraf up in docker compose, is this something you have done before? guide?
hi Jesse, did you managed it yet? I’ve succesfully set up the dashboards of Jorge in a TIG stack, via docker-compose. I used a preconfigured docker-compose definition which uses ‘build’ files.
Hello Jorge,
I hope this message find you well,
I realy like your dashbord, but i still have the issue with VCenter 6.7.
All my VCenters 6.5 works perfect but 6.7 doesn’t work, i updated my telegraf to last version but 6.7 doesn’t work.
I sent some message here on October 2019, from this time i couldn’t configure it for 6.7 i tried many solution, but without success.
I got this message in the telegraf.log
2020-06-13T01:21:59Z I! [inputs.vsphere] Starting plugin
2020-06-13T01:21:59Z D! [inputs.vsphere] Creating client: 172.29.161.30
2020-06-13T01:21:59Z D! [inputs.vsphere] Option query for maxQueryMetrics failed. Using default
2020-06-13T01:21:59Z D! [inputs.vsphere] vCenter version is: 6.7.0
2020-06-13T01:21:59Z D! [inputs.vsphere] vCenter says max_query_metrics should be 256
2020-06-13T01:21:59Z D! [inputs.vsphere] Running initial discovery
2020-06-13T01:21:59Z D! [inputs.vsphere] Discover new objects for 172.29.161.30
2020-06-13T01:21:59Z D! [inputs.vsphere] Discovering resources for datacenter
2020-06-13T01:21:59Z D! [inputs.vsphere] Find(Datacenter, /*) returned 0 objects
2020-06-13T01:21:59Z D! [inputs.vsphere] Discovering resources for cluster
2020-06-13T01:21:59Z D! [inputs.vsphere] Find(ClusterComputeResource, /*/host/**) returned 0 objects
2020-06-13T01:21:59Z D! [inputs.vsphere] Discovering resources for host
2020-06-13T01:21:59Z D! [inputs.vsphere] Find(HostSystem, /*/host/**) returned 0 objects
2020-06-13T01:21:59Z D! [inputs.vsphere] Discovering resources for vm
2020-06-13T01:21:59Z D! [inputs.vsphere] Discovering resources for datastore
2020-06-13T01:21:59Z D! [inputs.vsphere] Find(Datastore, /*/datastore/**) returned 0 objects
2020-06-13T01:21:59Z D! [inputs.vsphere] Using fast metric metadata selection for datastore
2020-06-13T01:22:00Z D! [inputs.vsphere] Interval estimated to 1m0s
2020-06-13T01:22:00Z D! [inputs.vsphere] Collecting metrics for 0 objects of type vm for 172.29.161.30
2020-06-13T01:22:00Z D! [inputs.vsphere] Latest sample for vm set to 0001-01-01 00:00:00 +0000 UTC
2020-06-13T01:22:00Z D! [inputs.vsphere] Interval estimated to 1m0s
2020-06-13T01:22:00Z D! [inputs.vsphere] Collecting metrics for 0 objects of type datacenter for 172.29.161.30
2020-06-13T01:22:00Z D! [inputs.vsphere] Latest sample for datacenter set to 0001-01-01 00:00:00 +0000 UTC
2020-06-13T01:22:00Z D! [inputs.vsphere] Interval estimated to 1m0s
2020-06-13T01:22:00Z D! [inputs.vsphere] Collecting metrics for 0 objects of type cluster for 172.29.161.30
2020-06-13T01:22:00Z D! [inputs.vsphere] Latest sample for cluster set to 0001-01-01 00:00:00 +0000 UTC
2020-06-13T01:22:00Z D! [inputs.vsphere] Interval estimated to 1m0s
2020-06-13T01:22:00Z D! [inputs.vsphere] Collecting metrics for 0 objects of type host for 172.29.161.30
2020-06-13T01:22:00Z D! [inputs.vsphere] Latest sample for host set to 0001-01-01 00:00:00 +0000 UTC
2020-06-13T01:22:00Z D! [inputs.vsphere] purged timestamp cache. 0 deleted with 0 remaining
I think the telegraf couldn’t discover information from the vcenter.
Could you please help me,
Many thanks,
Abdelkrime
Hello,
Are you running latest version of InfluxDB, and Grafana as well?
Best regards
Thanks Jorge,
Yes, I’m using the latest verions:
Grafana v7.0.3 (00ee734baf)
InfluxDB shell version: 1.8.0
Below my config file it contains some vCenters 6.5 and other 6.7, the 6,5 work perfect but the 6.7 not working, as shared in the previous logs.
The config file is :
———————————————————–
## Realtime instance
[[inputs.vsphere]]
## List of vCenter URLs to be monitored. These three lines must be uncommented
## and edited for the plugin to work.
interval = “20s”
vcenters = [ “https://vcenter6.5/sdk”, “https://vcenter6.5/sdk”, “https://vcenter6.7/sdk”, “https://vcenter6.7/sdk” ]
username = “***********”
password = “***********”
vm_metric_include = []
host_metric_include = []
cluster_metric_include = []
datastore_metric_exclude = [“*”]
max_query_metrics = 256
timeout = “60s”
insecure_skip_verify = true
## Historical instance
[[inputs.vsphere]]
interval = “300s”
vcenters = [ “https://vcenter6.5/sdk”, “https://vcenter6.5/sdk”, “https://vcenter6.7/sdk”, “https://vcenter6.7/sdk” ]
username = “************”
password = “************”
datastore_metric_include = [ “disk.capacity.latest”, “disk.used.latest”, “disk.provisioned.latest”]
insecure_skip_verify = true
force_discover_on_init = true
host_metric_exclude = [“*”] # Exclude realtime metrics
vm_metric_exclude = [“*”] # Exclude realtime metrics
max_query_metrics = 256
collect_concurrency = 3
———————————————————————————————–
Many thanks for your collaboration,
Regards,
Abdelkrime
Hello,
Could you please help me.
Many thanks,
Abdelkrime
Does the user you are using has read-only visibility for ALL objects of the vCenter?
Yes, i can access with this user to vcenter and read all objects information. i did the same config as vcenter 6.5.
Many thanks for help.
Regards,
Abdelkrime
Hello Jorge!
Can you tell me if there is a way to not display the VMs that have been removed from vCenter or how to delete the data in the database?
I had a couple of boxes that I use for some test and development purposes that were running when I set up your dashboards. Since then, I have shutdown and destroyed those hosts, but they are still showing up in the dashboards.
Please help?
Yes, He has Read Only on all objects, i can read all objects with it via vcenter access. i used the same configuration used for vcenter 6.5.
Thanks,
Abdelkrime
Hello Jorge,
Can you please tell me why i have this problem (below), i search on forum but i didn’t find a solution!
The vCentres 6,5 work perfectly but the 6.7 not working !!
I hope you can help me as soon as possible
Many thanks.
Regards,
Zoheir.
Hello Zoheir,
Try to remove the vcenter 6.5, and see what the 6.7 does, try to add them in different files, so you can quickly enable or disable them,
Thanks for your respond.
I get the same, even If i keep only the vcenter 6.7 in the config. The vcenter 6.7 doesn’t work, if i add only the host esxi 6.7 it works, but vcenter 6.7 doesn’t work.
So whats next please ?
Thanks for your respond Jorge
I get the same, even If i keep only the vcenter 6.7 in the config. The vcenter 6.7 doesn’t work, if i add only the host esxi 6.7 it works, but vcenter 6.7 doesn’t work
So whats next please ?
Hello Mr.Jorge,
Any update please, i am waiting for you help please !
Hello,
The logs should say something about what is going on. Do you have them enabled on telegraf.conf?
Hello Jorge,
I hope this message find you well,
bellow the logs for the issue with VCenter 6.7.
All my VCenters 6.5 works perfect but 6.7 doesn’t work, i updated my telegraf to last version but 6.7 doesn’t work.
I sent some message here on October 2019, from this time i couldn’t configure it for 6.7 i tried many solution, but without success.
I got this message in the telegraf.log
2020-06-13T01:21:59Z I! [inputs.vsphere] Starting plugin
2020-06-13T01:21:59Z D! [inputs.vsphere] Creating client: 172.29.161.30
2020-06-13T01:21:59Z D! [inputs.vsphere] Option query for maxQueryMetrics failed. Using default
2020-06-13T01:21:59Z D! [inputs.vsphere] vCenter version is: 6.7.0
2020-06-13T01:21:59Z D! [inputs.vsphere] vCenter says max_query_metrics should be 256
2020-06-13T01:21:59Z D! [inputs.vsphere] Running initial discovery
2020-06-13T01:21:59Z D! [inputs.vsphere] Discover new objects for 172.29.161.30
2020-06-13T01:21:59Z D! [inputs.vsphere] Discovering resources for datacenter
2020-06-13T01:21:59Z D! [inputs.vsphere] Find(Datacenter, /*) returned 0 objects
2020-06-13T01:21:59Z D! [inputs.vsphere] Discovering resources for cluster
2020-06-13T01:21:59Z D! [inputs.vsphere] Find(ClusterComputeResource, /*/host/**) returned 0 objects
2020-06-13T01:21:59Z D! [inputs.vsphere] Discovering resources for host
2020-06-13T01:21:59Z D! [inputs.vsphere] Find(HostSystem, /*/host/**) returned 0 objects
2020-06-13T01:21:59Z D! [inputs.vsphere] Discovering resources for vm
2020-06-13T01:21:59Z D! [inputs.vsphere] Discovering resources for datastore
2020-06-13T01:21:59Z D! [inputs.vsphere] Find(Datastore, /*/datastore/**) returned 0 objects
2020-06-13T01:21:59Z D! [inputs.vsphere] Using fast metric metadata selection for datastore
2020-06-13T01:22:00Z D! [inputs.vsphere] Interval estimated to 1m0s
2020-06-13T01:22:00Z D! [inputs.vsphere] Collecting metrics for 0 objects of type vm for 172.29.161.30
2020-06-13T01:22:00Z D! [inputs.vsphere] Latest sample for vm set to 0001-01-01 00:00:00 +0000 UTC
2020-06-13T01:22:00Z D! [inputs.vsphere] Interval estimated to 1m0s
2020-06-13T01:22:00Z D! [inputs.vsphere] Collecting metrics for 0 objects of type datacenter for 172.29.161.30
2020-06-13T01:22:00Z D! [inputs.vsphere] Latest sample for datacenter set to 0001-01-01 00:00:00 +0000 UTC
2020-06-13T01:22:00Z D! [inputs.vsphere] Interval estimated to 1m0s
2020-06-13T01:22:00Z D! [inputs.vsphere] Collecting metrics for 0 objects of type cluster for 172.29.161.30
2020-06-13T01:22:00Z D! [inputs.vsphere] Latest sample for cluster set to 0001-01-01 00:00:00 +0000 UTC
2020-06-13T01:22:00Z D! [inputs.vsphere] Interval estimated to 1m0s
2020-06-13T01:22:00Z D! [inputs.vsphere] Collecting metrics for 0 objects of type host for 172.29.161.30
2020-06-13T01:22:00Z D! [inputs.vsphere] Latest sample for host set to 0001-01-01 00:00:00 +0000 UTC
2020-06-13T01:22:00Z D! [inputs.vsphere] purged timestamp cache. 0 deleted with 0 remaining
I think the telegraf couldn’t discover information from the vcenter. it can access
Could you please help me,
Many thanks,
Abdelkrime
Hello, try the next for your vCenter 6.7
## Realtime instance[[inputs.vsphere]]
## List of vCenter URLs to be monitored. These three lines must be uncommented
## and edited for the plugin to work.
interval = "60s"
vcenters = [ "https://someaddress/sdk" ]
username = "[email protected]"
password = "secret"
vm_metric_include = ["*"]
host_metric_include = ["*"]
cluster_metric_include = ["*"]
datastore_metric_exclude = ["*"]
vm_include ["/"]
host_include ["/"]
max_query_metrics = 256
timeout = "60s"
insecure_skip_verify = true
## Historical instance
[[inputs.vsphere]]
interval = "300s"
vcenters = [ "https://someaddress/sdk" ]
username = "[email protected]"
password = "secret"
datastore_metric_include = [ "disk.capacity.latest", "disk.used.latest", "disk.provisioned.latest" ]
insecure_skip_verify = true
force_discover_on_init = true
host_metric_exclude = ["*"] # Exclude realtime metrics
vm_metric_exclude = ["*"] # Exclude realtime metrics
vm_include ["/"]
host_include ["/"]
max_query_metrics = 256
collect_concurrency = 3
Many thanks Jorge,
I tried the shared configuration, i still get the same issue, please check the log below:
Thanks,
2020-06-30T17:57:01Z I! Loaded inputs: swap system cpu disk diskio kernel mem processes vsphere vsphere
2020-06-30T17:57:01Z I! Loaded aggregators:
2020-06-30T17:57:01Z I! Loaded processors:
2020-06-30T17:57:01Z I! Loaded outputs: influxdb
2020-06-30T17:57:01Z I! Tags enabled: host=gfn01
2020-06-30T17:57:01Z I! [agent] Config: Interval:10s, Quiet:false, Hostname:”gfn01″, Flush Interval:10s
2020-06-30T17:57:01Z D! [agent] Initializing plugins
2020-06-30T17:57:01Z D! [agent] Connecting outputs
2020-06-30T17:57:01Z D! [agent] Attempting connection to [outputs.influxdb]
2020-06-30T17:57:01Z D! [agent] Successfully connected to outputs.influxdb
2020-06-30T17:57:01Z D! [agent] Starting service inputs
2020-06-30T17:57:01Z I! [inputs.vsphere] Starting plugin
2020-06-30T17:57:01Z D! [inputs.vsphere] Creating client: 172.29.161.30
2020-06-30T17:57:01Z D! [inputs.vsphere] Option query for maxQueryMetrics failed. Using default
2020-06-30T17:57:01Z D! [inputs.vsphere] vCenter version is: 6.7.0
2020-06-30T17:57:01Z D! [inputs.vsphere] vCenter says max_query_metrics should be 256
2020-06-30T17:57:01Z D! [inputs.vsphere] Running initial discovery
2020-06-30T17:57:01Z D! [inputs.vsphere] Discover new objects for 172.29.161.30
2020-06-30T17:57:01Z D! [inputs.vsphere] Discovering resources for host
2020-06-30T17:57:01Z D! [inputs.vsphere] Find(HostSystem, /*/host/**) returned 0 objects
2020-06-30T17:57:01Z D! [inputs.vsphere] Using fast metric metadata selection for host
2020-06-30T17:57:01Z W! [inputs.vsphere] Metric name / is unknown. Will not be collected
2020-06-30T17:57:01Z D! [inputs.vsphere] Discovering resources for vm
2020-06-30T17:57:01Z D! [inputs.vsphere] Find(VirtualMachine, /*/vm/**) returned 0 objects
2020-06-30T17:57:01Z D! [inputs.vsphere] Using fast metric metadata selection for vm
2020-06-30T17:57:01Z W! [inputs.vsphere] Metric name / is unknown. Will not be collected
2020-06-30T17:57:01Z D! [inputs.vsphere] Discovering resources for datastore
2020-06-30T17:57:01Z D! [inputs.vsphere] Find(Datastore, /*/datastore/**) returned 0 objects
2020-06-30T17:57:01Z D! [inputs.vsphere] Discovering resources for datacenter
2020-06-30T17:57:01Z D! [inputs.vsphere] Find(Datacenter, /*) returned 0 objects
2020-06-30T17:57:01Z D! [inputs.vsphere] Discovering resources for cluster
2020-06-30T17:57:01Z D! [inputs.vsphere] Find(ClusterComputeResource, /*/host/**) returned 0 objects
2020-06-30T17:57:01Z D! [inputs.vsphere] Using fast metric metadata selection for cluster
2020-06-30T17:57:01Z W! [inputs.vsphere] Metric name / is unknown. Will not be collected
2020-06-30T17:57:01Z I! [inputs.vsphere] Starting plugin
2020-06-30T17:57:01Z D! [inputs.vsphere] Creating client: 172.29.161.30
2020-06-30T17:57:01Z D! [inputs.vsphere] Option query for maxQueryMetrics failed. Using default
2020-06-30T17:57:01Z D! [inputs.vsphere] vCenter version is: 6.7.0
2020-06-30T17:57:01Z D! [inputs.vsphere] vCenter says max_query_metrics should be 256
2020-06-30T17:57:01Z D! [inputs.vsphere] Running initial discovery
2020-06-30T17:57:01Z D! [inputs.vsphere] Discover new objects for 172.29.161.30
2020-06-30T17:57:01Z D! [inputs.vsphere] Discovering resources for vm
2020-06-30T17:57:01Z D! [inputs.vsphere] Discovering resources for datastore
2020-06-30T17:57:01Z D! [inputs.vsphere] Find(Datastore, /*/datastore/**) returned 0 objects
Sorry, I made an edit, try the new output from my previous post, it was edited, let me know.
Thanks Jorge,
I get the same log even with update post, with it telegraf doesn’t start, i think because we need to add = to
vm_include [“/”]
host_include [“/”]
i did it to havet :
vm_include = [“/”]
host_include = [“/”]
The telegraf start again, but i got the same log file shared previously.
Regards,
Abdelkrime
Thanks Jorge,
I applied the update config, but i still get the same logs shared previously.
For the shared conf, telegraf doesn’t start because it needs = charcter on :
vm_include [“/”]
host_include [“/”]
I did it, telegraf starts but i still getting the same issue.
Thanks
Hello,
Completely clueless of what is going on there, I had everything, vSphere 6.5, 6.7, and now 7 and always worked perfectly.
Please open an issue on github and see if you get some luck there:
https://github.com/influxdata/telegraf
Best regards
Thanks Jorge, vSphere Esxi Host 6.7 works, but vcenter 6.7 doesn’t work.
That makes even less sense, as ESXi 6.7 does not have the SDK, so you should not be able to query a single ESXi, but just the vCenter.
Hey Jorge, thanks for the great guide! Have you upgraded to vSphere 7.0 yet? Do you know if the native vSphere plugin for telegraf works with 7?
Hello Lee,
Yes, all working great in vSphere 7, all supported, I have it on my lab since first day of GA 🙂
Cheers!
Came back from vacation to see that the Cluster Status section stopped reporting (no data). This is for Cluster CPU, RAM, Network Usage and Storage Adapter. I imagine watchtower performed an updated on a container and possible caused this to occur.
Restarting containers did not help so I decided to drop the measurement “vsphere_cluster_clusterServices”. I’ve had to do this before for datastores and it would always re-populate. However, “vsphere_cluster_clusterServices” is not coming back up and I’m not sure how to get this measurement to report again. Thoughts?
Hello,
Great work, I’m using your Dashboard, but it will not list my clusters in my 6.7 dashboard, is ‘All’ or nothing, how do I fix this?
Thanks
After I came back from vacation I noticed data stopped being reported for the cluster metrics in the Overview dashboard.
I removed the “vsphere_cluster_clusterServices” from influxDB expecting it to re-populate with new data. However this never occurred. Any ideas on how to restore data for this measurement?
I noticed that data stopped reporting for cluster information in the Overview dashboard.
In order to fix it I tried dropping the “vsphere_cluster_clusterServices” measurement from influxDB. However, the measurement never came back.
Over the weekend I believe there was an update via watchtower to influxdb. All the other stats are still reporting fine.
Any ideas how to get this measurement to start reporting again?
Having posting issues…
I came back after the weekend to find that the cluster metrics have stopped reporting and were dropping off from the graph. Now they show as “no data”.
Went into influxDB and dropped the “vsphere_cluster_clusterServices” measurement in the hopes that it would re-populate with data. However, it never re-populated and the measurement is still not back and reporting.
I even dropped the whole DB and everything came back except for “vsphere_cluster_clusterServices”. No updates were made other then upgrading vcenter server (but that was the week before).
Any ideas?
Jorge, i takes forever to load the VMs Dashboard. I have +-500 VMs in my environment. Is there any way to load the page with just a few or none?
Thanks!
Hello Israel,
Running latest Grafana version? I will take a look at the new options and how to leverage the new load options, bare with me.
Hello Jorge,
thank you very much for your work.
It’s fantastic and easy to be deployed. I really love it.
Just a question in order to complete the current configuration.
I’m trying to enable some alerts on “VMware vSphere VM” Grafana dashboard, in particular, on some panels related to CPU, RAM and network.
Unfortunately, “Edit” option is not available for the panels I mentioned.
How I can reach the target? What I’m missing?
Thank you,
Mauro
Thanks for this. Finally getting around to trying it out. I’m trying a shortcut by installing a TICK container. I’ll let you know how it goes. https://docs.influxdata.com/platform/install-and-deploy/deploying/sandbox-install/
Thanks, Dennis, glad all is working mate!
Will any of these vmware dashboards work without vcenter? i only have one host and no vcenter.
@Jesse, you could use this to send metrics to InfluxDB rather than telegraf which wants vCenter https://github.com/Oxalide/vsphere-influxdb-go
Hello.
I can’t get data like “datastore_metric”
All other data read is corrected.
I am using VMware ESXI 6.5.0.
Influxdb – ver. 1.8.4
Telegraph – ver. 1.18.1
Where could the error be?
Hello,
Which metrics, space? It might take some hours. Let me know. Best regards
Hello.
When i check the status of my “telegraf” i get the following warnings :
[inputs.vsphere] Metric name disk.capacity.latest is unknown. Will not be collected
[inputs.vsphere] Metric name disk.used.latest is unknown. Will not be collected
[inputs.vsphere] Metric name disk.provisioned.latest is unknown. Will not be collected
The configuration of my “telegraph” looks like this:
## Realtime instatnce
[[inputs.vsphere]]
interval = “60s”
vcenters = [ “https://x.x.x.x”,”https://y.y.y.y” ]
username = “xxxxxxx”
password = “yyyyyyyy”
vm_metric_include = []
host_metric_include = []
cluster_metric_include = []
datastore_metric_exclude = [“*”]
max_query_metrics = 256
timeout = “60s”
insecure_skip_verify = true
## Historical instance
[[inputs.vsphere]]
interval = “300s”
vcenters = [ “https://x.x.x.x”,”https://y.y.y.y” ]
username = “xxxxxx”
password = “yyyyyyyyy”
datastore_metric_include = [ “disk.capacity.latest”, “disk.used.latest”, “disk.provisioned.latest” ]
# datastore_metric_include = []
insecure_skip_verify = true
force_discover_on_init = true
host_metric_exclude = [“*”] # Exclude realtime metrics
vm_metric_exclude = [“*”] # Exclude realtime metrics
max_query_metrics = 256
collect_concurrency = 3
In my Grafana dashboards :
– Vmware vSphere – Hosts ===> looks OK
– Vmware vSphere – VMs ===> looks OK
– Vmware vSphere – Overview ===> can’t see “Datastores – Usage Capacity” only
– Vmware vSphere – Hosts IPMI ===> the dashboard does not show the data
– Vmware vSphere – Datastore ===> the dashboard does not show the data
Thank you in advance for your help.
Hello,
vCenter version? Try datastore_metric_include = [ “*” ]
For the IPMI, you need to install the IPMI, and probably tweak the queries, take a look at the dedicated blog for it.
Best regards
Hey Jorge,
First of all, great stuff. Really well explained.
I have installed telegraf and influx db at my end. However, I couldn’t find telegraf logs. I have also tried redirecting it to a separate file using logparser but unfortunatly that is also not working.
Could you please help me to find a way to get telegraf logs?
Thank you in advance.
Hello,
Really simple, on the telegraf.conf, under [agent] you should have this:
[agent]## Log target controls the destination for logs and can be one of "file",
## "stderr" or, on Windows, "eventlog". When set to "file", the output file
## is determined by the "logfile" setting.
logtarget = "file"
## Name of the file to be logged to when using the "file" logtarget. If set to
## the empty string then logs are written to stderr.
# logfile = ""
logfile = "/var/log/telegraf/telegraf.log"
## The logfile will be rotated after the time interval specified. When set
## to 0 no time based rotation is performed. Logs are rotated only when
## written to, if there is no log activity rotation may be delayed.
# logfile_rotation_interval = "0d"
## The logfile will be rotated when it becomes larger than the specified
## size. When set to 0 no size based rotation is performed.
# logfile_rotation_max_size = "0MB"
## Maximum number of rotated archives to keep, any older logs are deleted.
## If set to -1, no archives are removed.
# logfile_rotation_max_archives = 5
## Override default hostname, if empty use os.Hostname()
hostname = ""
## If set to true, do no set the "host" tag in the telegraf agent.
omit_hostname = false
Then reboot telegraf service and go to the /var/log/telegraf/telegraf.log 🙂
Hola Jorge, me encantan éstos dashboards que has creado, pero no consigo graficar los datastores, te pongo mi config de vsphere:
## Realtime instance
[[inputs.vsphere]]
## List of vCenter URLs to be monitored. These three lines must be uncommented
## and edited for the plugin to work.
interval = “60s”
vcenters = [ “https://vcenter.com/sdk” ]
username = “usuario”
password = “contrasenya”
vm_metric_include = []
host_metric_include = []
cluster_metric_include = []
datastore_metric_include = []
max_query_metrics = 256
timeout = “60s”
insecure_skip_verify = true
## Historical instance
[[inputs.vsphere]]
interval = “300s”
vcenters = [ “https://vcenter.com/sdk” ]
username = “usuario”
password = “contrasenya”
#datastore_metric_include = [ “disk.capacity.latest”, “disk.used.latest”, “disk.provisioned.latest” ]
datastore_metric_include = [“*”]
insecure_skip_verify = true
force_discover_on_init = true
cluster_metric_include = [“*”]
datacenter_metric_include = [“*”]
host_metric_exclude = [“*”] # Exclude realtime metrics
vm_metric_exclude = [“*”] # Exclude realtime metrics
max_query_metrics = 256
collect_concurrency = 3
timeout = “180s”
Pero me da el siguiente error:
E! [inputs.vsphere] Getting metric metadata. Discovery will be incomplete. Error: ServerFaultCode: A specified parameter was not correct: interval
Tambien muy de vez en cuando sale:
E! [inputs.vsphere] Error in plugin: while collecting datastore: ServerFaultCode: A specified parameter was not correct: querySpec.interval
Saludos Xavi,
Gracias por el comentario, veo que las comillas no son las inglesas “” parece que usas otras, prueba con comilla simple ‘ ‘ o con las dobles estas ” ” algunas veces se ponen muy pijos.
Ya me dices.
Cambiando la config de telegraf a:
datastore_metric_include = [ “disk.capacity.latest”, “disk.used.latest”, “disk.provisioned.latest” ]
#datastore_metric_include = [“*”]
Y debugando el log:
2021-10-08T10:13:35Z D! [inputs.vsphere] Discovering resources for datastore
2021-10-08T10:13:35Z D! [inputs.vsphere] Find(Datastore, /*/datastore/**) returned 41 objects
2021-10-08T10:13:35Z E! [inputs.vsphere] Getting metric metadata. Discovery will be incomplete. Error: ServerFaultCode: A specified parameter was not correct: interval
2021-10-08T10:13:35Z D! [inputs.vsphere] Found 0 metrics for Test
2021-10-08T10:13:35Z E! [inputs.vsphere] Getting metric metadata. Discovery will be incomplete. Error: ServerFaultCode: A specified parameter was not correct: interval
2021-10-08T10:13:35Z D! [inputs.vsphere] Found 0 metrics for DS-LIN23
2021-10-08T10:13:35Z E! [inputs.vsphere] Getting metric metadata. Discovery will be incomplete. Error: ServerFaultCode: A specified parameter was not correct: interval
2021-10-08T10:13:35Z D! [inputs.vsphere] Found 0 metrics for DS-WIN19
2021-10-08T10:13:35Z E! [inputs.vsphere] Getting metric metadata. Discovery will be incomplete. Error: ServerFaultCode: A specified parameter was not correct: interval
2021-10-08T10:13:35Z D! [inputs.vsphere] Found 0 metrics for DS-LIN31
[…]
2021-10-08T10:13:35Z D! [inputs.vsphere] CollectChunk for datastore returned 0 metrics
2021-10-08T10:13:35Z E! [inputs.vsphere] Error in plugin: while collecting datastore: ServerFaultCode: A specified parameter was not correct: querySpec.interval
De todas formas he probado cambiando a comillas simples ” pero sigue dando el mismo error, no entiendo porqué se queja del “interval”
Hola Jorge, sigo igual, ¿alguna idea?
¿Puede ser por la versión de telegraf?
telegraf –version
Telegraf 1.20.2 (git: HEAD f721f53d)
Telegraf recoge correctamente todas las métricas de los datastores (latencias, etc) excepto las ocupaciones
Hola Jorge podrías comentarme ¿qué versión de telegraf estás utilizando?
Gracias
Hola, tengo la Telegraf 1.20.0 (git: HEAD f489cff3)
Hi Brother,
how to install and configure vcenter monotoring with grafana.
why there is no data after a few days perform?
Hello,
I am not sure, how does it look your telegraf.conf, or the vsphere.conf? What data can you see if you go to the https://influxdb:8086
Not sure what’s wrong with my config but using your dashboards I get only templating errors
Templating
Template variable service failed InfluxDB Error: error parsing query: found FROM, expected SELECT, DELETE, SHOW, CREATE, DROP, EXPLAIN, GRANT, REVOKE, ALTER, SET, KILL at line 1, char 1
1 minute ago
Templating [datastore]
Template variable service failed InfluxDB Error: error parsing query: found FROM, expected SELECT, DELETE, SHOW, CREATE, DROP, EXPLAIN, GRANT, REVOKE, ALTER, SET, KILL at line 1, char 1
etc ..
Manually selecting graphs works so data is collected fine.
Hello Tom,
It depends on the InfluxDB version you are using, are you using v1 or v2. You can easily know it if you are using buckets or databases. If buckets, and tokens, v2.
If using v1, you need to download an older version of the dashboard that you can find on the grafana site, under versions, you will see the one for Influx v1.x
Let me know
Its working great. We can see all the metrics except below events data;
VM operations: # changes, clone, create, deploy, destroy, power, reboot, reconfigure, register, reset, shutdown, standby, vmotion.
Any idea on which measurement or fields we can see these event information on influxdb or grafana console.
Hello,
Those are more Cluster operations, perhaps you are dropping some metrics; what is the telegraf log telling you?
Thanks!
Hi Jorge,
aI have successfully done all the Installations. Telegraph is pulling data. Influx stores data.
But the dashboards give an error. Do you know the solution for this error?
Error pictures are below.
https://resimyukle.io/r/35X4TbLCS8
https://resimyukle.io/r/35X4TbLCS8
Thank you
Hello,
That seems like you have Influx v1.x, so on Grafana.com on my dashboards, go to versions and download the one for InfluxDB v1.x
I followed these two guides but unable to see any data from vCenter? Any help please.
https://www.youtube.com/watch?v=0bP7eUOAMkc&t=315s&ab_channel=WaterSpiderLabs
https://computingforgeeks.com/how-to-monitor-vmware-esxi-with-grafana-and-telegraf/
Hello,
Those steps seems outdated, please start from scratch and install InfluxDB v2.0, and ocnfigure Grafana with this new Flux technology – https://jorgedelacruz.uk/2021/04/14/looking-for-the-perfect-dashboard-influxdb-telegraf-and-grafana-part-i-installing-influxdb-telegraf-and-grafana-on-ubuntu-20-04-lts/
Then, yes, come back to this guide and it should work out of the box.
Has anyone gotten this process to work on ESXr 7? I get this “error parsing query: found FROM, expected SELECT, DELETE, SHOW, CREATE, DROP, EXPLAIN, GRANT, REVOKE, ALTER, SET, KILL at line 1, char 1” in the dashboards i download from Grafana..
Has anyone gotten this to work with ESX 7 or above?
Hello John,
That is most likely because you have InfluxDB v1.8, but you are using the Grafana Dashboard InfluxDB v2.0. If you want to keep InfluxDB v1.8, then you need the next dashboard a bit outdated – https://grafana.com/api/dashboards/8159/revisions/38/download
Let us know
Thanks for the response. Ill try and update the InfluxDB and report back, thanks!!
Hello John,
Looking forward to hearing more from you.
Hi Sir Jorge,
BTW, thanks a lot for this.
recently I successfully set up grafana, influxdb and telegraf using docker containers each.
and I am looking to add an additional 3 to 4 vcenters.
do you have any steps on how to add multi venter but diff credentials.
thank you,
regards, Val
Hello Val,
Easy, create a vsphere.conf file per each vCenter 🙂
Hi Sir Jorge,
do you mean in creating a vsphere.conf per each vcenter is creating this file under /etc/telegraf?
for example: i will create vcenter2.conf in /etc/telegraf? same path with telegraf.conf?
then the next step is restarting only the telegraf service?
or maybe if possible you can list down the steps that i need to do.
thank you in advance
Hello, yes that is right, a .conf per vCenter is the easiest
Hi Jorge,
Sorry it took so long to report back but I got everything working with InfluxDB v2.0. There is one minor problem with the VMware vSphere VMs though. The storage adapter latency section states that data is missing a number field. If there is anything you can think of for me to try let me know.
Other than that your dashboards are working beautifully!
I have gone through this article and configured Grafana to monitor Single ESXi host. I am not able to get datastore details in grafana dashboard. I have also checked InfluxDB bucket but not getting any details regarding datastore. Can anyone have idea where did I made mistake?
Grafana: 9.4.3
Telegraf: 1.25.3
InfluxDB: v2.6.1
—————————————————————————————–
Telegraf conf file.
## Historical instance
[[inputs.vsphere]]
interval = “300s”
timeout = “300s”
separator = “_”
vcenters = [ “https://192.192.7.18/sdk” ]
username = “secret_user”
password = “secret_pwd”
insecure_skip_verify = true
use_int_samples = false
force_discover_on_init = true
max_query_metrics = 256
collect_concurrency = 3
datastore_metric_include = []
host_metric_exclude = [“*”] # Exclude realtime metrics
vm_metric_exclude = [“*”] # Exclude realtime metrics
——————————————————————————————
Error getting in Telegraf Log file.
D! [inputs.vsphere] Find(Datastore, /*/datastore/**) returned 4 objects
D! [inputs.vsphere] Found 202 metrics for xxxxxx.local
E! [inputs.vsphere] Getting metric metadata. Discovery will be incomplete. Error: ServerFaultCode: A specified parameter was not correct: entity
D! [inputs.vsphere] Found 0 metrics for EMC_6_1_LUN
E! [inputs.vsphere] Getting metric metadata. Discovery will be incomplete. Error: ServerFaultCode: A specified parameter was not correct: entity
D! [inputs.vsphere] Found 0 metrics for datastore1
E! [inputs.vsphere] Getting metric metadata. Discovery will be incomplete. Error: ServerFaultCode: A specified parameter was not correct: entity
D! [inputs.vsphere] Found 0 metrics for LenovoESX01
E! [inputs.vsphere] Getting metric metadata. Discovery will be incomplete. Error: ServerFaultCode: A specified parameter was not correct: entity
Hello,
This plugin only collects data from a vCenter, not from a single ESXi, as it doesn’t have all the required metrics. You should try SNMP for a single ESXi, but I do not have any dashboard for that.
Hello Jorge,
Recently moved netdata to grafana as it has more muscles than netdata for vsphere monitoring. Thanks to you and your great dashboard and tutorial I have finally managed to get it working. Now I have a question. VM CPU usage has no data. Hosts has the cpu usage data but VMs doesn’t have any CPU usage data on any of the dashboards. I am using Influx V2, Telegraf 1.26 and Grafana 9.? (latest on this date)
Can you please help me out on this? Thanks in advance.
Hello mate,
That is strange, can you see RAM and other metrics of the VMs but not CPU? Does it happen the same on your vSphere Client?
Hello again, I have sorted it out with changing the vm.average.cpumhz to vm.average.cpu in my vsphere.conf. Thank you so much
why would vm count be off. Telegraf shows 285 discovered but when guesthostname tagging in grafana its missing like 50 ? I tried many different ways of tagging always the same resluts
Hello, is that in any particular widget? I tend to use vmname instead of guesthostname.
Let me know
Hello Jorge, this is a great utility! Can you point me to any documentation that specifies all usable fields/properties/etc that can be filtered in influxdb? I guess whatever you used to build out your dashboards? Examples like “vsphere_host_cpu”, usage_average, etc below:
I would like to build some of our own like a gauge showing a total count of logical cpu’s per cluster compared to total VM cpu count in that cluster. Similar for cluster memory. Thank you!
from(bucket: v.defaultBucket)
|> range(start: v.timeRangeStart, stop: v.timeRangeStop)
|> filter(fn: (r) => r[“_measurement”] == “vsphere_host_cpu”)
|> filter(fn: (r) => r[“_field”] == “usage_average”)
|> filter(fn: (r) => r[“cpu”] == “instance-total”)
|> filter(fn: (r) => r[“vcenter”] =~ “”)
|> filter(fn: (r) => r[“clustername”] =~ “”)
|> group(columns: [“clustername”])
|> aggregateWindow(every: v.windowPeriod, fn: mean, createEmpty: false)
|> yield(name: “mean”)
Hello Kevin, I have already added that more or less on the latest version of the dashboard:
https://grafana.com/grafana/dashboards/8159-vmware-vsphere-overview/?tab=revisions
Not a gauge but in text. It is per host, but easy to change the queries. To see some of the values:
https://github.com/influxdata/telegraf/blob/master/plugins/inputs/vsphere/README.md
But you can see the values on your vSphere, whatever is there under performance should be on the InfluxDB
Hi Jorge,
aI have successfully done all the Installations, all are listed in the available buckets
But the dashboards give an error. Do you know the solution for this error?
i alr use the updated influxdb, telegraf, and grafana
Hello Hilmy,
Without seeing or knowing the error, I can not help mate.
it wont work with the vsphere monitoring, but for system util world perfectly
https://drive.google.com/file/d/11Amug9Obwjq_O2DtVw7K4n0LNnY5VbnW/view?usp=sharing
Hello,
Well, it seems that the telegraf plugin is not collecting data perhaps. Please anble telegraf log, and debug what is happening there 🙂
Hallo
I try some days to install vmware telegraf-InfluxDB v2.7.1 and Grafana in ubuntu server 22.04 with no success.
Is there any guide about from all these new updates?
Thank you
Hi Jorge
This guide is working for vmware esxi host client?
I have 8 vms inside.
I try to install in ubuntu 22.0.4 with no success.
Thank you
Hello John,
What guide you followed? What are the errors you see?
Thanks!
Hi,
I have an issue to restart the telegraf but debug mode. can you please help me to find what is the issue ?
***********DEBUG LOG***********
[inputs.vsphere] Collecting metrics for 0 objects of type host for [VCENTER]
[inputs.vsphere] Latest sample for host set to 0001-01-01 00:00:00 +0000 UTC
[inputs.vsphere] Raw interval 19.999830628s, padded: 29.999830628s, estimated: 20s
[inputs.vsphere] Interval estimated to 20s
[inputs.vsphere] Collecting metrics for 0 objects of type vm for [VCENTER]
[inputs.vsphere] Latest sample for vm set to 0001-01-01 00:00:00 +0000 UTC
[inputs.vsphere] Raw interval 20.006626559s, padded: 2m50.006626559s, estimated: 5m0s
[inputs.vsphere] Interval estimated to 5m0s
[inputs.vsphere] Collecting metrics for 0 objects of type datastore for [VCENTER]
[inputs.vsphere] Latest sample for datastore set to 0001-01-01 00:00:00 +0000 UTC
[inputs.vsphere] Raw interval 20.005986299s, padded: 2m50.005986299s, estimated: 5m0s
[inputs.vsphere] Interval estimated to 5m0s
[inputs.vsphere] Collecting metrics for 0 objects of type cluster for [VCENTER]
[inputs.vsphere] Latest sample for cluster set to 0001-01-01 00:00:00 +0000 UTC
[inputs.vsphere] purged timestamp cache. 0 deleted with 0 remaining
[outputs.file] Wrote batch of 25 metrics in 232.572µs
[outputs.file] Buffer fullness: 0 / 10000 metrics
[outputs.influxdb_v2] Wrote batch of 25 metrics in 5.543385ms
[outputs.influxdb_v2] Buffer fullness: 0 / 10000 metrics
######
Telegraf Version : 1.29.2
Vcenter version : 7
Hello, what is the issue exactly? I can not see any error in there.
thank you!
Hi there, first, thanks for your awesome post! Does anybody know which explicit permissions in vCenter I have to set to make this work? Of course, I’m trying to accomplish this with the least privilege and a new ‘monitoring’ User and Role. Thank you in advance
Hello, just read-only from vCenter to all child.
Hi Jorge,
First of all, thank you so much for the awesome dashboards.
I think i’ve found the issue as to why some people aren’t able to get the VM CPU % graph working.
In the below code:
from(bucket: v.defaultBucket)
|> range(start: v.timeRangeStart, stop: v.timeRangeStop)
|> filter(fn: (r) => r[“_measurement”] == “vsphere_vm_cpu”)
|> filter(fn: (r) => r[“_field”] == “usage_average”)
|> filter(fn: (r) => r[“cpu”] == “instance-total”)
|> filter(fn: (r) => r[“vmname”] =~ /${virtualmachine:regex}/)
|> group(columns: [“vmname”])
|> aggregateWindow(every: v.windowPeriod, fn: mean, createEmpty: false)
|> yield(name: “mean”)
It looks like the usage_average field is missing for some reason now. In influxdb, I can see usagemhz_average, but not usage_average.
Kind regards,
Tim
Hola Jorge, Tengo problemas de conexion con un vcenter vsphere server version 6.0, cuando intento conectar a la URL https://vcenter.dirip/sdk me aparece un error EOF. es compatible la version del Vcenter con la aplicacion del agente de telegraf??
Te conteste en el blog en Castellano
Hello Tim, on what Dashboard, and widget, please mate.
Cheers!
Hello Jorge,
first of all thanks for the incredible work you do on this 🙂
Second everything is working fine but we are trying to find a way to sort the datastore usage percent in descending order (highest usage on top)
The dashboard shows valued depending on the datastore name.
I have tried various things with sort(), yield to add another field to be used for sort, adding transformation as well but I can’t find a way to do this. No matter what I do, all I get is either error or on the sort I have just the datastore name but I would like to be able to sort by value.
Antonin
Hello Antonin, which widget specifically, please? Thank you!
Just started using your dashboards and finally got some collections to work with telegraf. I am however running into an issue,
[inputs.vsphere] Metric name is unknown. will not be collected. I have not been successful in finding anyone else with the same error and was wondering if you had any insight.
I am also getting [inputs.vsphere] error in plugin: while collecting resourcepool: serverfaultcode: This operation is restricted by the administrator – ‘vpxd.stats.maxquerymetrics’. contact your system administrator. I just need to go back through and increase the vCenter/s just wish it would log which vCenter.
First of all, thank you for sharing such a great dashboard. I need to add one more feature, but since I’m not very familiar with modifying queries and dashboards, I haven’t been able to implement it successfully. That’s why I’m reaching out for advice here.
Would it be possible to display the total sum of datastore usage per cluster? For example, on the second row of the dashboard you shared, uptime hours, CPU, and memory usage are displayed per cluster. I would like to add the total datastore sum per cluster next to them.
Your advice would be a great help!
Hello,
Using the latest version of the dashboard (v50 as of 4/20/2025), Grafana 11.6.0, Telegraf 1.34.2 (git: HEAD@552f7e20), and influxdb2-2.7.11 against a vcenter server version 8.0.3.0.0500. ESX hosts are version 7.0.3, 24585291.
Influx does not seem to have a field called totalReadLatency_average for vmware_vm_datastore referenced by the storage adapter latency panel in the VMs dashboard. I do not see a _measurement for vms that has datastore in it. Looking at the data explorer in the influxdb gui, I don’t even see a datastore measurement under “vm_”.
I’m new to influx and telegraf, so maybe I’m missing something simple.
Any ideas on what I’m missing? I don’t see any obvious errors with telegraf not getting results with a wuery, but not entirely sure what to look for either.
Hello Bob, let me upgrade to the latest vCenter release and check mate.
Hello Jorge
First of all thank you for making such a great monitoring pack for Vmware Sphere, i managed to run everything on:
Ubuntu: 24.04.2 LTS
Telegraf 1.34.4
Influxdb 2.7.11
Grafana — Also Latest version
At this moment i am running it in a test environment, as i am not very familiar with telegraf, influxdb and grafana i am trying to get used to it….before going to monitor our DHCI systems.
I have a next question: Is it possible in VM dashboard template to exclude some virtual machines? (for instance VCLS machines)….from where it can be excluded? from telegraf config? influxdb config? or maybe from Grafana directly?
As Telegraf is still cited as primary source of raw data coming from vmware vsphere i tried there changing some configs (with help of chatgpt) but no result….
I blog frequently and I genuinely thank you for your content. This great article has truly peaked my interest. I will take a note of your blog and keep checking for new information about once per week. I opted in for your Feed too.
I was suggested this web site by means of my cousin. I’m no longer positive whether or not this post is written by him as nobody else understand such certain about my trouble. You are incredible! Thank you!
whoah this weblog is magnificent i love studying your posts. Keep up the good work! You recognize, many individuals are looking round for this information, you can help them greatly.